In the fast-paced world of industrial manufacturing, traditional methods of monitoring process performance often fall short, leaving decision-makers with outdated information and delayed responses to critical issues. Imagine a factory floor where every machine, every process, and every metric is instantly visible, allowing for immediate intervention and continuous optimization. This vision is rapidly becoming a reality through the strategic implementation of digital dashboards, a pivotal tool in driving Lean Manufacturing and Continuous Improvement initiatives. These dynamic visual interfaces transform raw data into actionable insights, empowering manufacturers to enhance efficiency, reduce waste, and maintain a competitive edge in a demanding global market.
What are Digital Dashboards in Manufacturing?
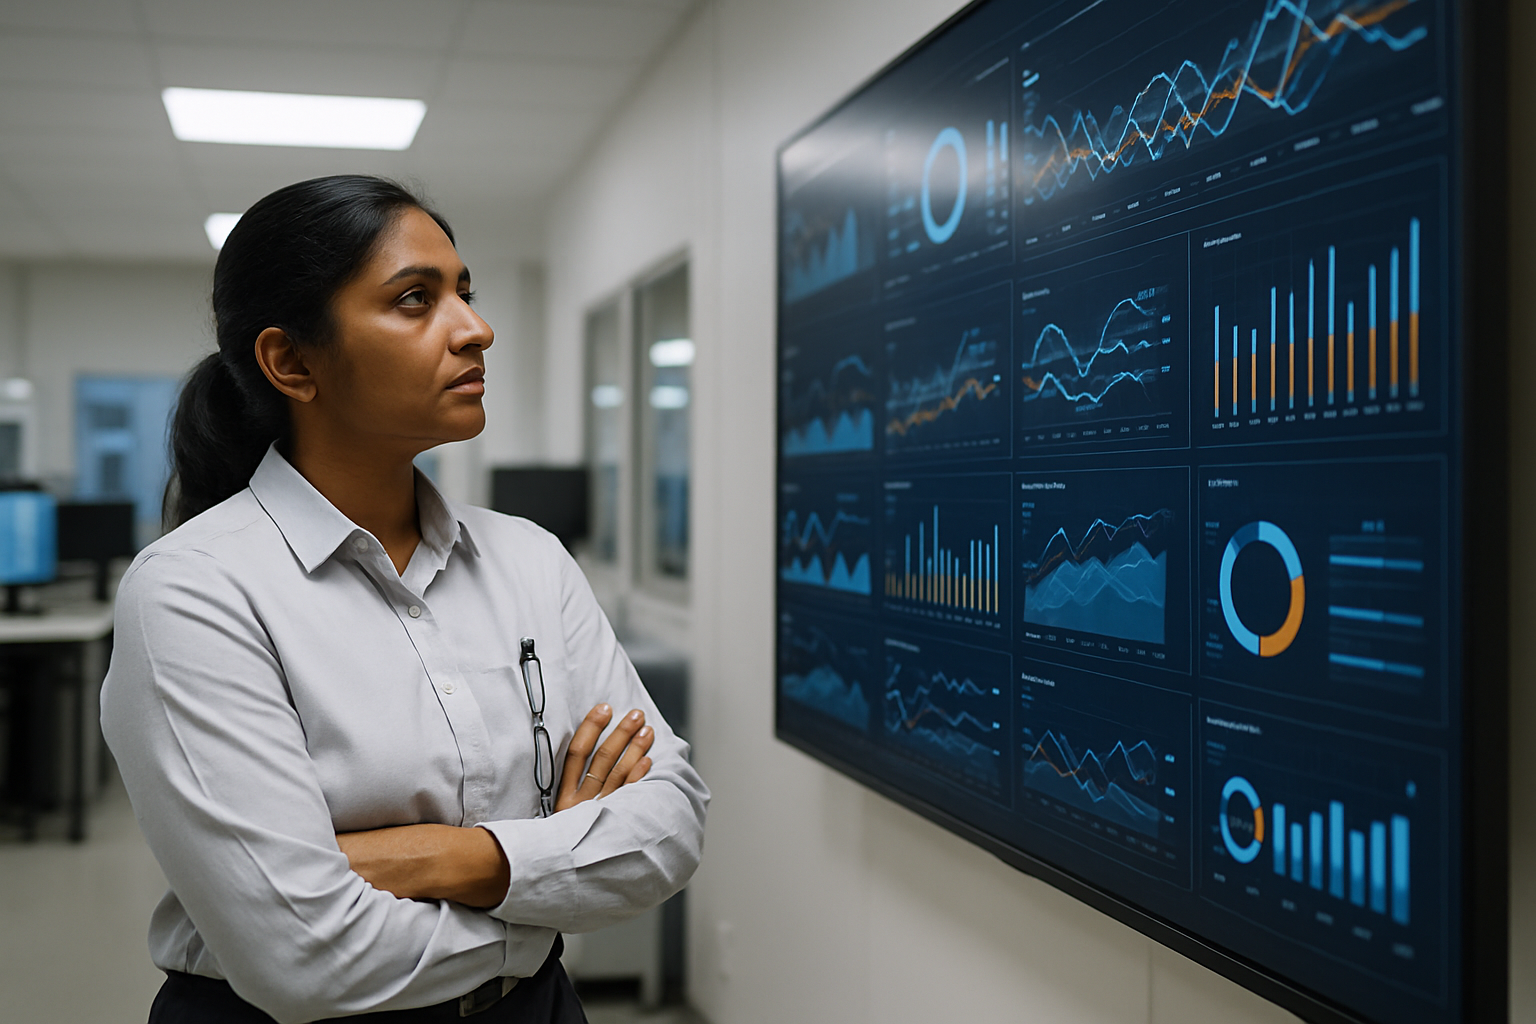
Digital dashboards in manufacturing are centralized, dynamic tools that display production data and key performance indicators (KPIs) as they happen, providing instantaneous visibility into crucial production parameters. These dashboards aggregate and analyze data from various sources such as machines, sensors, production lines, Enterprise Resource Planning (ERP) systems, and Quality Management Systems (QMS). By presenting this complex data in easy-to-understand visual displays, such as charts, graphs, and color-coded indicators, digital dashboards bridge the gap between data and action, making patterns, trends, and anomalies clearly visible at a glance.
The Transformative Benefits for Lean Manufacturing and Continuous Improvement
Digital dashboards are indispensable for manufacturers committed to Lean Manufacturing and Continuous Improvement (CI) principles. They provide the real-time insights necessary to eliminate waste, streamline processes, and foster a culture of ongoing enhancement.
Real-time Visibility and Faster Decision-Making
One of the most significant advantages of digital dashboards is their ability to provide instantaneous visibility into operations. Production managers can monitor current production rates, machine status, and performance metrics in real-time, enabling quick, data-driven decisions. This real-time data allows operators and managers to respond swiftly to changes in the production process, preventing minor issues from escalating into major disruptions.
Increased Efficiency and Productivity
By offering a holistic view of the production process, digital dashboards significantly enhance operational efficiency. They help identify bottlenecks, optimize workflows, and improve resource allocation by providing insights into current workloads and capacities. Automating data collection, a key feature of these dashboards, eliminates manual effort, reduces errors, and ensures that information is current and accurate, leading to improved productivity.
Proactive Problem Solving and Root Cause Analysis
Through continuous monitoring, digital dashboards highlight performance issues across the production floor, such as equipment operating below optimal speeds, frequent breakdowns, or high defect rates. They provide powerful analytical tools that help identify the underlying causes of production issues, like equipment failure patterns, material shortages, or process design flaws. This capability enables proactive problem-solving, allowing teams to address issues swiftly before they lead to production halts or significant losses.
Enhanced Quality Control
Quality indicators are constantly updated on digital dashboards, allowing for immediate intervention when issues arise. Process and quality engineers can track metrics, providing instant feedback on whether processes meet specifications and enabling immediate corrective actions. This ensures higher product quality and reduces rework or scrap.
Improved Collaboration and Communication
Digital dashboards foster better communication and collaboration among different departments and teams. By providing a shared, consistent view of performance data, they align everyone towards common goals and facilitate smoother handoffs between interdependent processes. Visual alerts can highlight anomalies, allowing teams to quickly coordinate responses.
Supporting Continuous Improvement (CI) Culture
CI dashboard tools are digital platforms that display real-time metrics and project statuses related to continuous improvement efforts. They empower teams with the insight to solve problems, the tools to follow through, and the data to prove that CI initiatives are working. This visibility promotes a culture where every team member feels empowered to act on data to drive progress.
Key Metrics for Real-time Performance Monitoring
Effective digital dashboards focus on a select set of Key Performance Indicators (KPIs) that directly impact operational goals and continuous improvement.
- Overall Equipment Effectiveness (OEE): A cornerstone metric combining availability, performance, and quality into a single score, indicating the percentage of planned production time that is truly productive.
- Cycle Time: Measures the total elapsed time from the start to the completion of a process, revealing process speed and efficiency.
- First Pass Yield (FPY): Calculates the percentage of units completed correctly on the first attempt without rework, scrap, or repair, directly measuring process quality.
- Throughput: The rate at which products are produced or processed, often tracked per minute or hour.
- Quality Indicators: Real-time defect rates, scrap rates, and adherence to quality specifications.
- Machine Status and Downtime: Uptime, availability, fault alerts, and reasons for stoppages.
- Production Rate/Output: Current production volume versus target.
- Cost Reduction: Metrics like production costs, unit costs, and overall cost savings to track the financial impact of improvements.
- Employee Suggestions Implementation Rate: Measures the human element of improvement, ensuring employee feedback is acted upon.
Essential Components of Effective Digital Dashboards
To be truly effective, manufacturing digital dashboards should incorporate several key functionalities:
Robust Data Integration
A critical component is the ability to seamlessly integrate data from disparate sources across the manufacturing ecosystem, including machines, sensors, SCADA systems, MES, ERP, and quality control systems. Using a common data model helps ensure consistency and accurate analysis.
Intuitive Data Visualization
Dashboards must translate complex data into clear, easy-to-understand visual formats. This includes using various chart types (line, bar, pie), gauges, and color-coding to highlight performance status, trends, and anomalies. The design should be simplistic and intuitive, following principles like the “5-second rule” – users should be able to grasp critical information within five seconds.
Customizable and Role-Based Views
Different stakeholders require different levels of detail and types of information. Effective dashboards offer customizable views, allowing operators, supervisors, engineers, and executives to access information relevant to their specific roles and goals.
Real-time Alerts and Notifications
The ability to generate automated alerts and notifications when metrics deviate from predefined thresholds or when anomalies occur is crucial. This ensures immediate attention to critical issues, enabling swift corrective actions.
Historical Data and Trend Analysis
Beyond real-time status, dashboards should allow users to view historical data, identify long-term trends, and perform root cause analysis. This capability supports continuous improvement efforts by revealing patterns and the impact of past changes.
Implementing Digital Dashboards: A Step-by-Step Guide
Implementing real-time digital dashboards requires a structured approach to ensure success.
1. Assessment and Planning
Begin by thoroughly assessing current processes, identifying specific business needs, and defining clear objectives for the dashboard. Determine what questions the dashboard should answer and which KPIs are most critical to track. Evaluate your existing technical infrastructure and data sources.
2. Data Source Identification and Integration
Identify all relevant data sources on the shop floor, which may include machines, sensors, production lines, and enterprise systems. Develop a strategy for integrating this data, potentially using data warehouses, data lakes, or ETL (extract, transform, load) tools, and establish a common data model to ensure consistency.
3. Dashboard Design and Prototyping
Focus on designing a dashboard that is simple, intuitive, and user-relevant. Choose the right visualizations for each data point and prioritize the most important KPIs by placing them prominently. Develop prototypes and gather feedback from end-users, as their insights are crucial for ensuring usability and relevance.
4. Development and Testing
Build the dashboard using chosen visualization tools. Thoroughly test the dashboard to ensure data accuracy, reliability, and expected performance. Implement data validation checks to prevent errors.
5. Deployment and Training
Deploy the dashboard to your users. Crucially, provide comprehensive training on how to use it effectively, understand the metrics, and interpret the visualizations. Ensure accessibility across various devices, including mobile, for on-the-go monitoring.
6. Monitoring and Iteration
Digital dashboards are not a static solution. Continuously monitor the dashboard’s performance, gather user feedback, and make adjustments as needed. Regularly review the relevance and accuracy of the displayed information to ensure it continues to support operational goals.
Challenges and Best Practices for Success
While the benefits are substantial, implementing digital dashboards can present challenges.
Common Challenges
- Data Overload: Too much information can clutter the dashboard and obscure key insights.
- Manual Tracking Methods: Relying on manual data entry reduces speed and accuracy, leading to outdated information.
- Lack of Standardization: Inconsistent KPI definitions or display formats across departments can hinder a unified view.
- Data Accuracy and Security: Ensuring the integrity and privacy of sensitive operational data is paramount.
- Skills Gap: The workforce may lack the digital proficiency in data analysis and automation required to fully leverage these tools.
Best Practices
- Define Clear Objectives: Always start with specific goals and questions the dashboard should answer.
- Focus on Actionable Metrics: Include only KPIs that directly support or drive specific actions. Avoid “vanity metrics” that don’t provide actionable insights.
- Keep it Simple and Visual: Design for clarity and ease of understanding. Use clear labels, minimal jargon, and consistent color schemes.
- Involve End-Users: Engage operators and other frontline staff in the design process to ensure the dashboards meet actual operational needs and are intuitive to use.
- Ensure Data Accuracy: Implement robust data validation and integration processes to ensure the reliability of the information displayed.
- Automate Data Collection: Wherever possible, automate data input to ensure real-time updates and reduce human error.
- Standardize Design: Establish design standards for layout, color schemes, and data presentation across all dashboards for consistency.
- Provide Ongoing Training and Support: Equip your teams with the skills to effectively use and interpret the dashboards.
By embracing real-time digital dashboards, industrial manufacturers can transform their operations, moving from reactive problem-solving to proactive optimization. This powerful synergy with Lean Manufacturing and Continuous Improvement principles not only boosts efficiency and reduces waste but also cultivates an agile, data-driven culture essential for sustained success in the modern manufacturing landscape.