
Capture Utilities.
Track CO2.
Map Every KPI.
Go beyond basic energy monitoring. Capture utilities, track CO2, and map real-time production KPIs — so you know exactly where money is being spent and where it can be saved.
Omni Vision combines EnerTherm's precision metering hardware and PLC integration with EPSA Energy's AI-powered analytics platform — delivered as one turnkey package. We meter standard utilities and connect any additional process signal, sensor, or legacy system your site runs. Every data point is mapped to custom KPI dashboards tailored to the metrics that actually drive your costs. CO2 reporting comes built in. From survey to live dashboards in 8-16 weeks with one contract.
Why Basic Monitoring
Falls Short
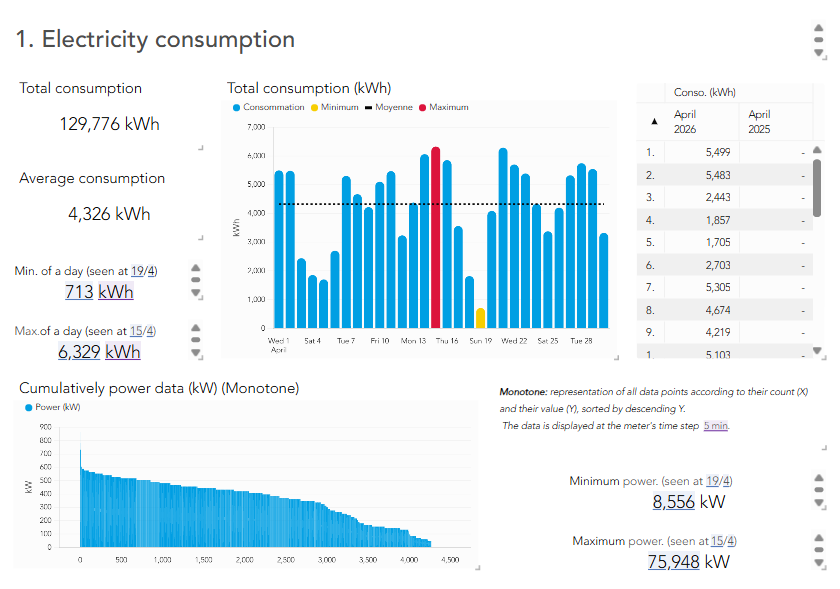
Tracking electricity alone gives you a fraction of the picture — and hides the majority of your utility costs.
Partial Coverage, Blind Spots
Most monitoring only tracks electricity. Gas, water, steam, compressed air, thermal energy, and process-specific signals go unmeasured — leaving the majority of your operational data invisible.
Generic Dashboards, Wrong KPIs
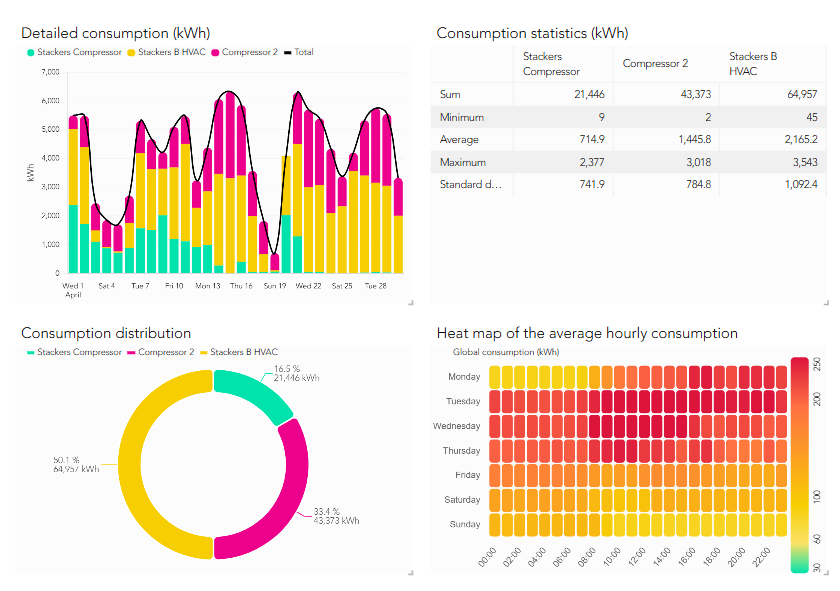
Off-the-shelf platforms show you their metrics, not yours — and rarely in real time. Without live dashboards tailored to your specific production KPIs, you cannot identify where money is actually being wasted right now.
Fragmented Tools, No Single Truth
Spreadsheets, BMS screens, manual meter reads, and siloed software give you fragments. You need one platform that correlates every utility stream and every production KPI in real time.
Emissions Left to Guesswork
Without metering across all fuel types you cannot calculate real Scope I and II emissions. Compliance reporting stays manual and unreliable.
Omni Vision:
One Platform. Total Visibility.
Meter any utility, connect any data source, and build custom KPI dashboards tailored to the metrics your operation cares about.
Any data source connected. Custom KPIs on your dashboard. One platform, one contract.
Other providers give you software for the data you already have. Omni Vision installs the metering hardware you are missing, connects to your existing PLCs, sensors, and any other data source on site, and layers EPSA Energy's AI analytics platform on top — with dashboards custom-built around the KPIs that actually drive your decisions.
Turnkey hardware and AI analytics. 8-16 weeks from survey to live cost and production intelligence. Typical payback under 12 months.
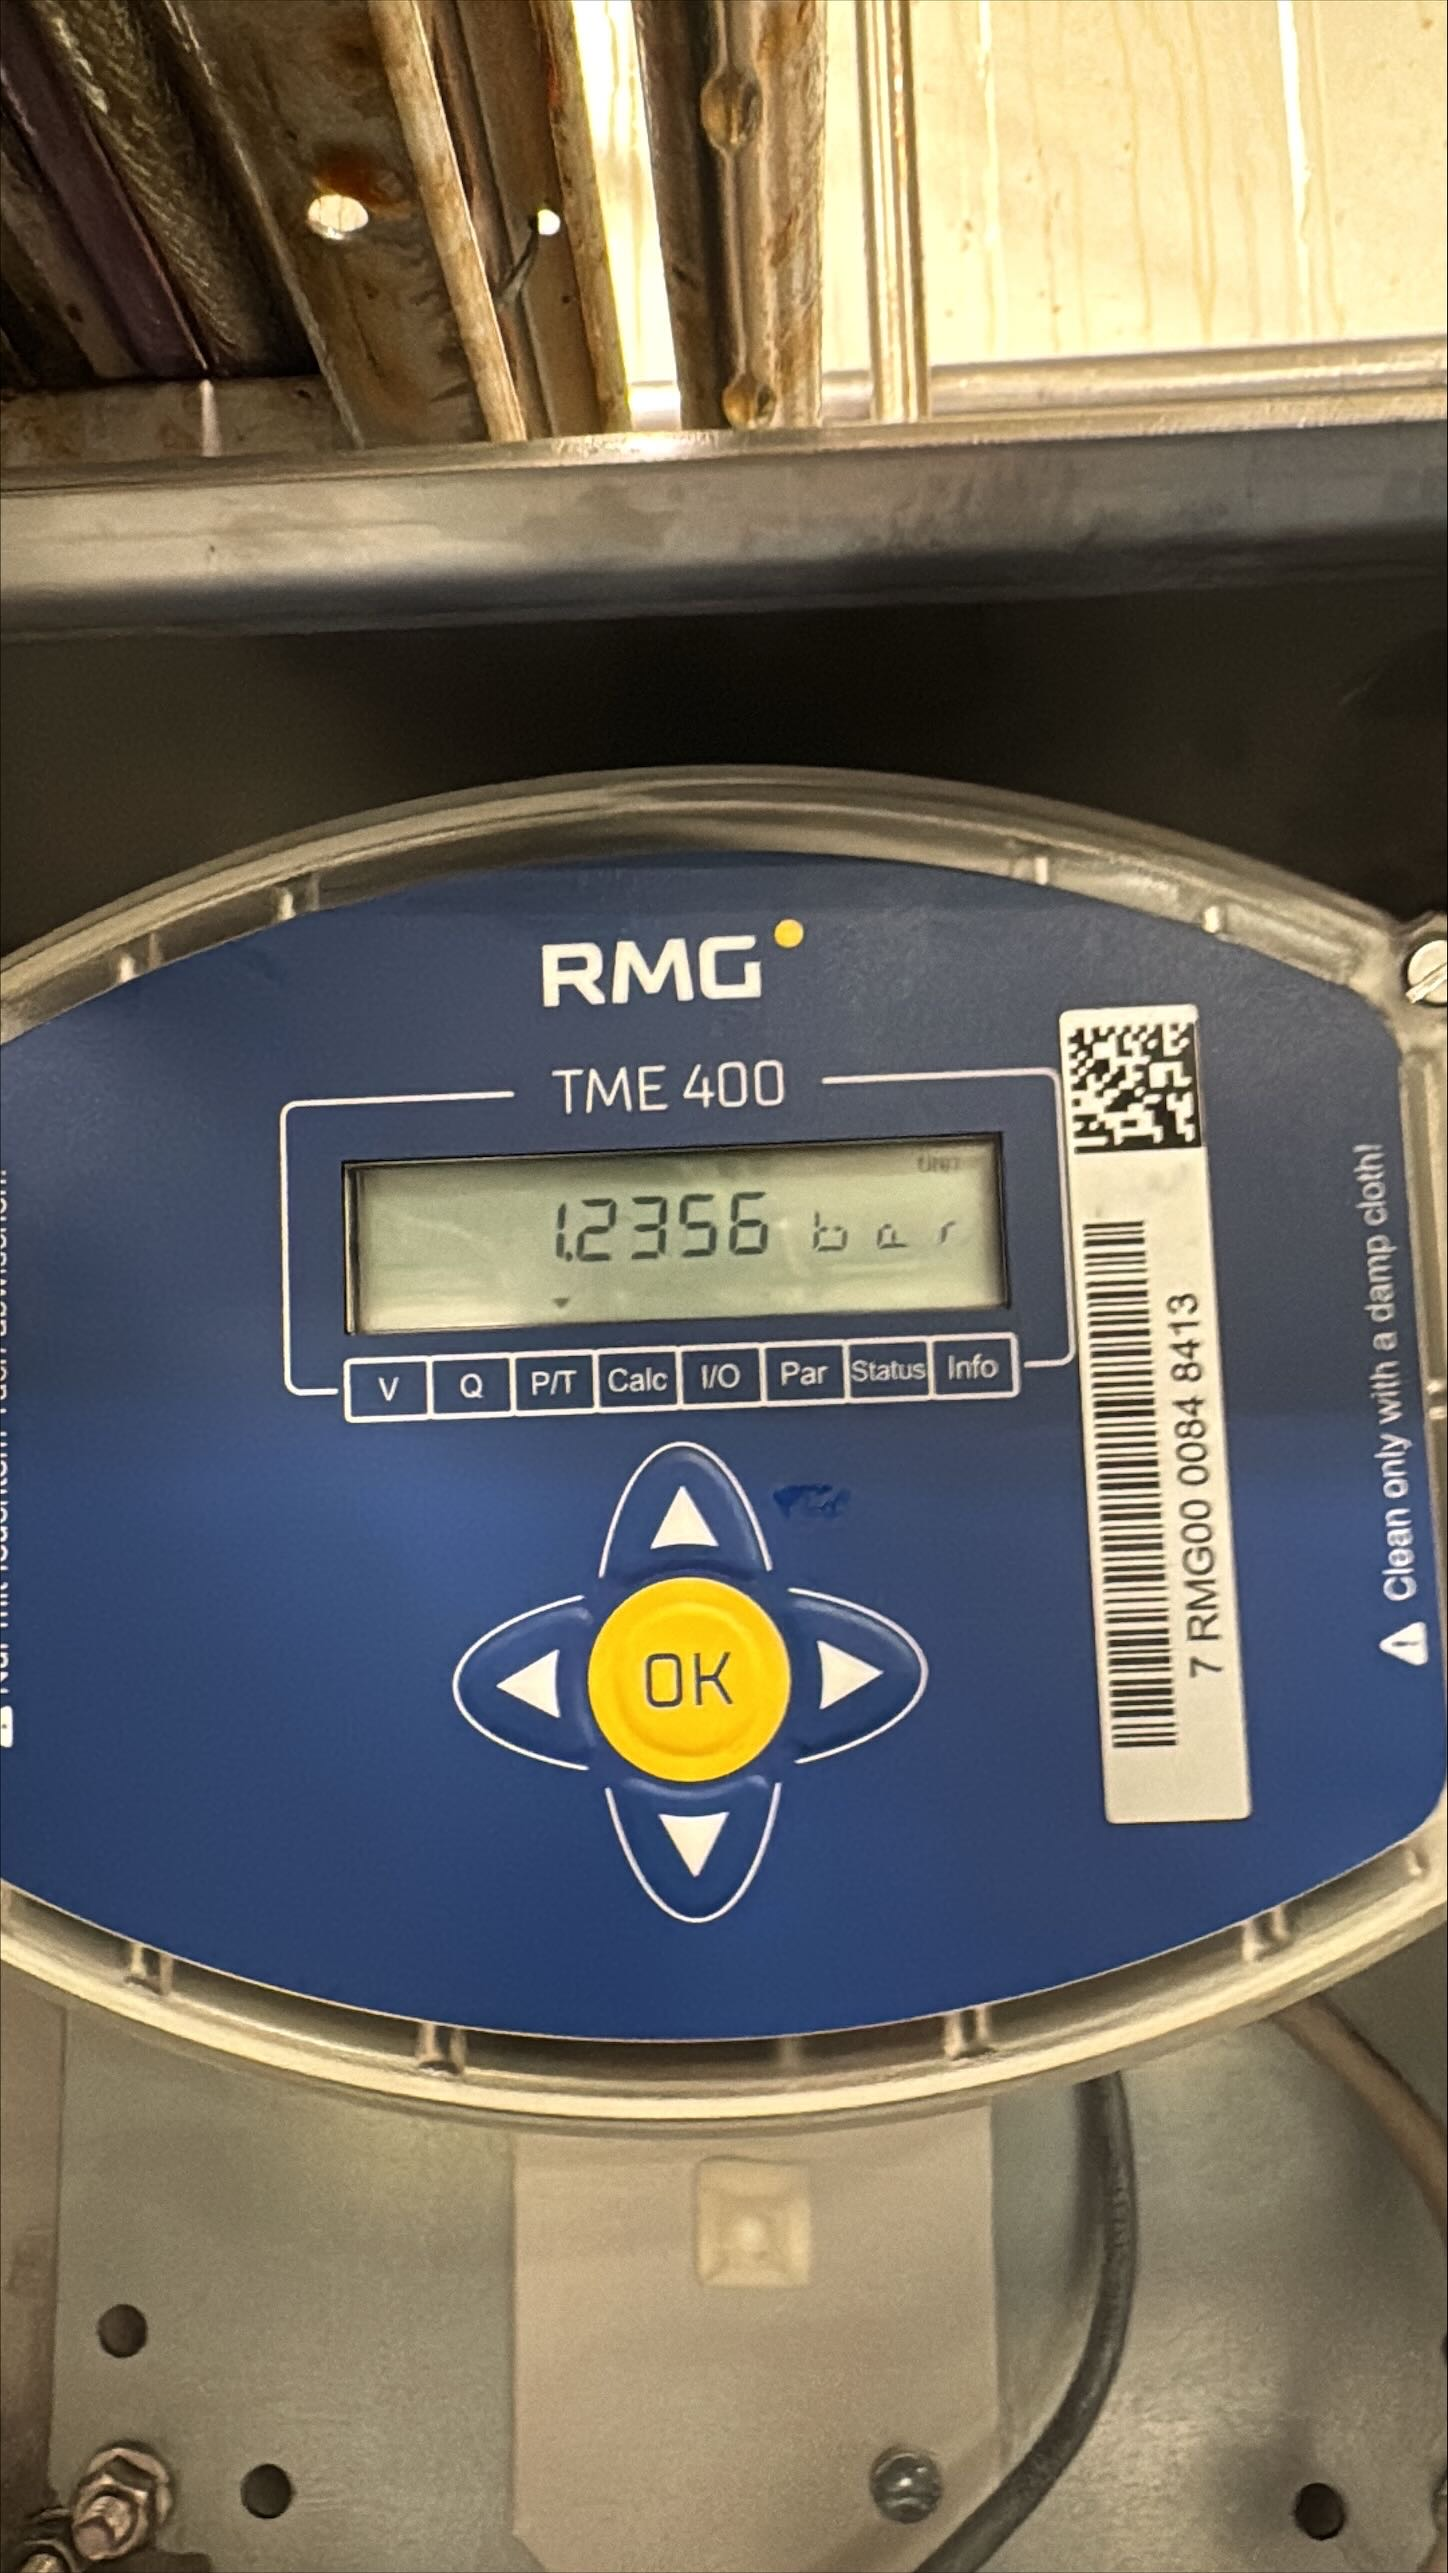
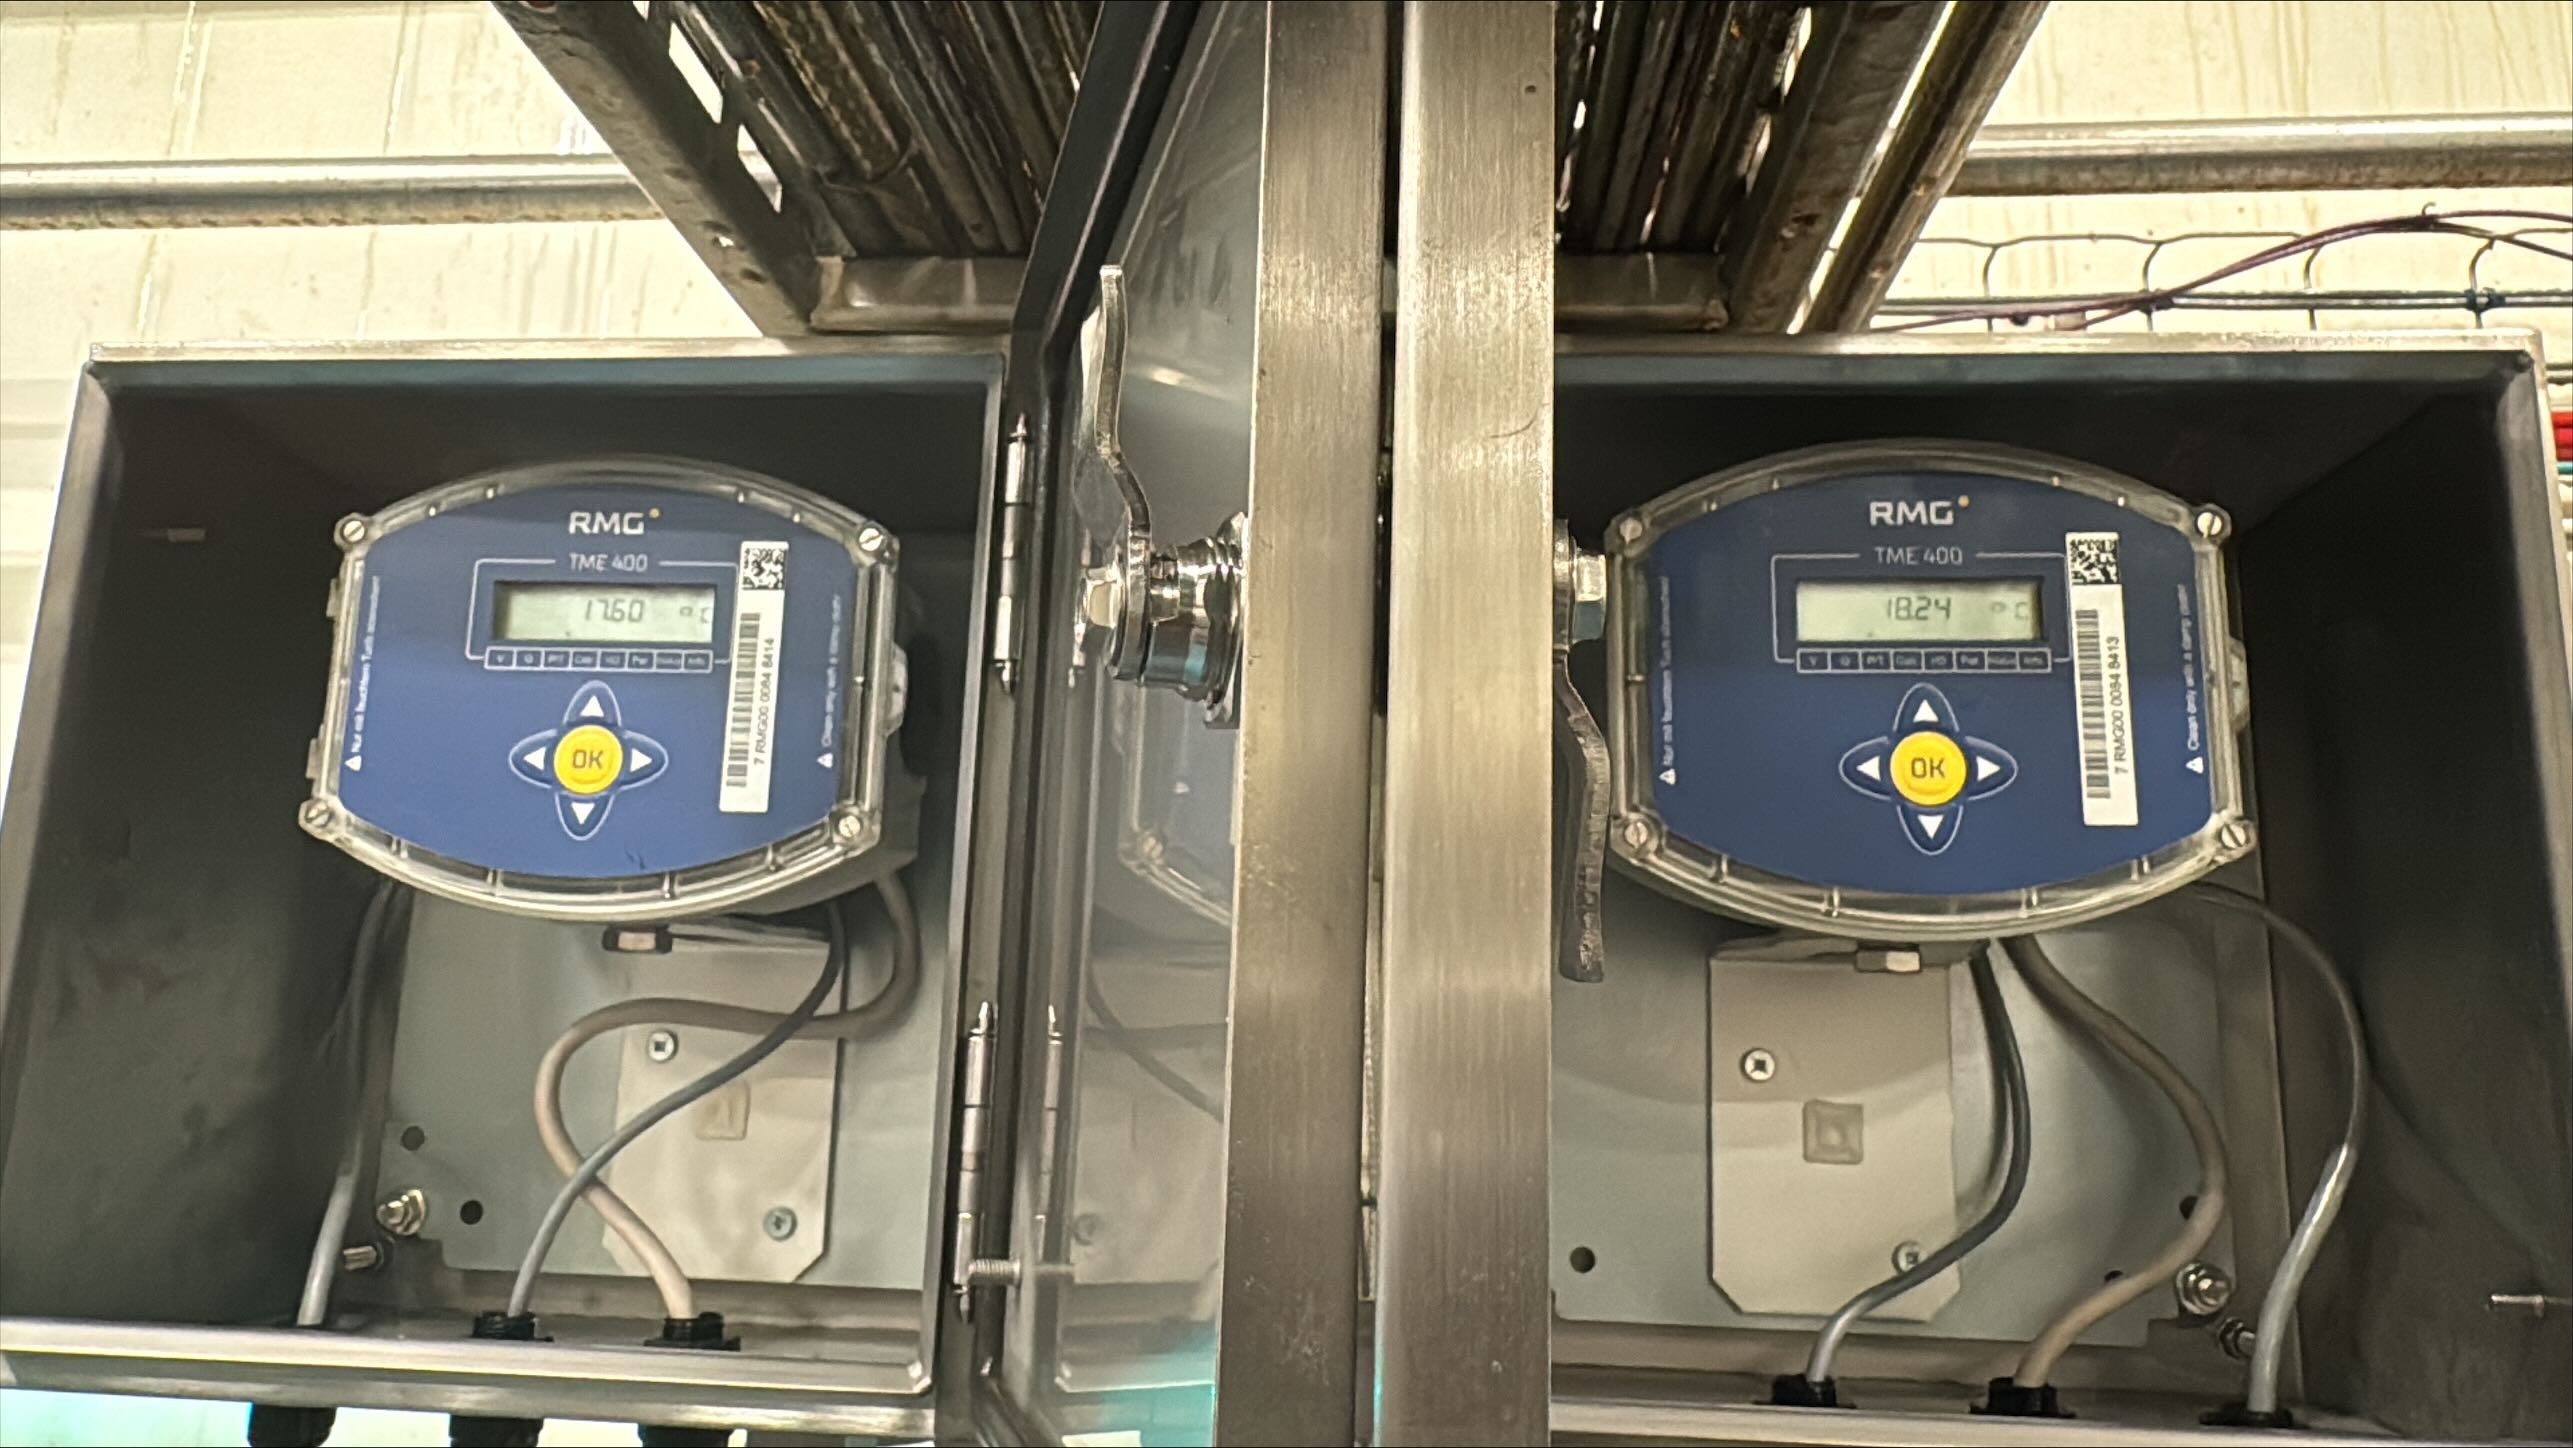
Full Utility Metering
Gas, electricity, water, steam, compressed air, oil — every utility stream specified, sized, and installed on your site. No gaps, no guesswork.
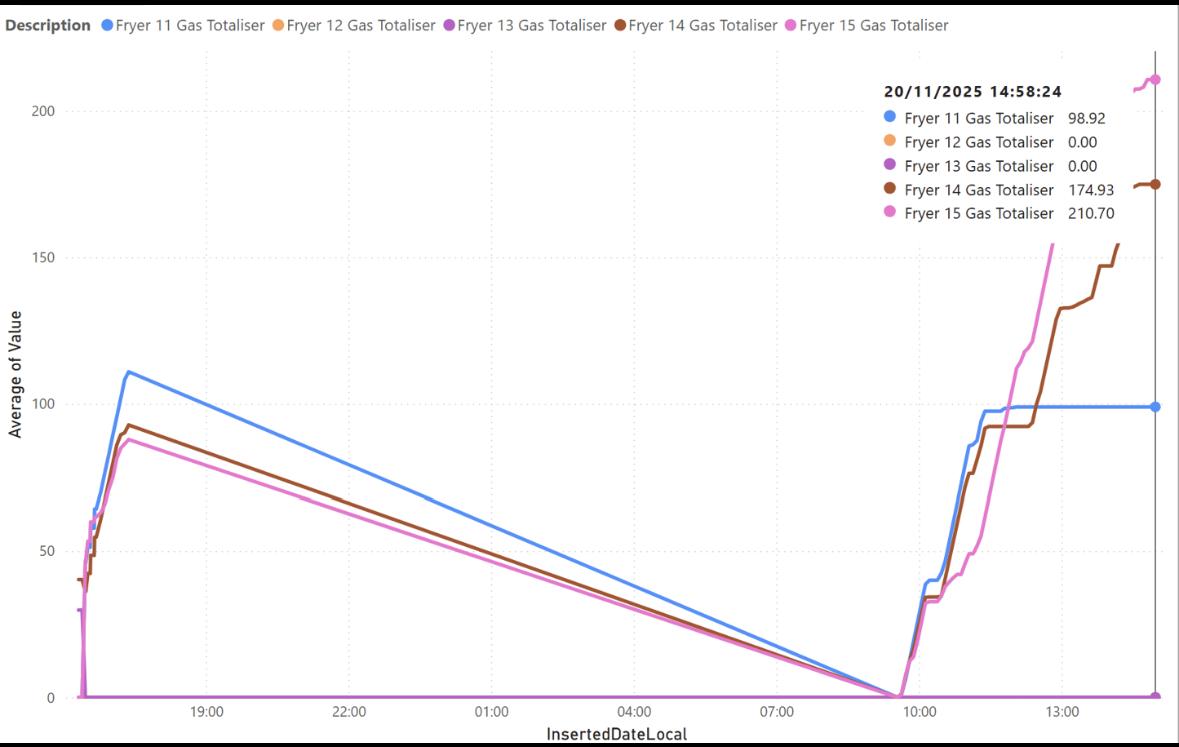
Production KPI Engine
Map utility costs to product lines, shifts, and batch runs. Energy per unit, cost per tonne, intensity per shift — industry-specific KPIs that drive real decisions.
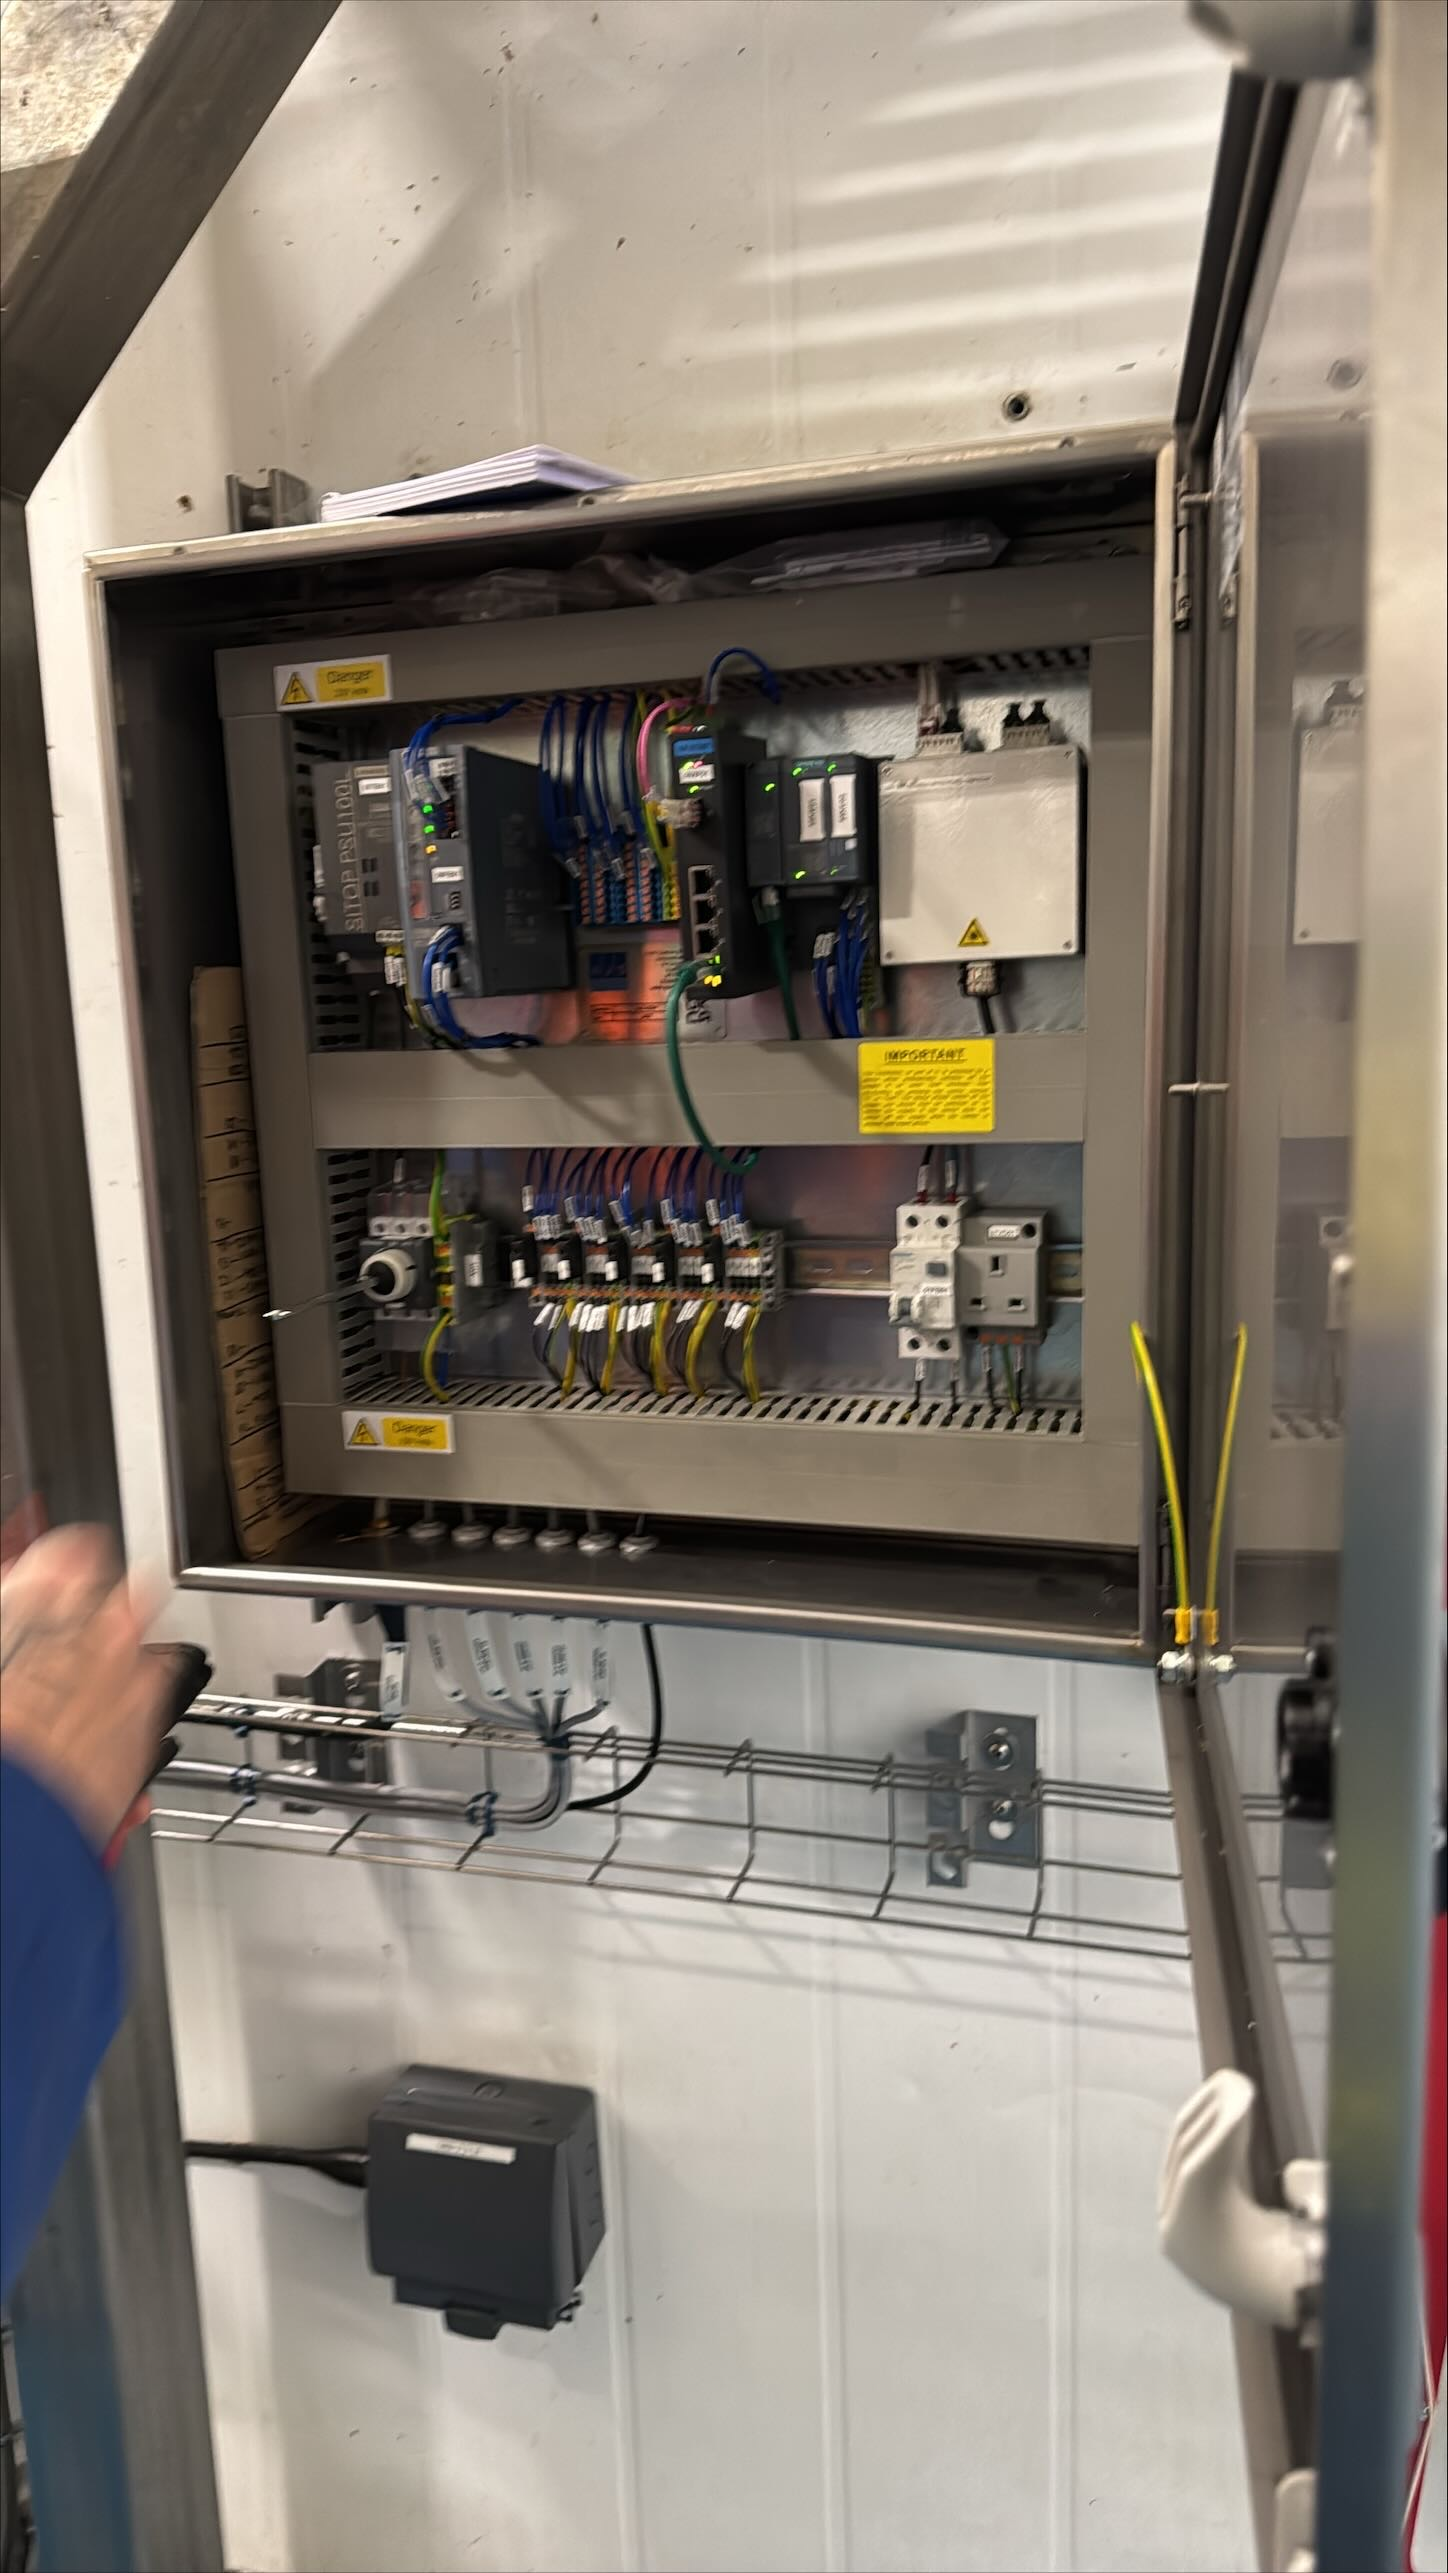
PLC & Production Data
Existing process data extracted from PLCs and legacy systems, merged with new metering. Production output linked to utility consumption for true KPI mapping.
AI-Driven Intelligence
EPSA Energy's AI models detect anomalies, forecast consumption, and surface savings opportunities across every utility. The platform learns your facility and improves over time.
Secure Cloud Architecture
One-way data push from your plant to EPSA Energy's secure cloud. Read-only access, encrypted connections, and complete data ownership retained by you.
CO2 & Emissions Tracking
Scope I and II emissions calculated automatically from metered fuel and electricity data. Live dashboards for compliance reporting and reduction targets.
Results That
Speak for Themselves
Proven results from EPSA Energy's deployed platform — real savings from real factories.
SKF
Bearings Manufacturing
energy reduction Year 3
World leader in bearings. Rolled out across European sites with yearly targets of -5%. Achieved 12% in Year 1, 18% by Year 3.
Groupe Beneteau
Yacht & Boat Building
CO2 emissions reduced
Deployed across 21 plants in France, Italy, Portugal, and USA. Corporate-driven programme achieving 25% electricity and 22% gas reduction in first year.
Solvay
Chemical Manufacturing
ROI payback period
Performance variability analysis with 750 conditional alerts. Identified 1% further gain on an 80M euro process through AI-driven behavioural anomaly detection.
Customers
Countries
Years Track Record
First Savings
Delivered by Two Industry Specialists
EnerTherm Engineering
UK and Ireland implementation partner. Handles all physical infrastructure - site survey, instrumentation, panel build, M&E installation, PLC integration, and commissioning.
EPSA Energy
AI-powered SaaS energy management platform. Proven in 150+ customers across 25 countries. Delivers real-time analytics, anomaly detection, forecasting, and ISO 50001 tracking.
From Survey to
Total Intelligence
Seven steps from initial survey to live utility and production KPI dashboards — delivered turnkey in 8-16 weeks.
Site Survey
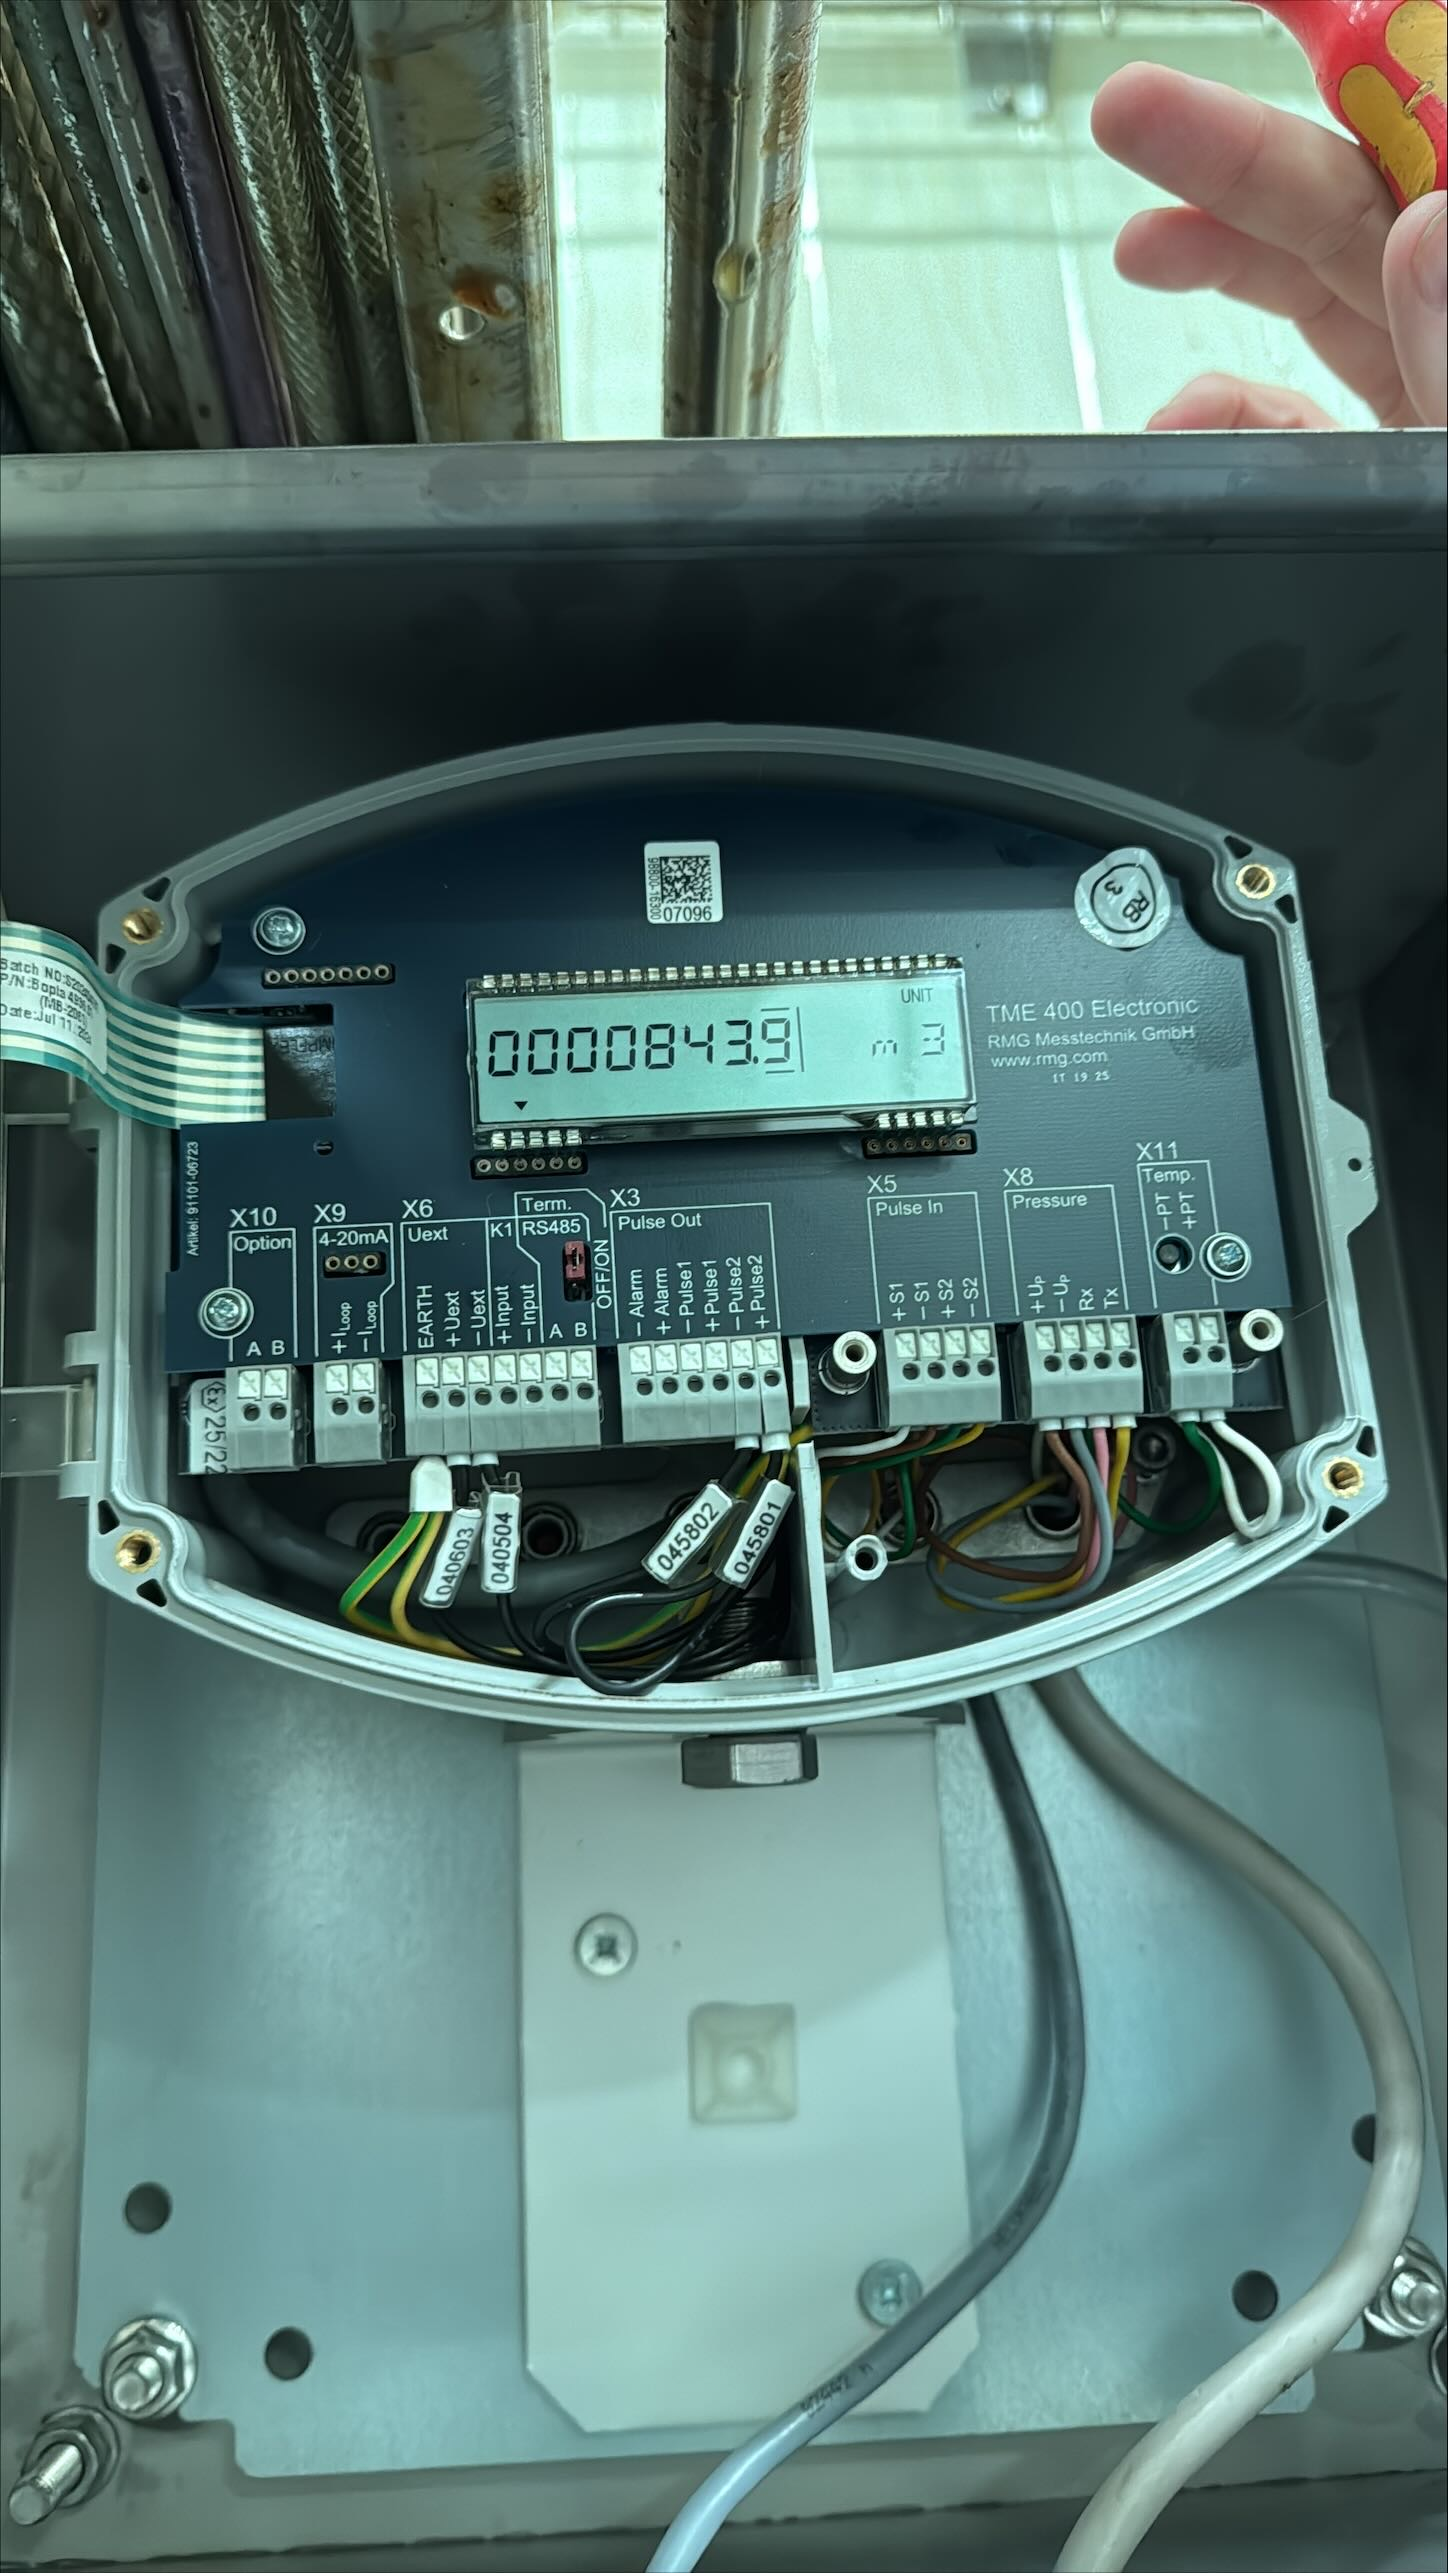
Expert engineers visit your site to map existing infrastructure - PLCs, meters, piping, electrical systems, and data networks. Every metering point is identified, pipe sizes assessed, and flow conditions documented for accurate instrumentation specification.

Instrumentation Sizing
Based on your survey data, every instrument is calculated and specified - gas meters, water meters, oil flow meters, electrical CTs, and pressure transmitters. Each meter is sized to match your actual process conditions: pipe diameter, flow range, pressure, temperature, and media type.
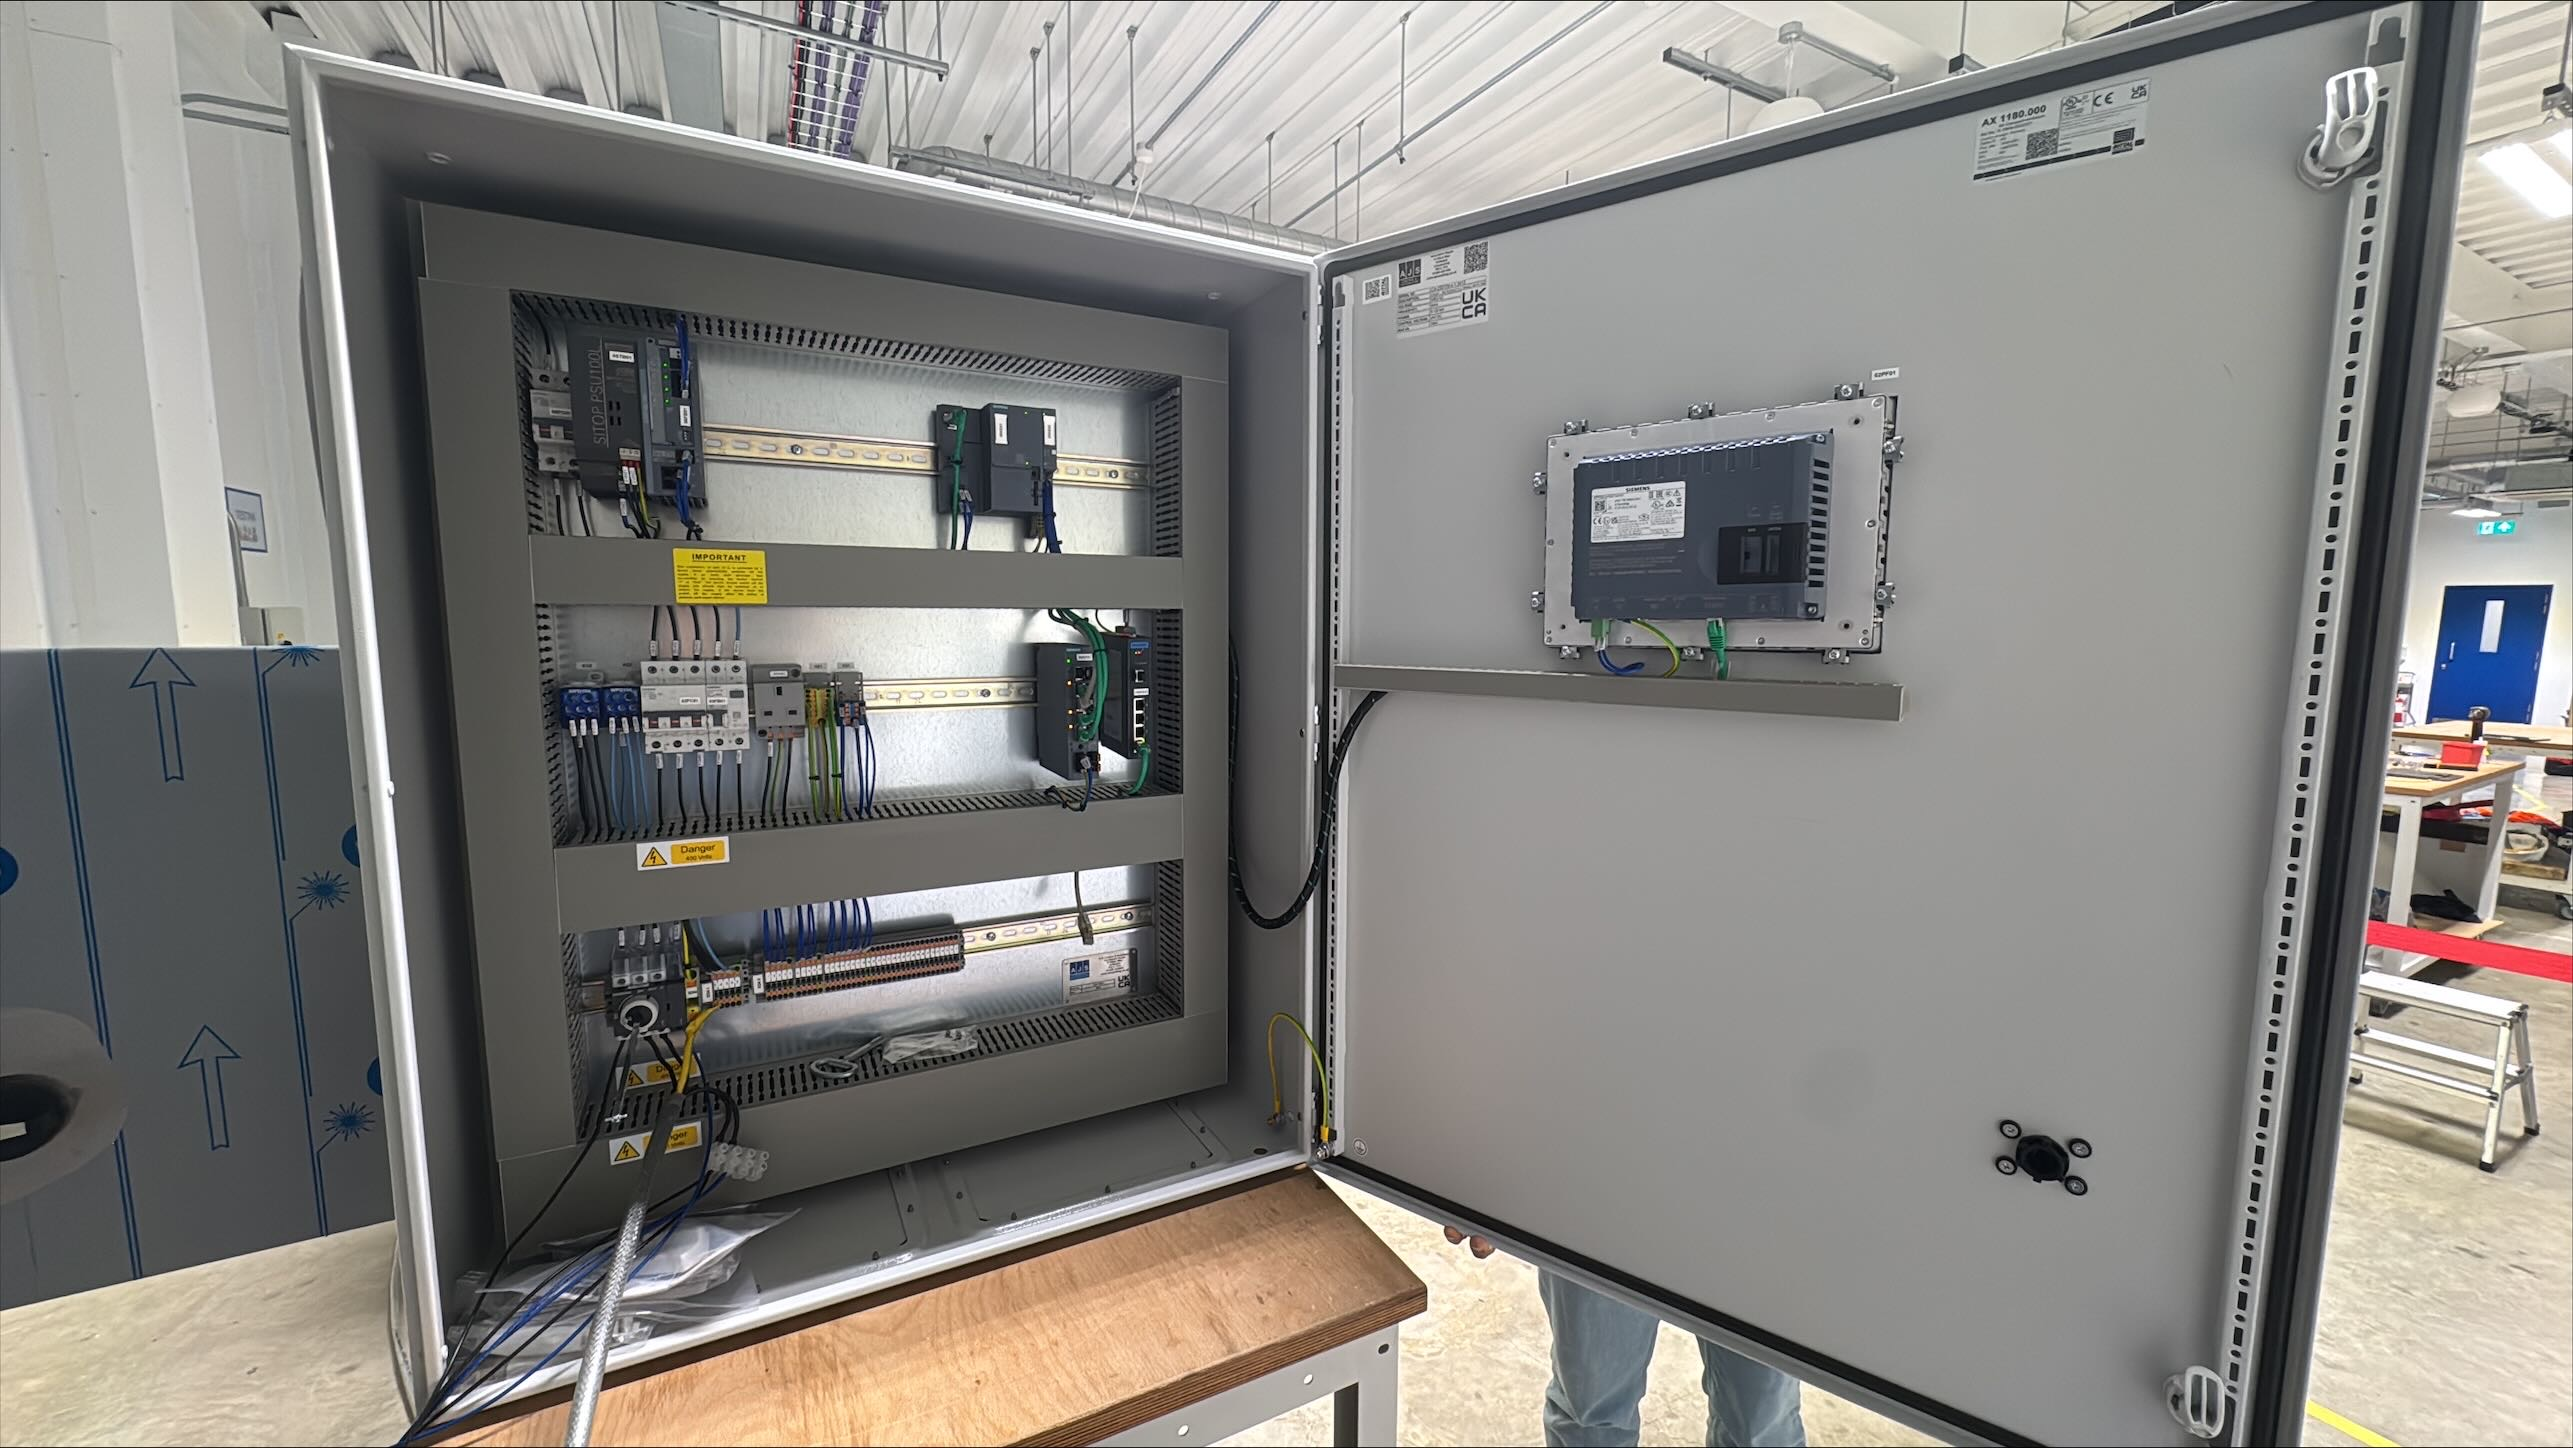
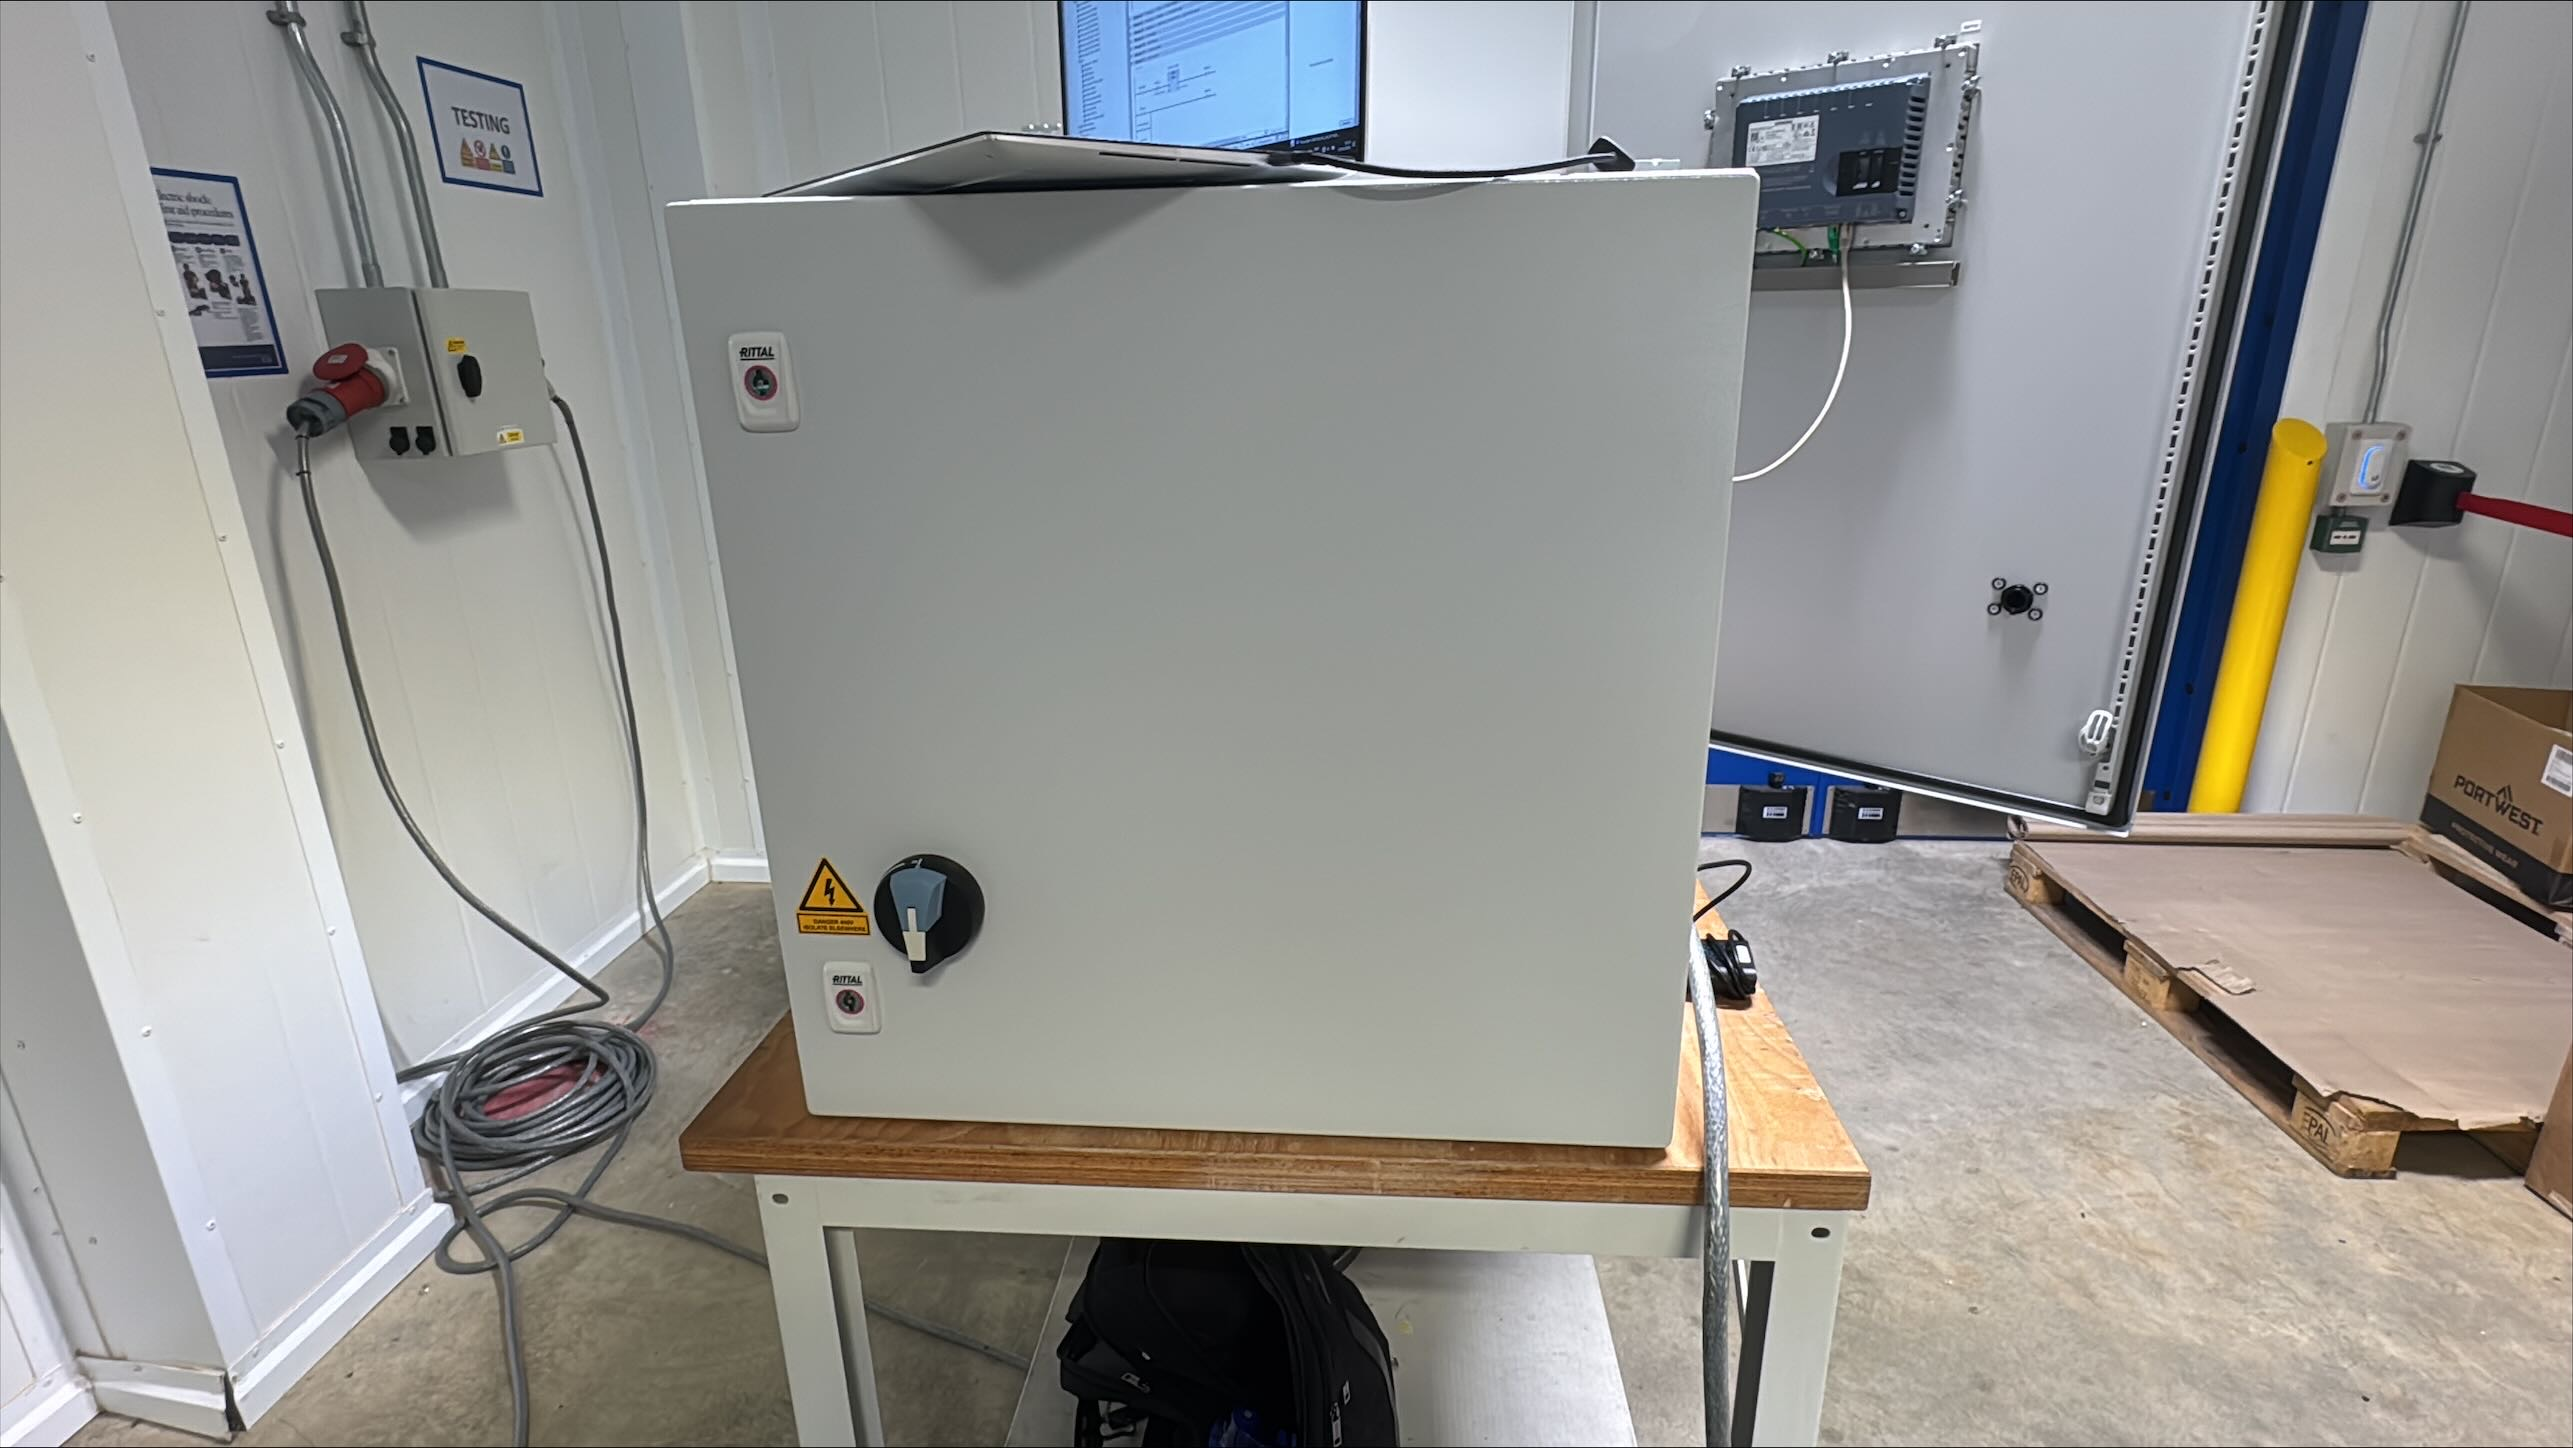
Factory Acceptance Testing
Your control panels are built and fully tested in a controlled environment before arriving on site. PLC programming, HMI displays, communication protocols, and wiring integrity are all verified. Nothing ships until it passes acceptance criteria.
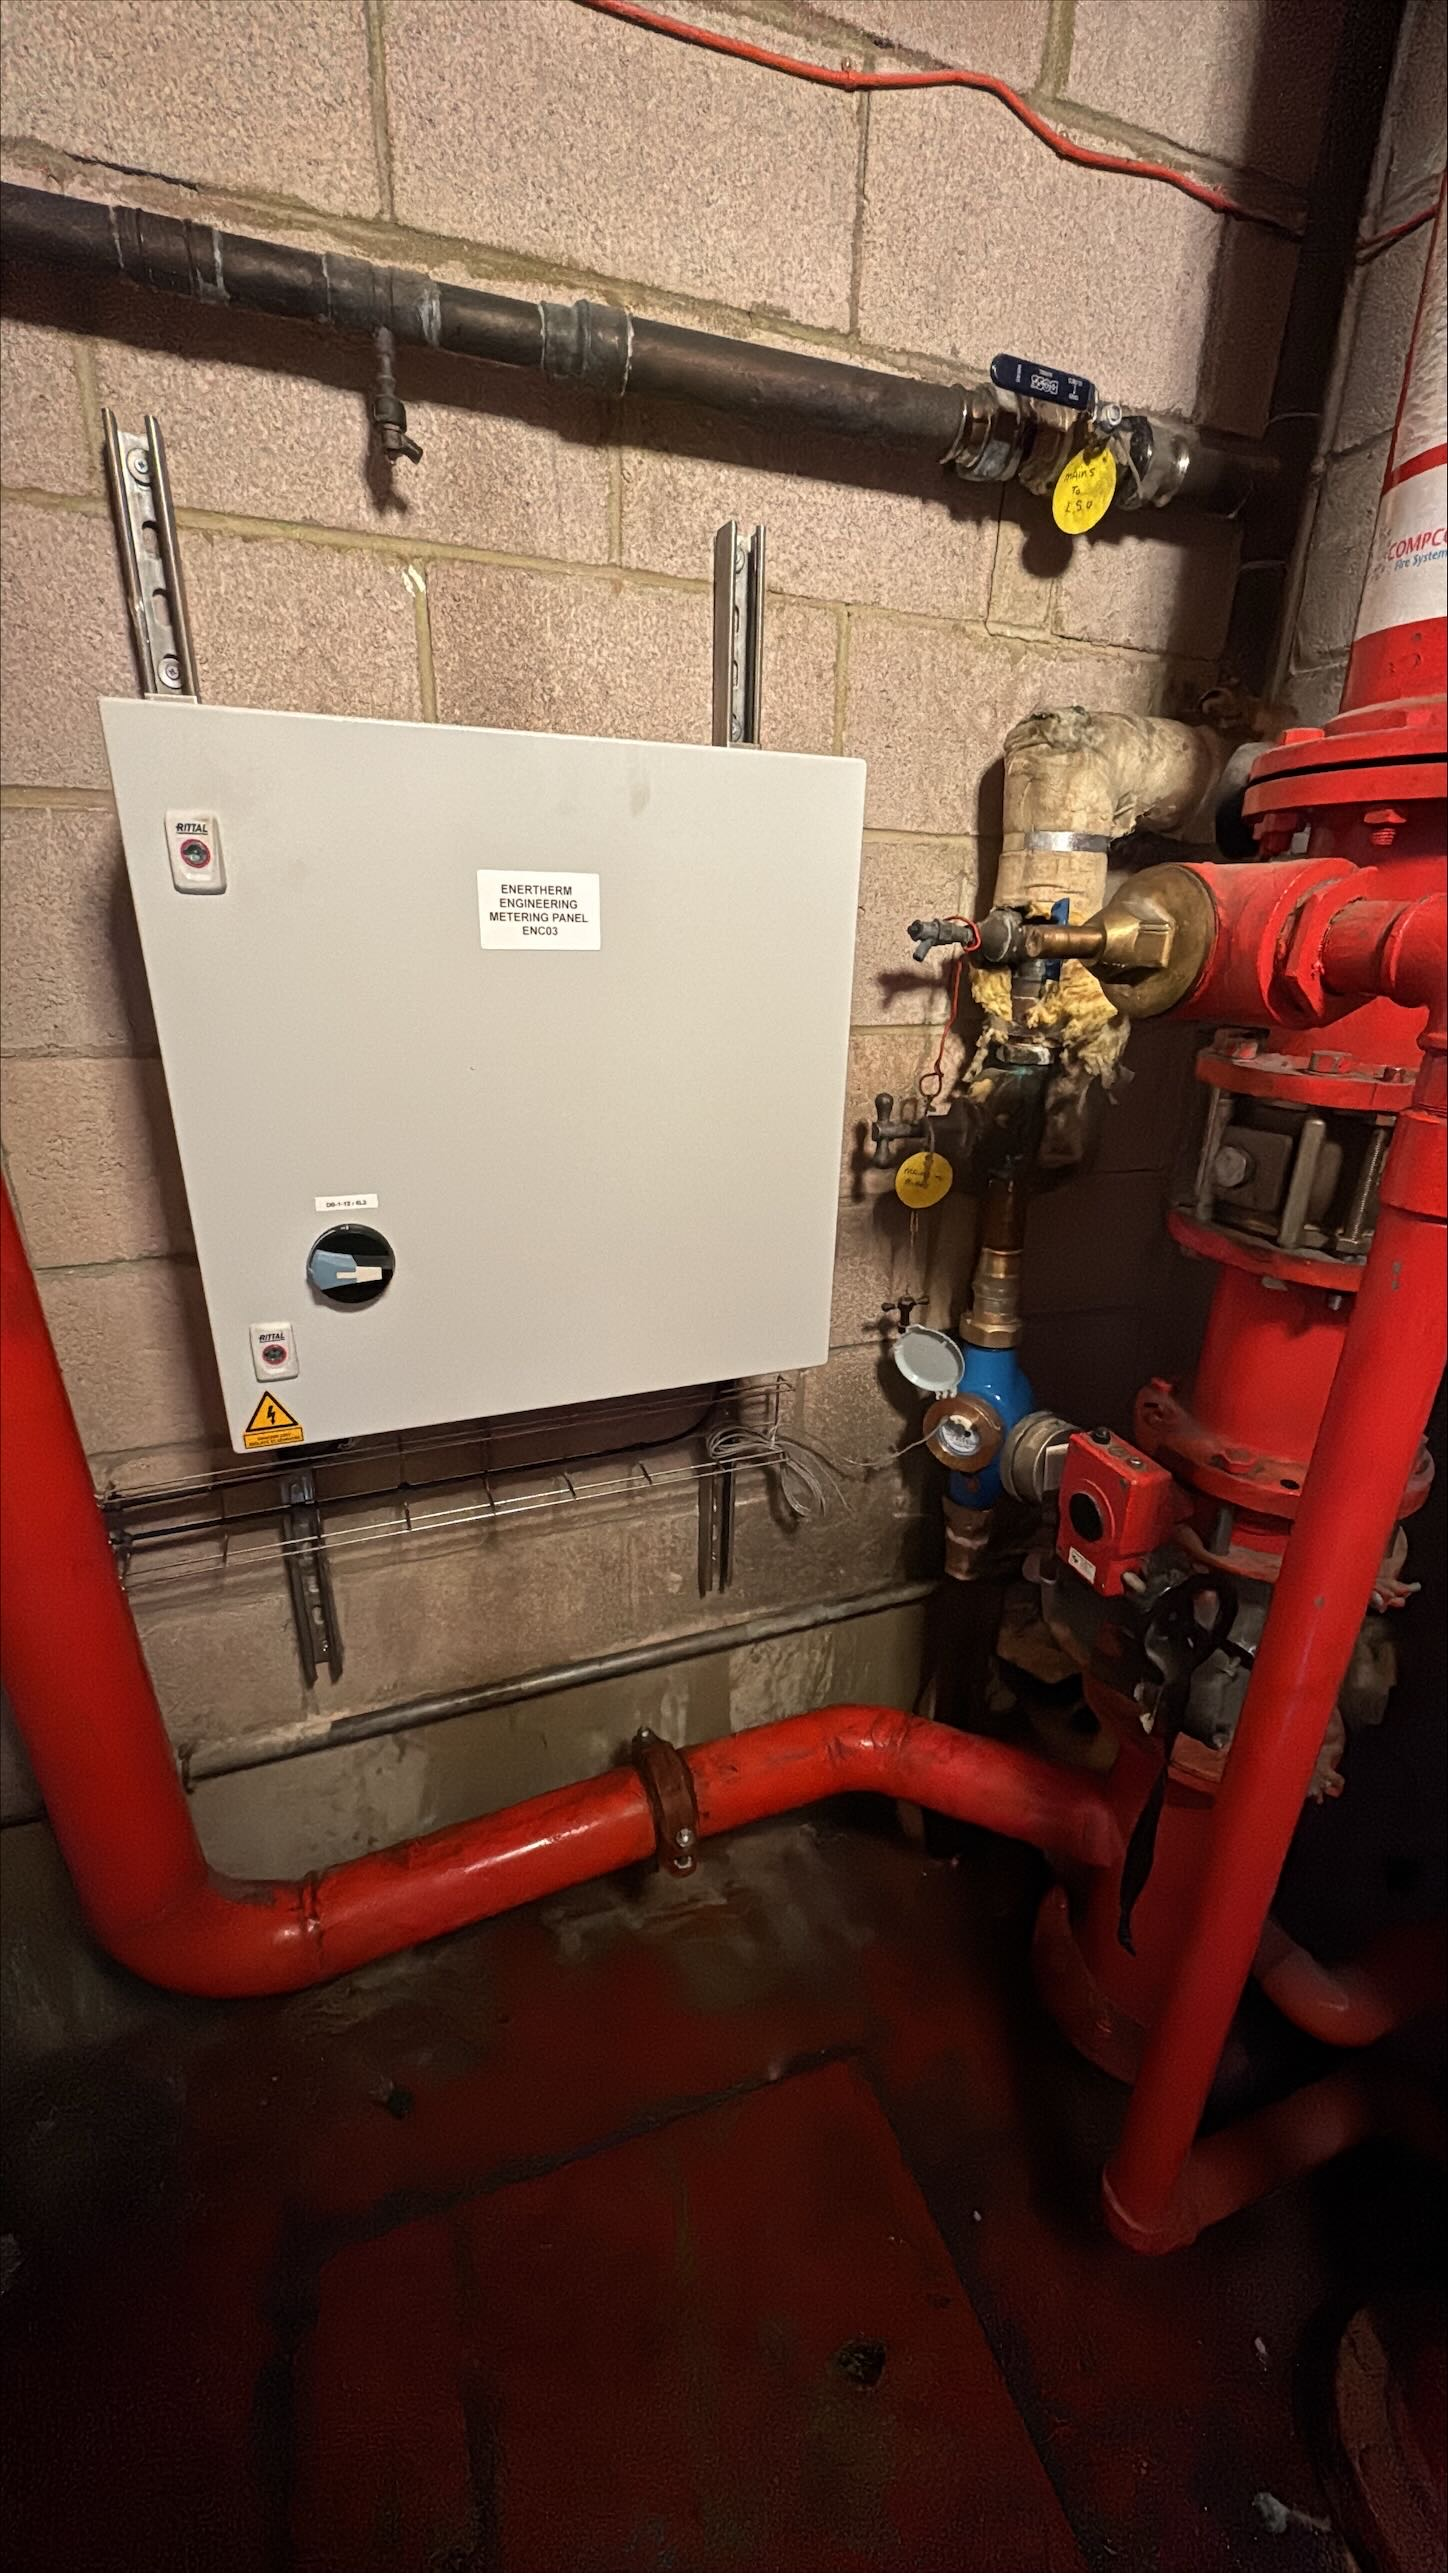
M&E Installation
All metering instrumentation, control panels, and electrical infrastructure are installed on your site. Gas meter installation includes full pressure testing and Gas Safe certification. Water meters, oil flow meters, and electrical monitoring are integrated with minimal disruption to your operations.
Data Connectivity
PLC-to-cloud data pipelines are configured - mapping every meter tag, verifying data transmission to the database, and validating trend accuracy. Industrial protocols (Modbus, OPC-UA, BACnet) are bridged to secure cloud infrastructure so your data flows automatically.
Commissioning
With all hardware installed and data flowing, engineers commission the complete system on your site. Every meter reading is cross-checked against physical measurements, control panel communications are validated, and the full data chain from sensor to cloud is verified end-to-end.
Dashboard & Reporting
EPSA Energy's AI platform transforms your raw data into real-time actionable intelligence. Custom KPI dashboards — built around the metrics that matter to your operation, updated live — replace generic templates. AI models detect anomalies, forecast consumption, and identify savings opportunities automatically across every connected data source.
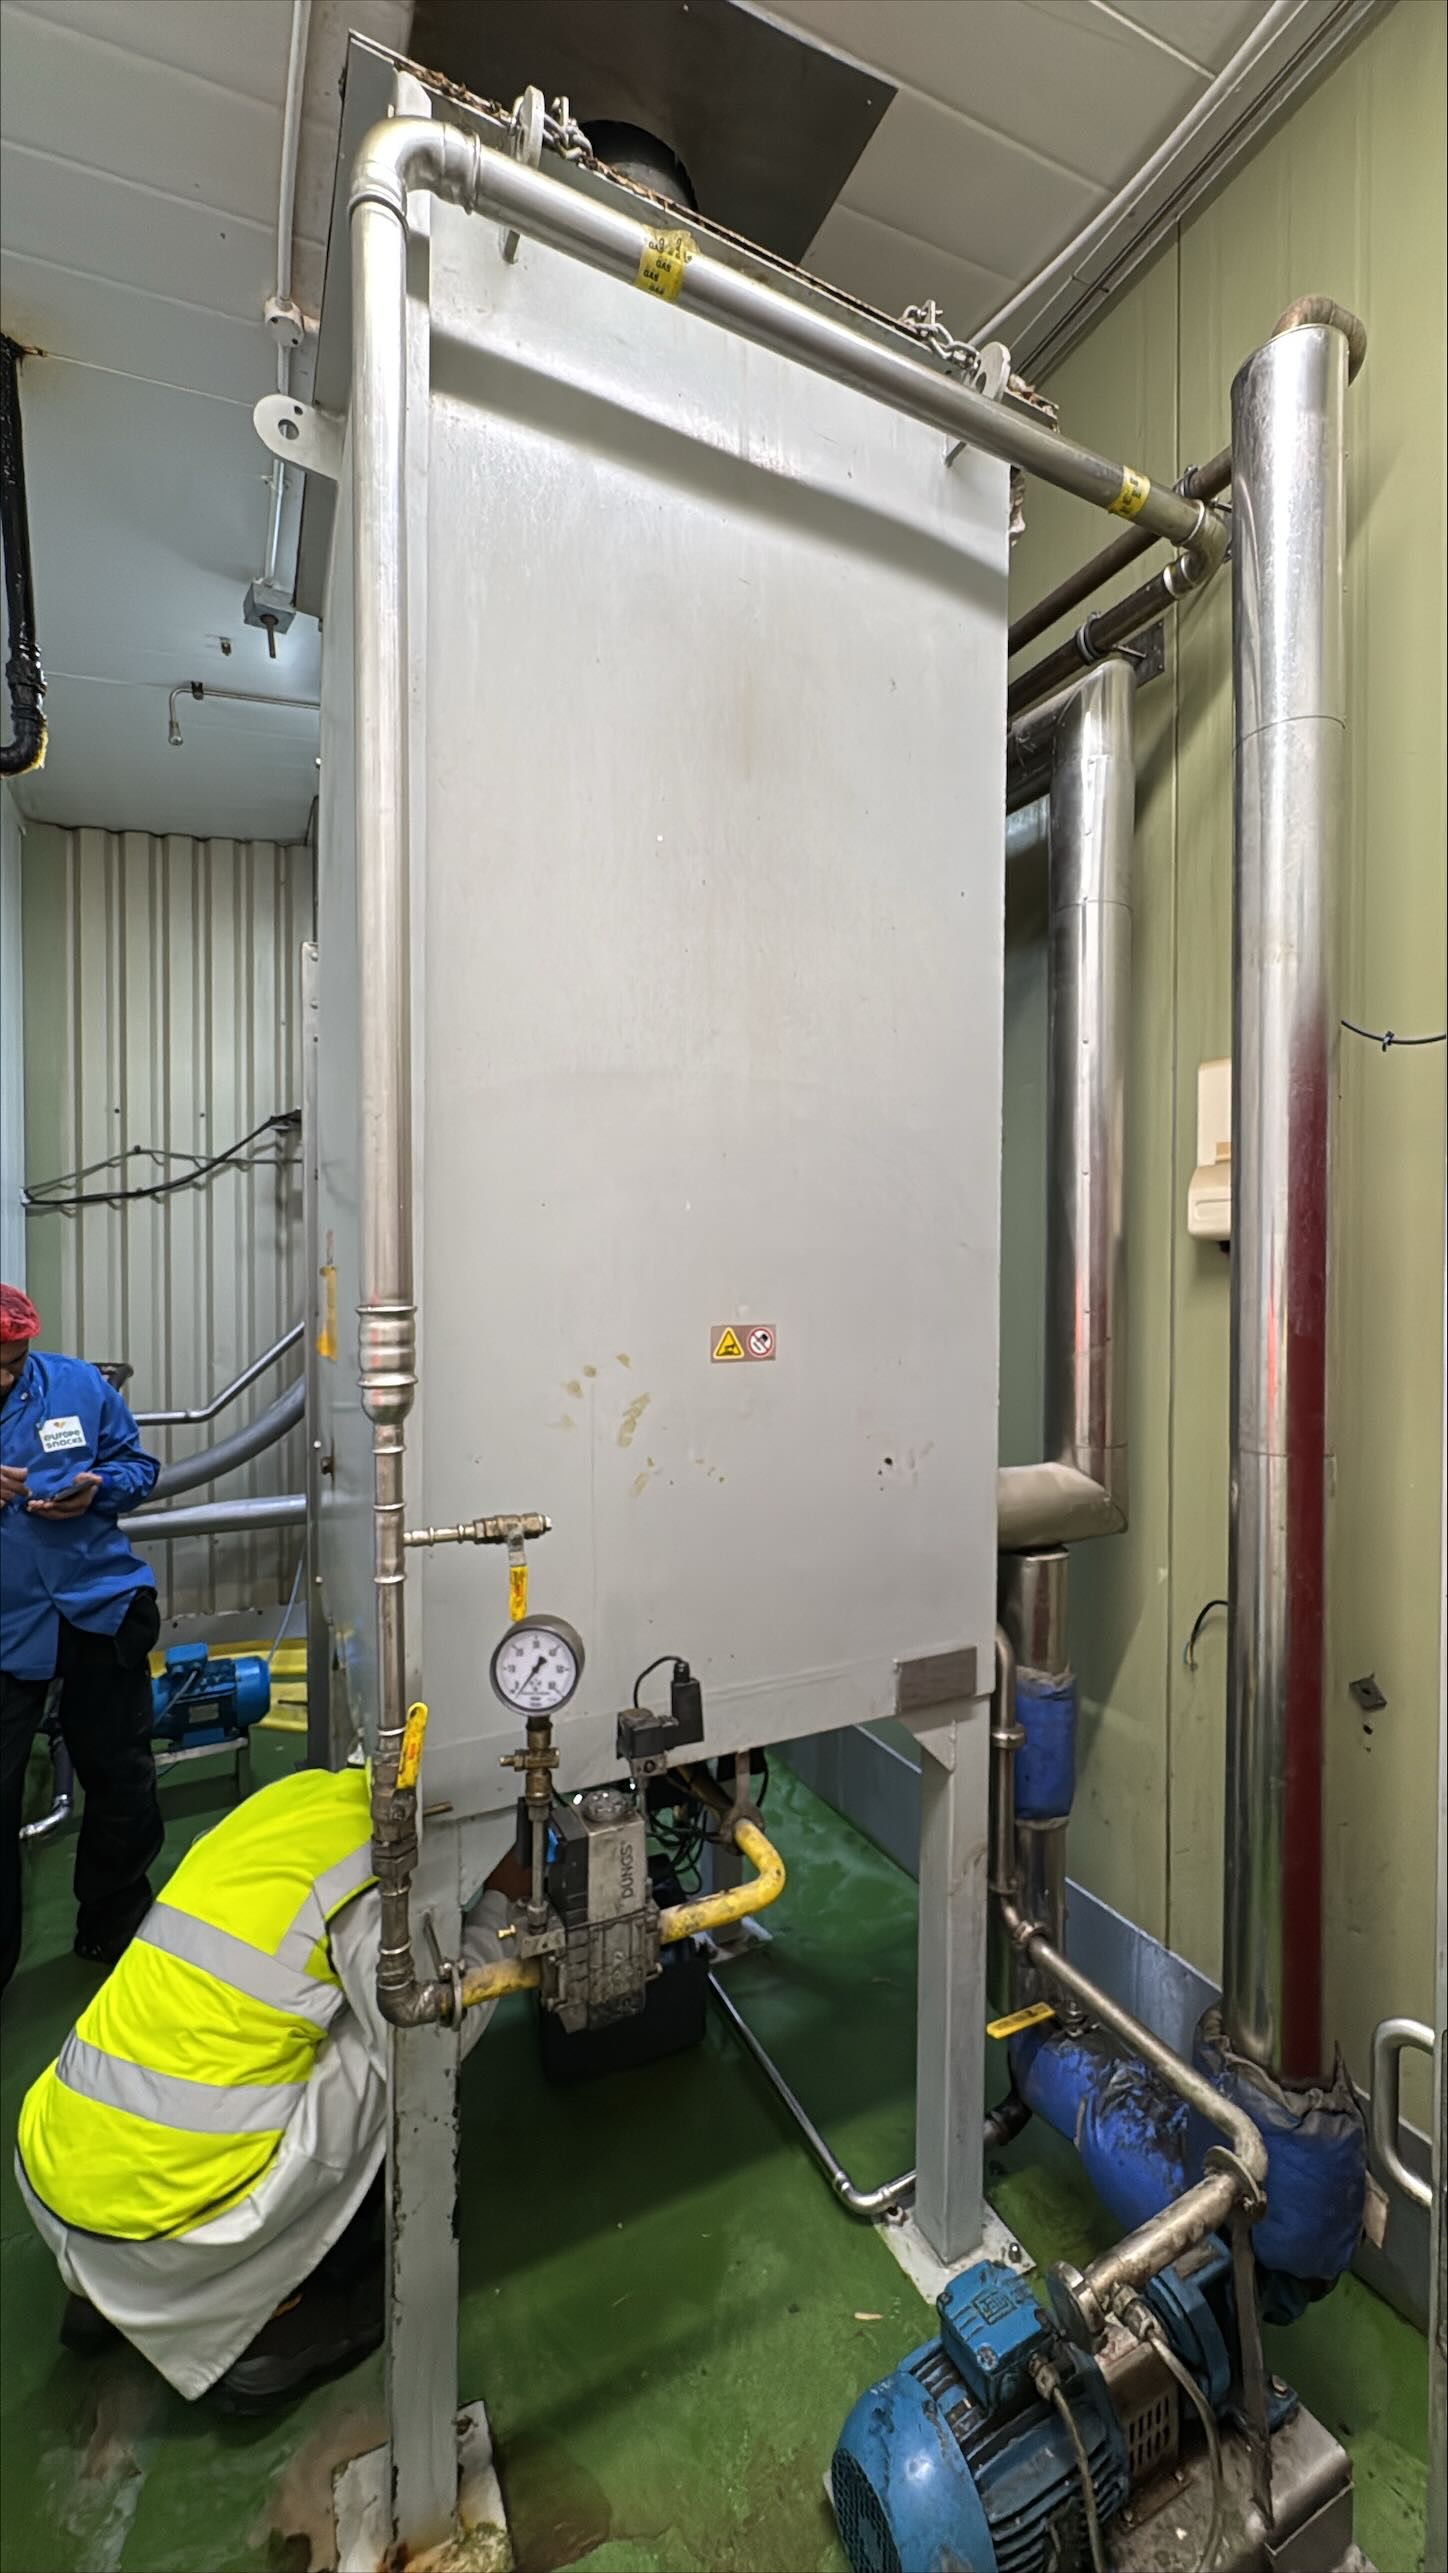
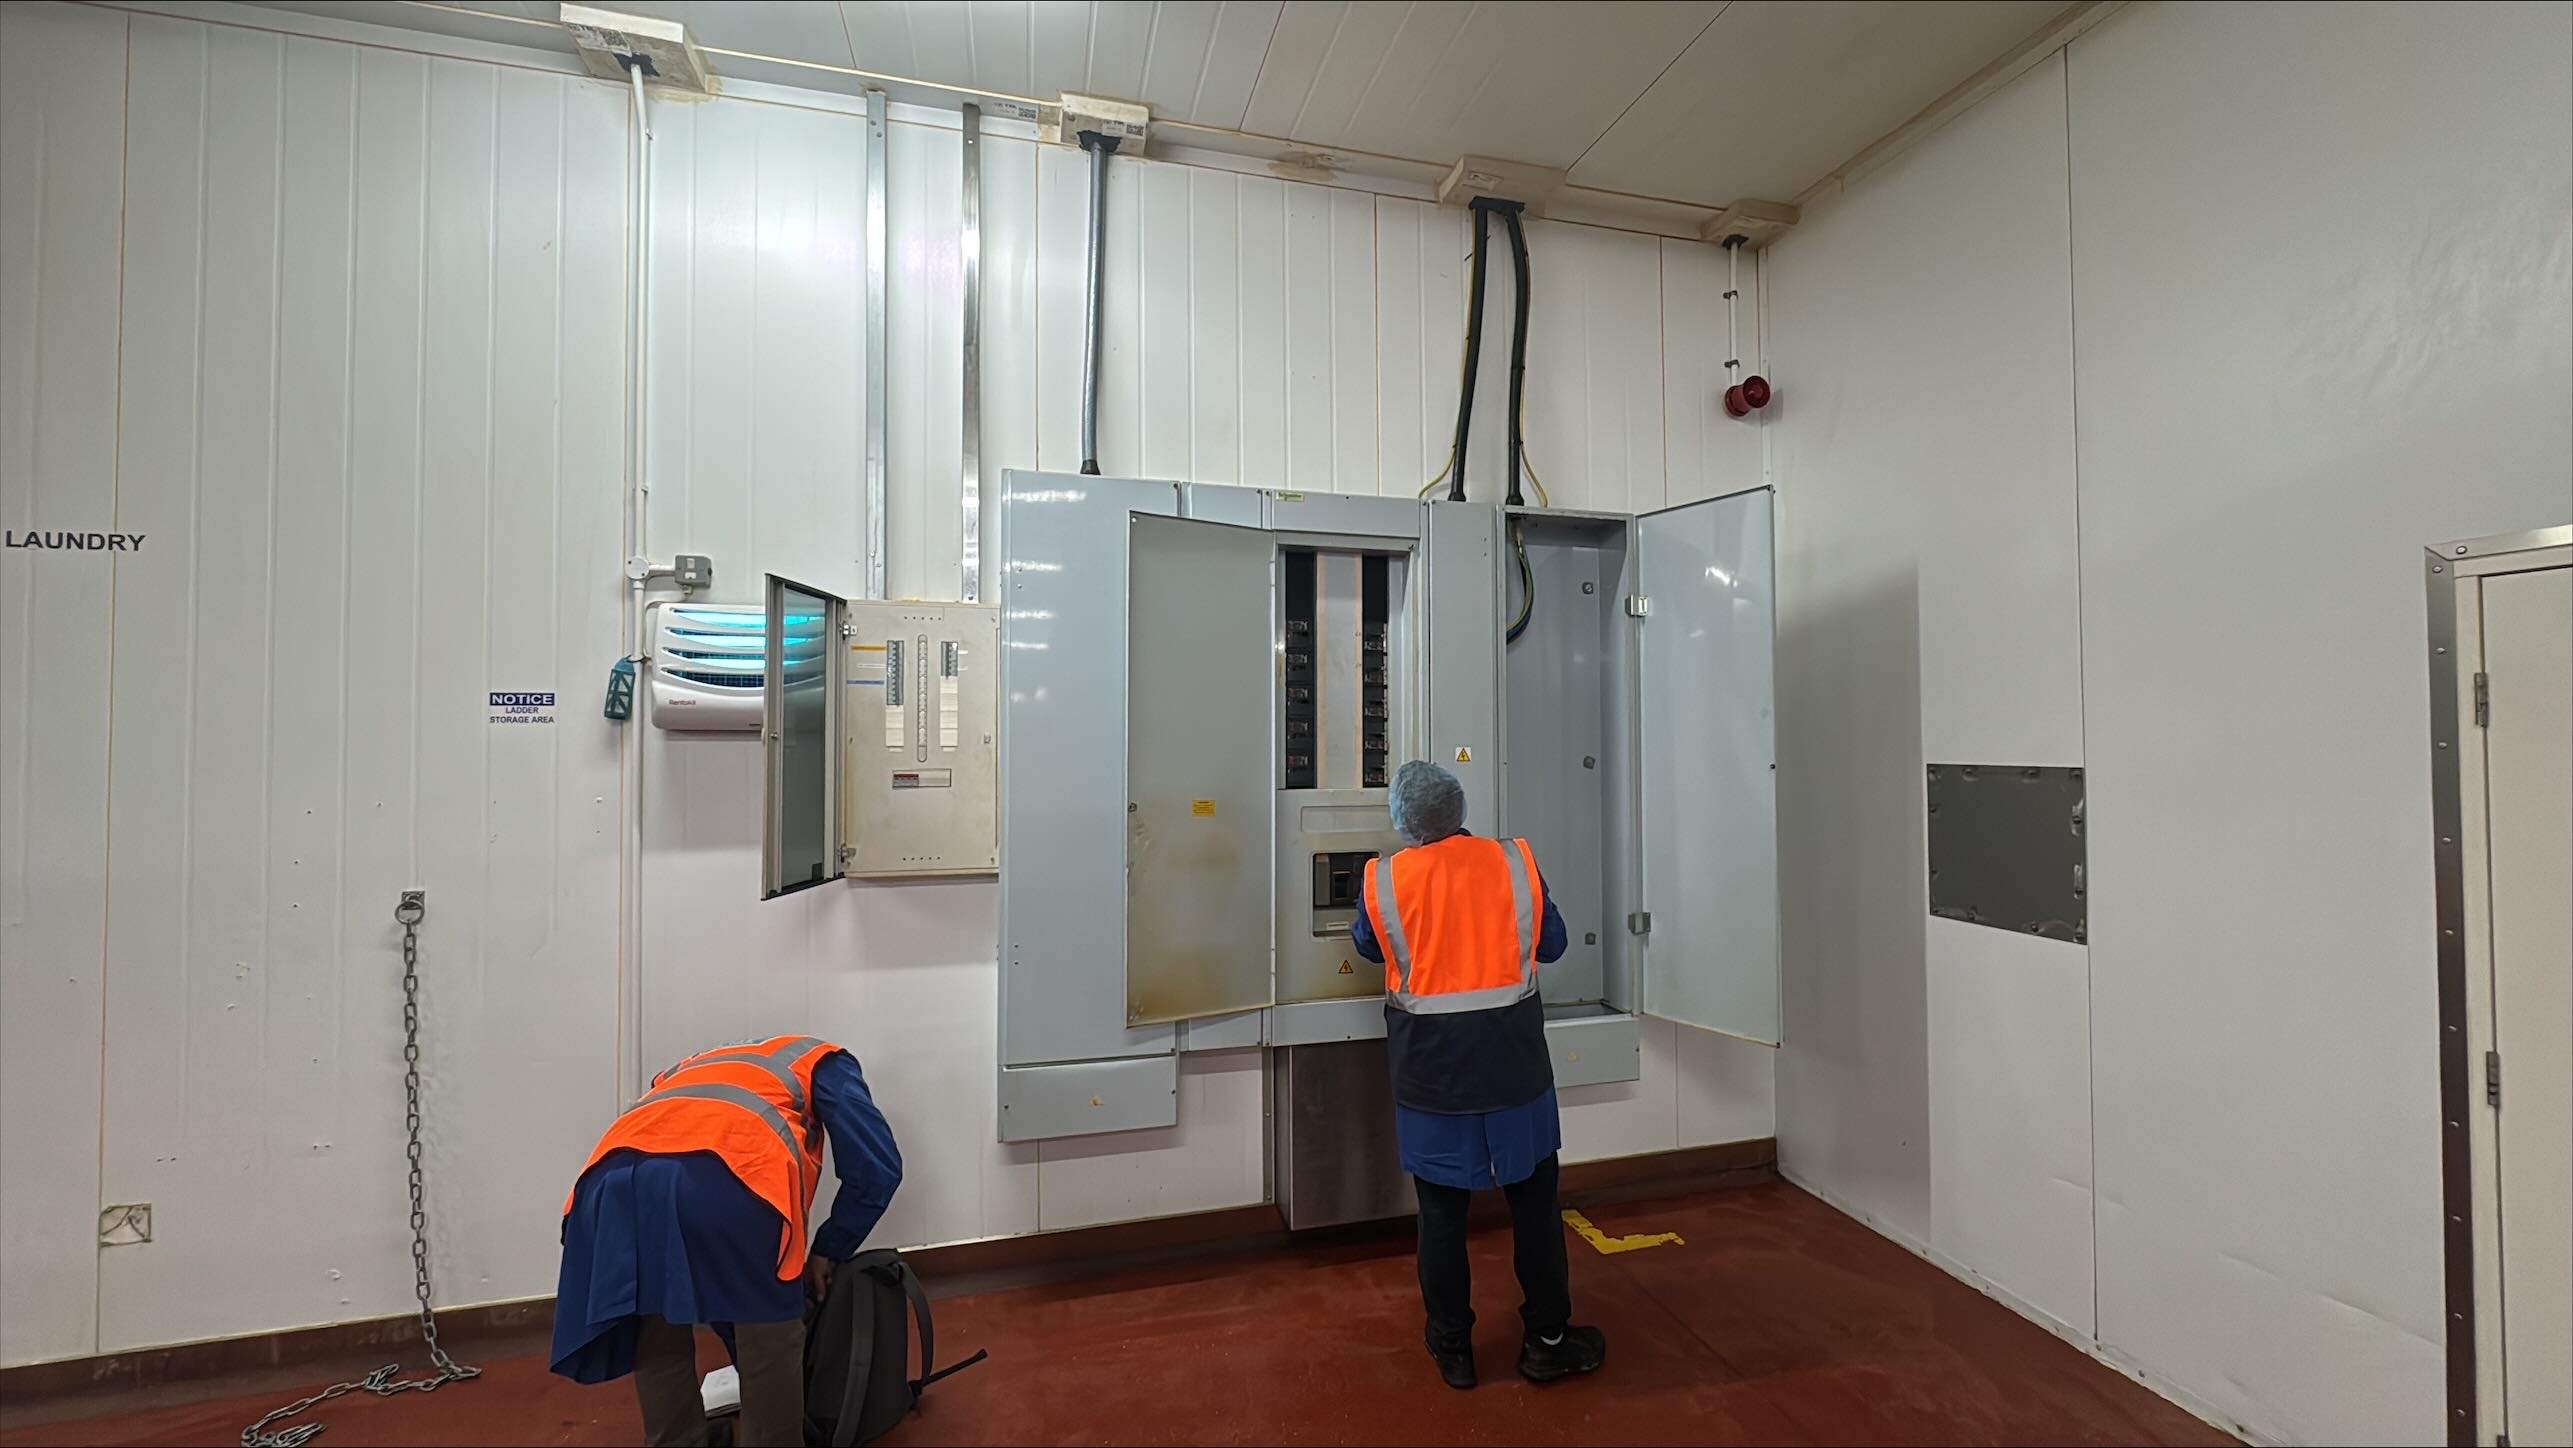
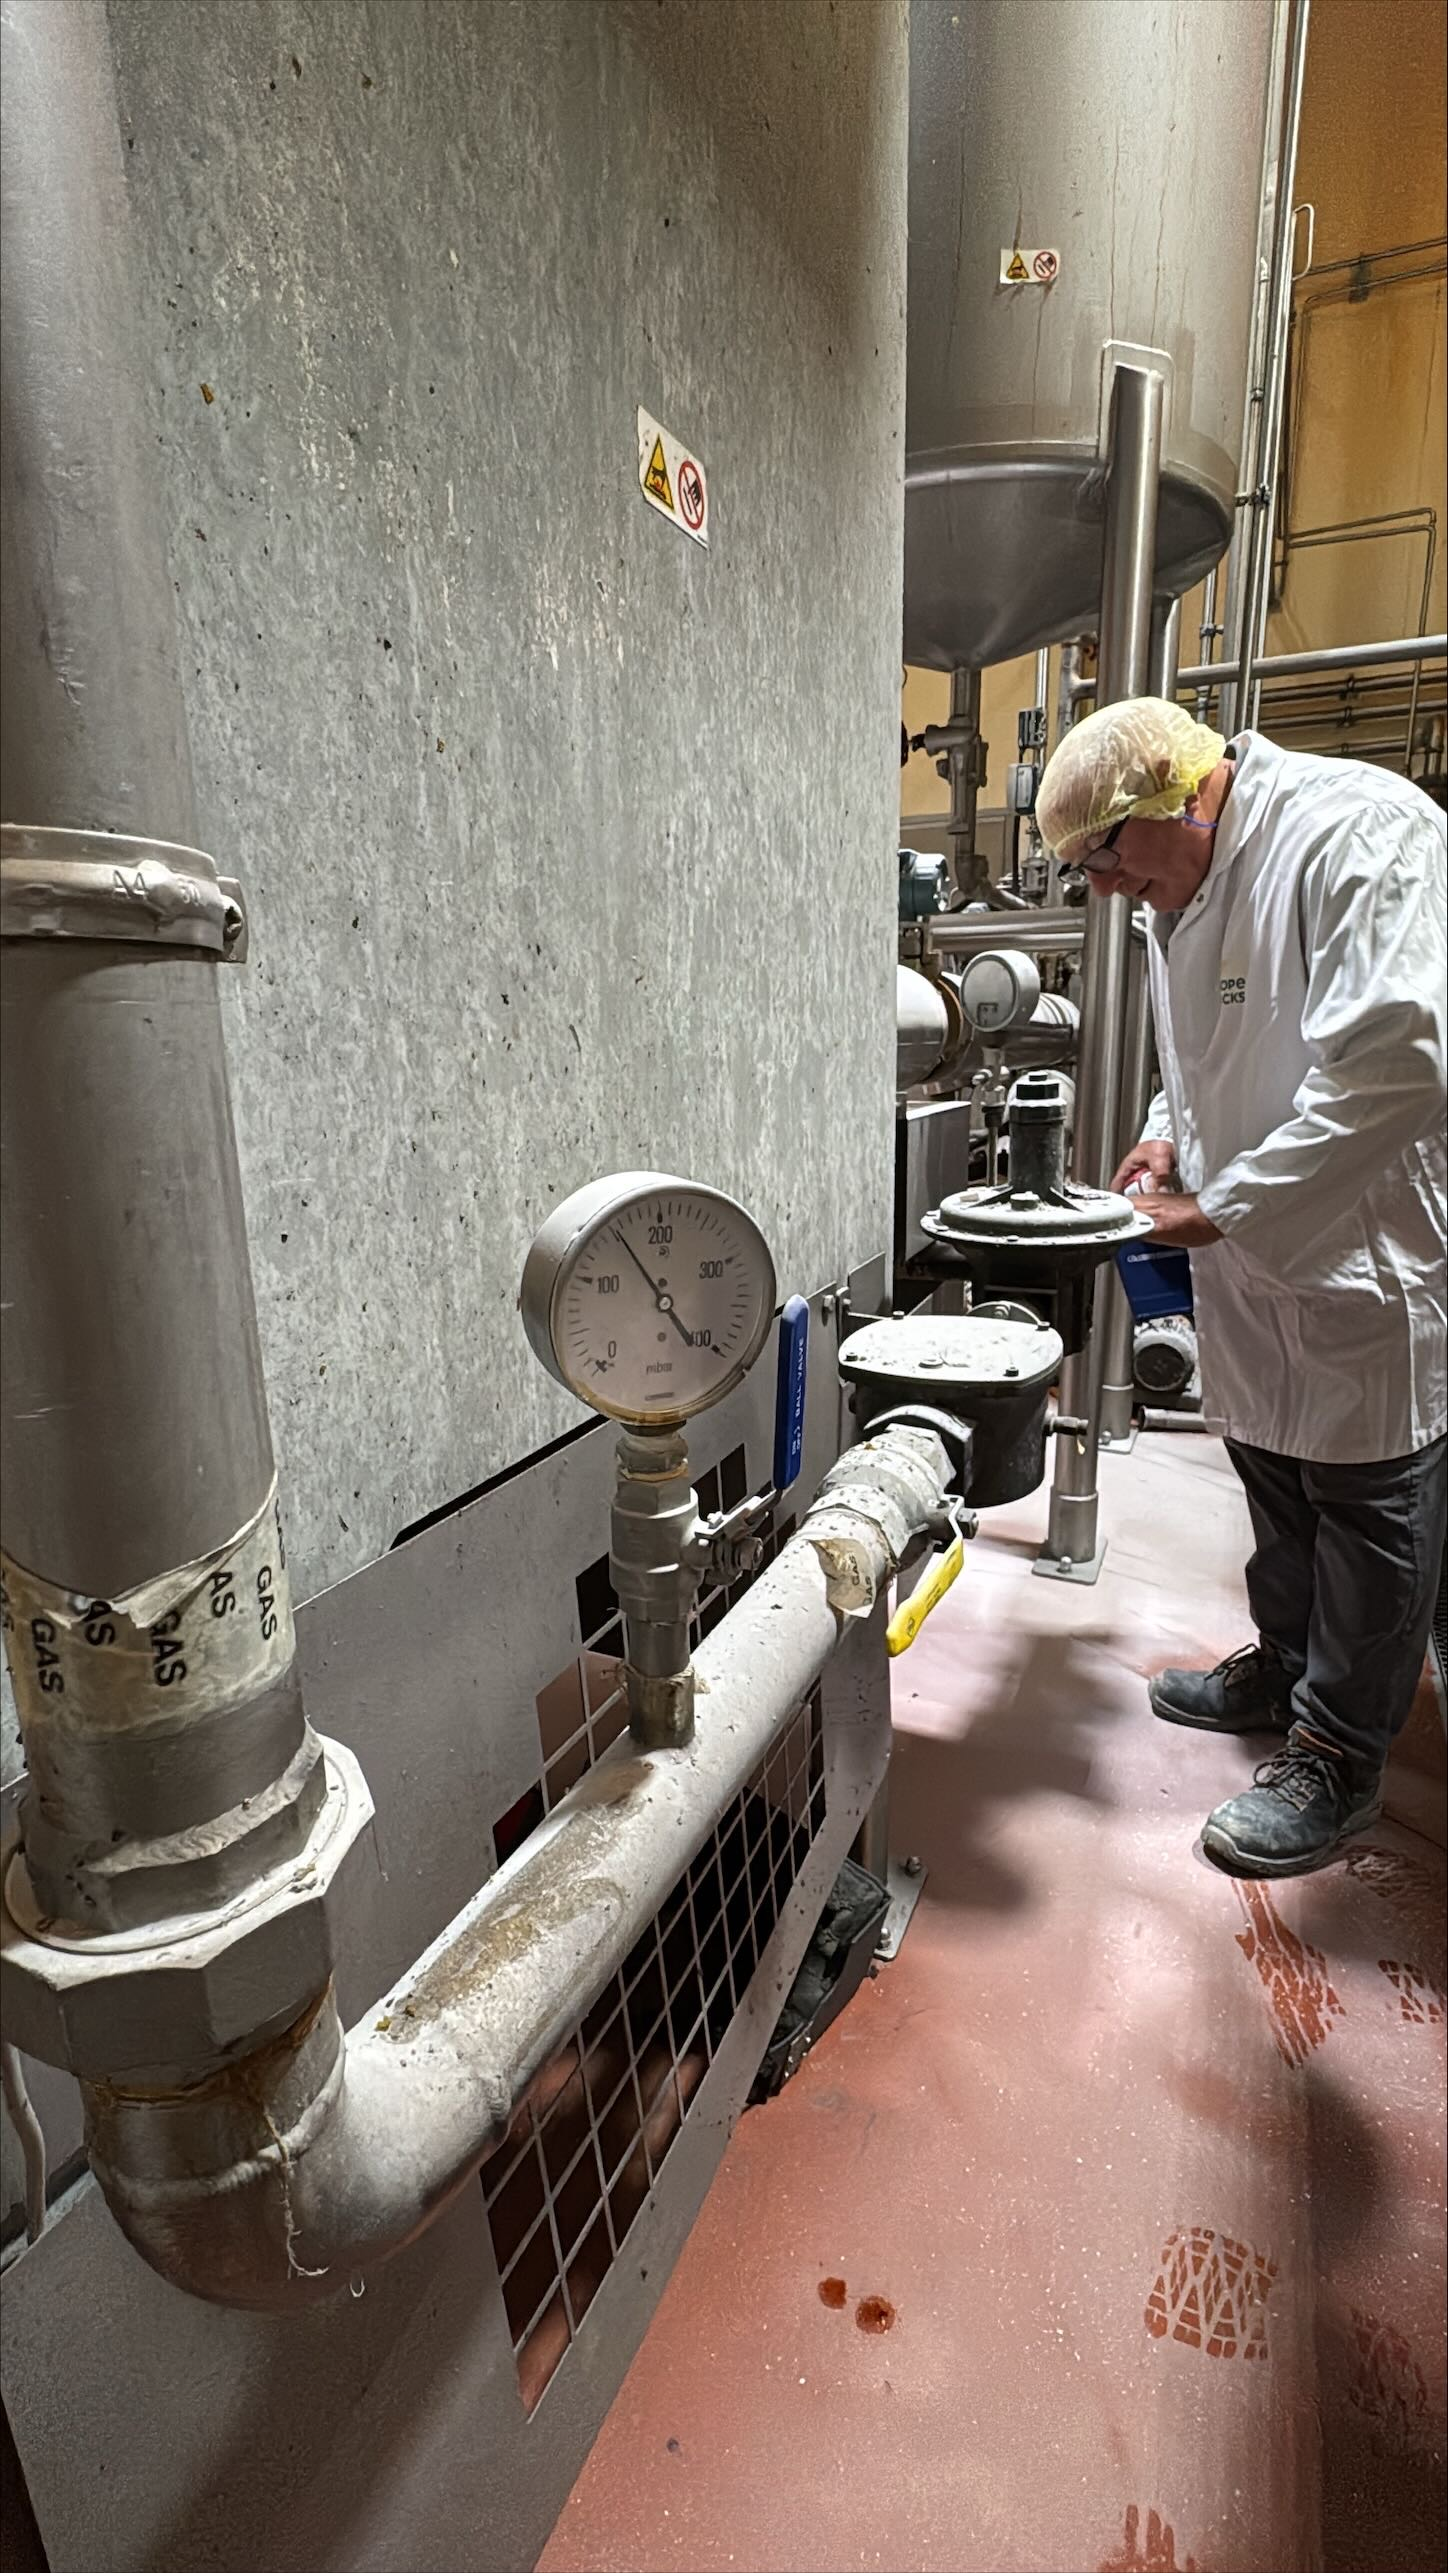
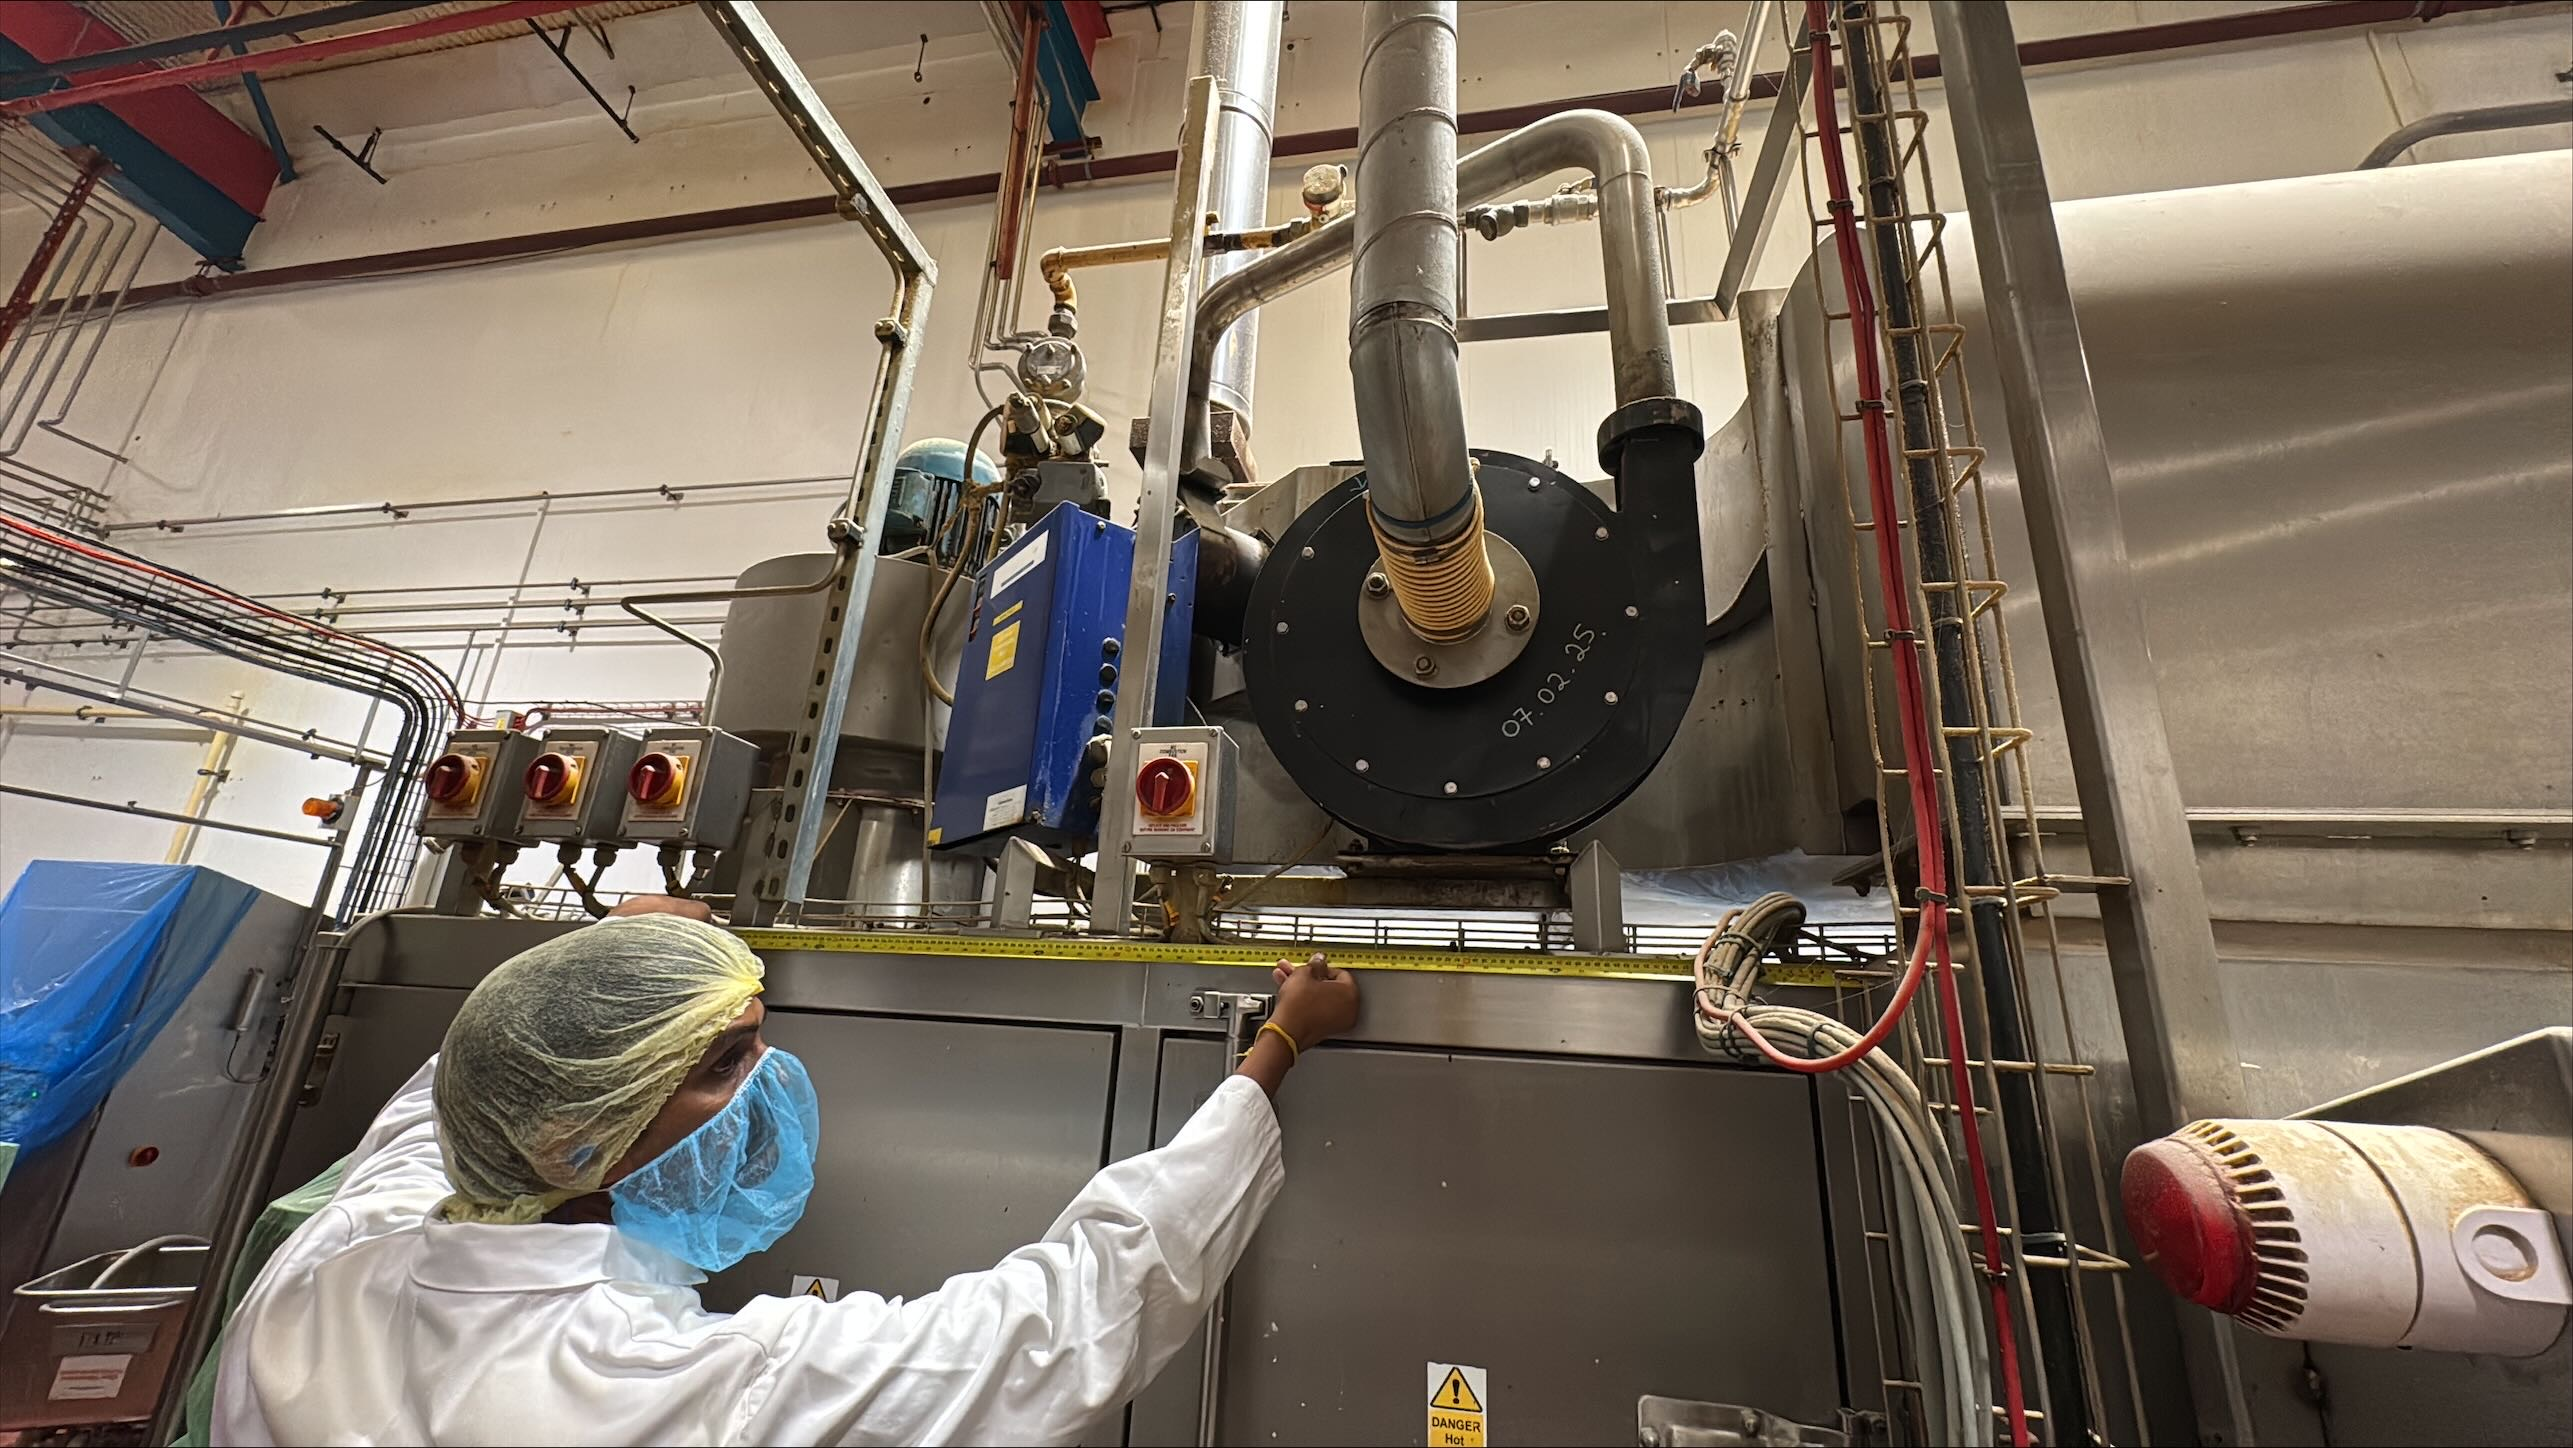
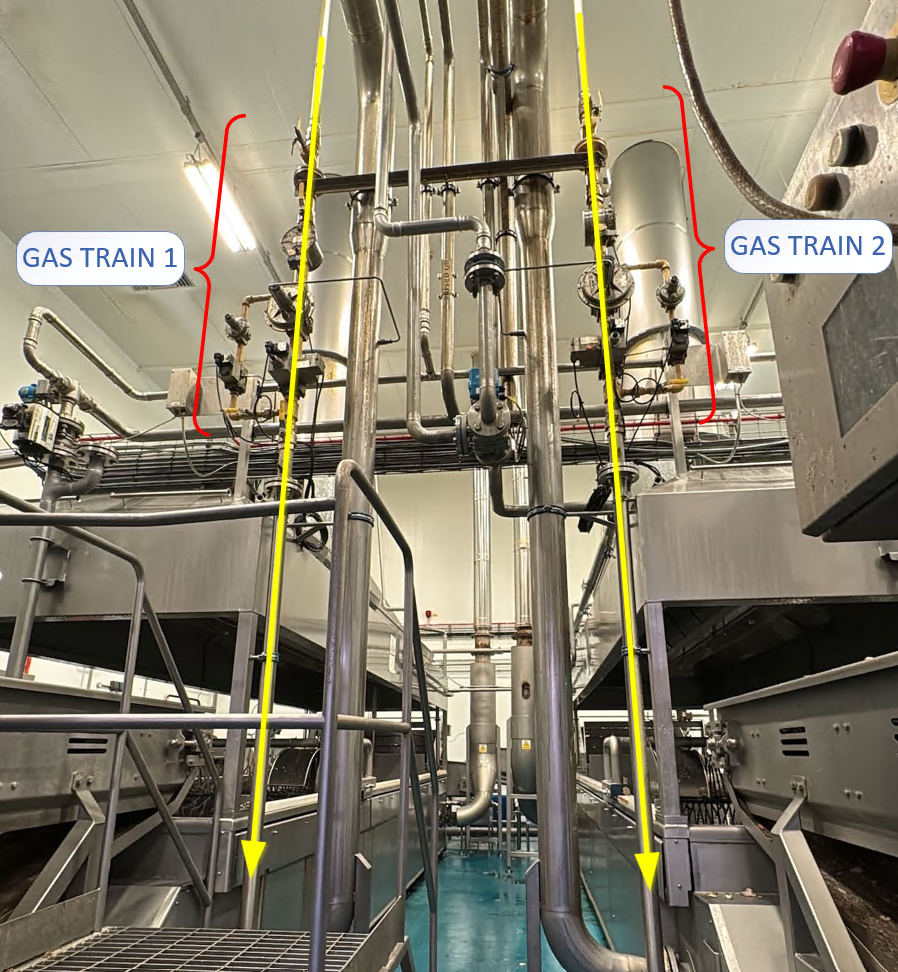
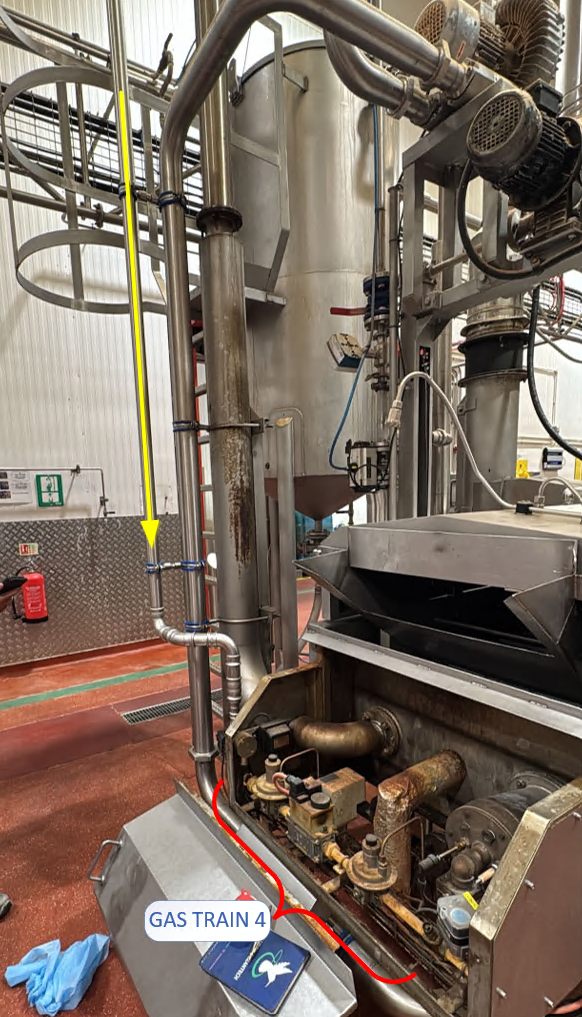
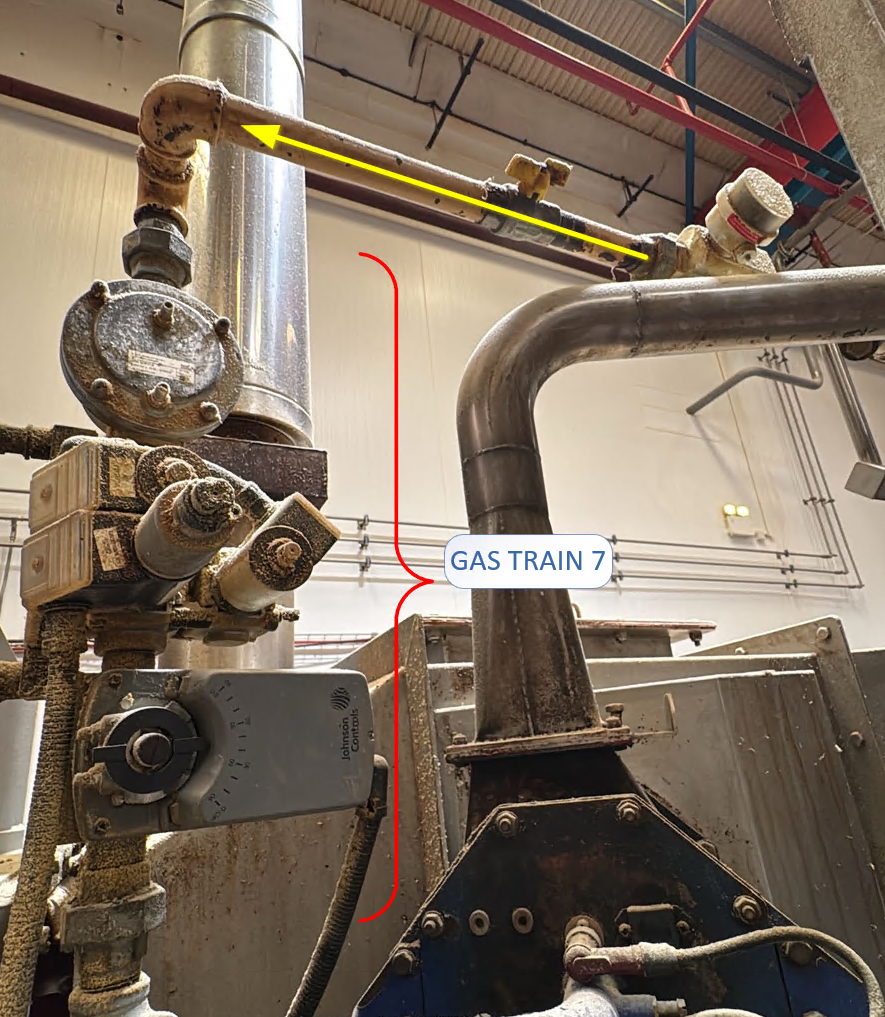
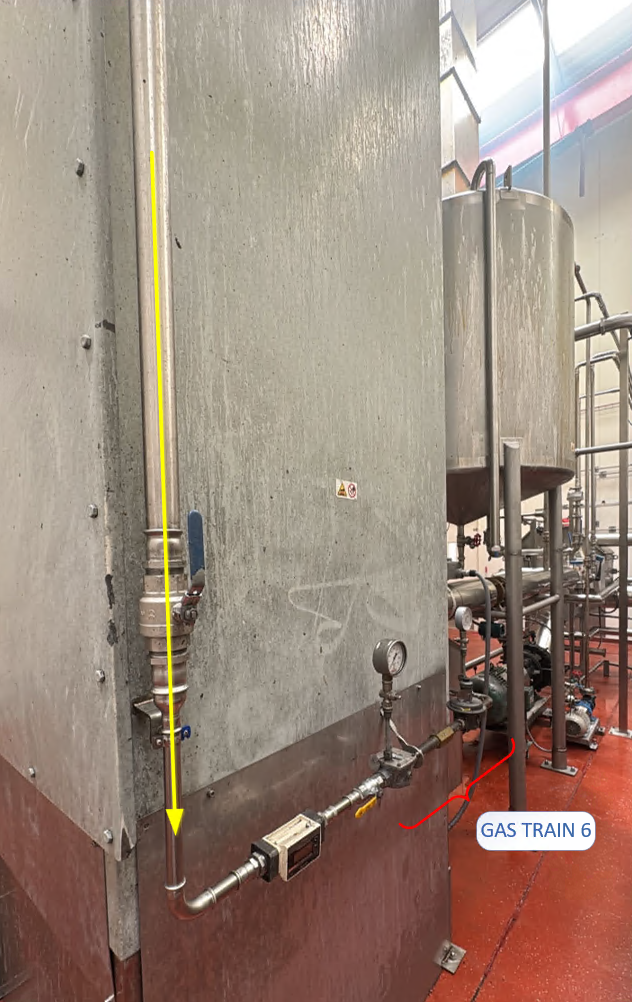
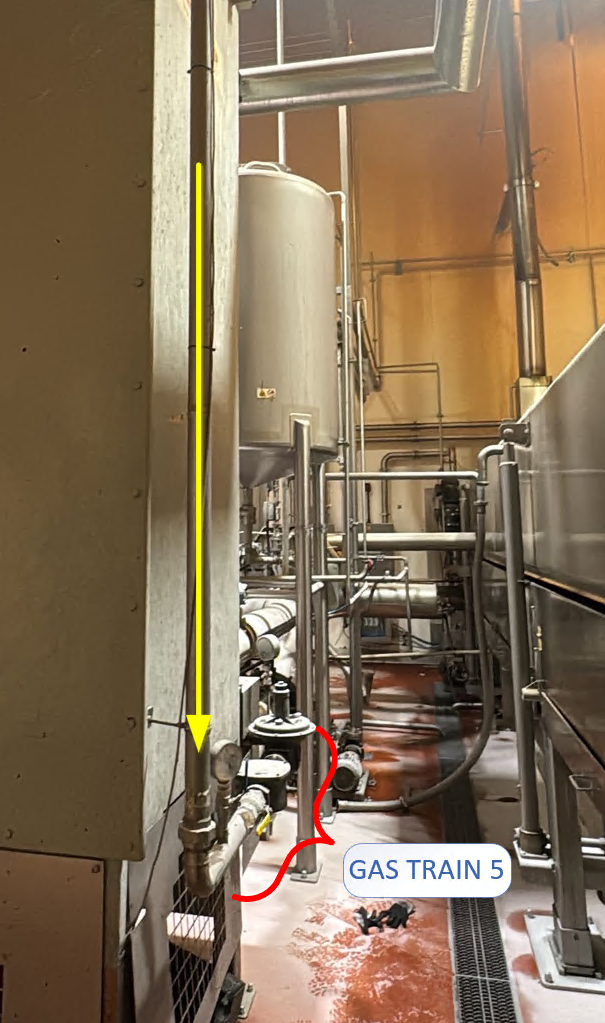
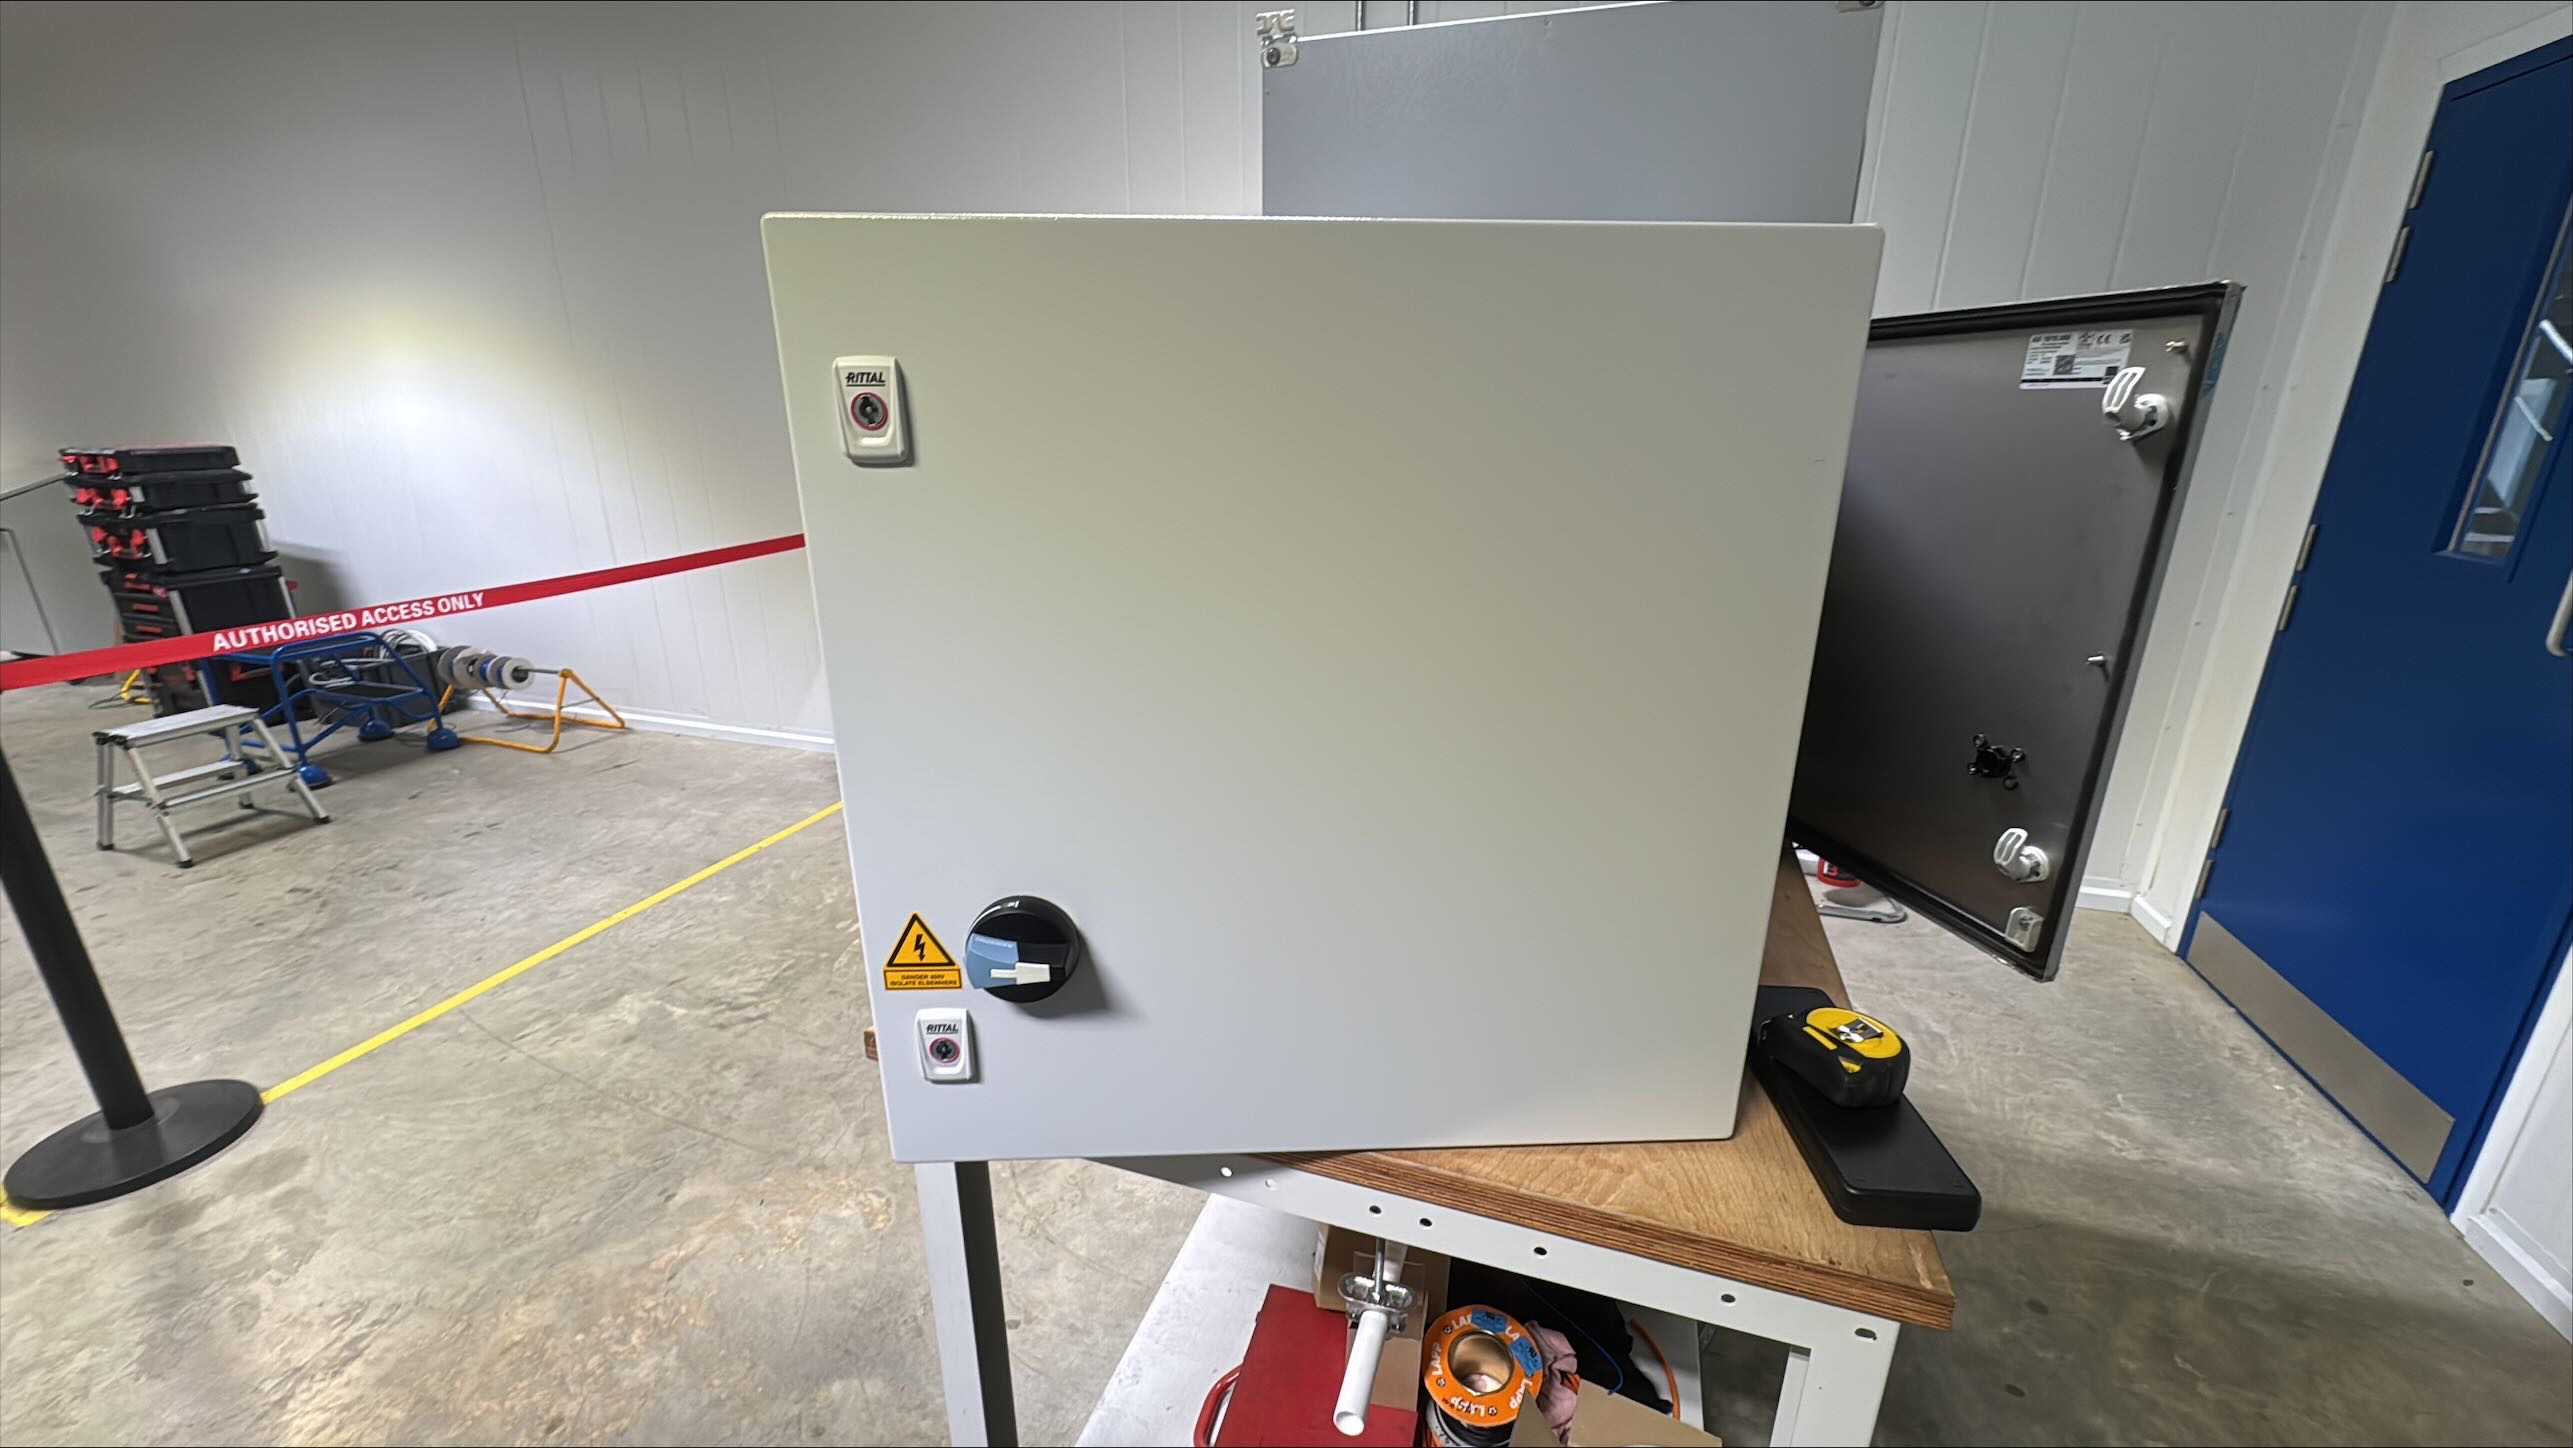
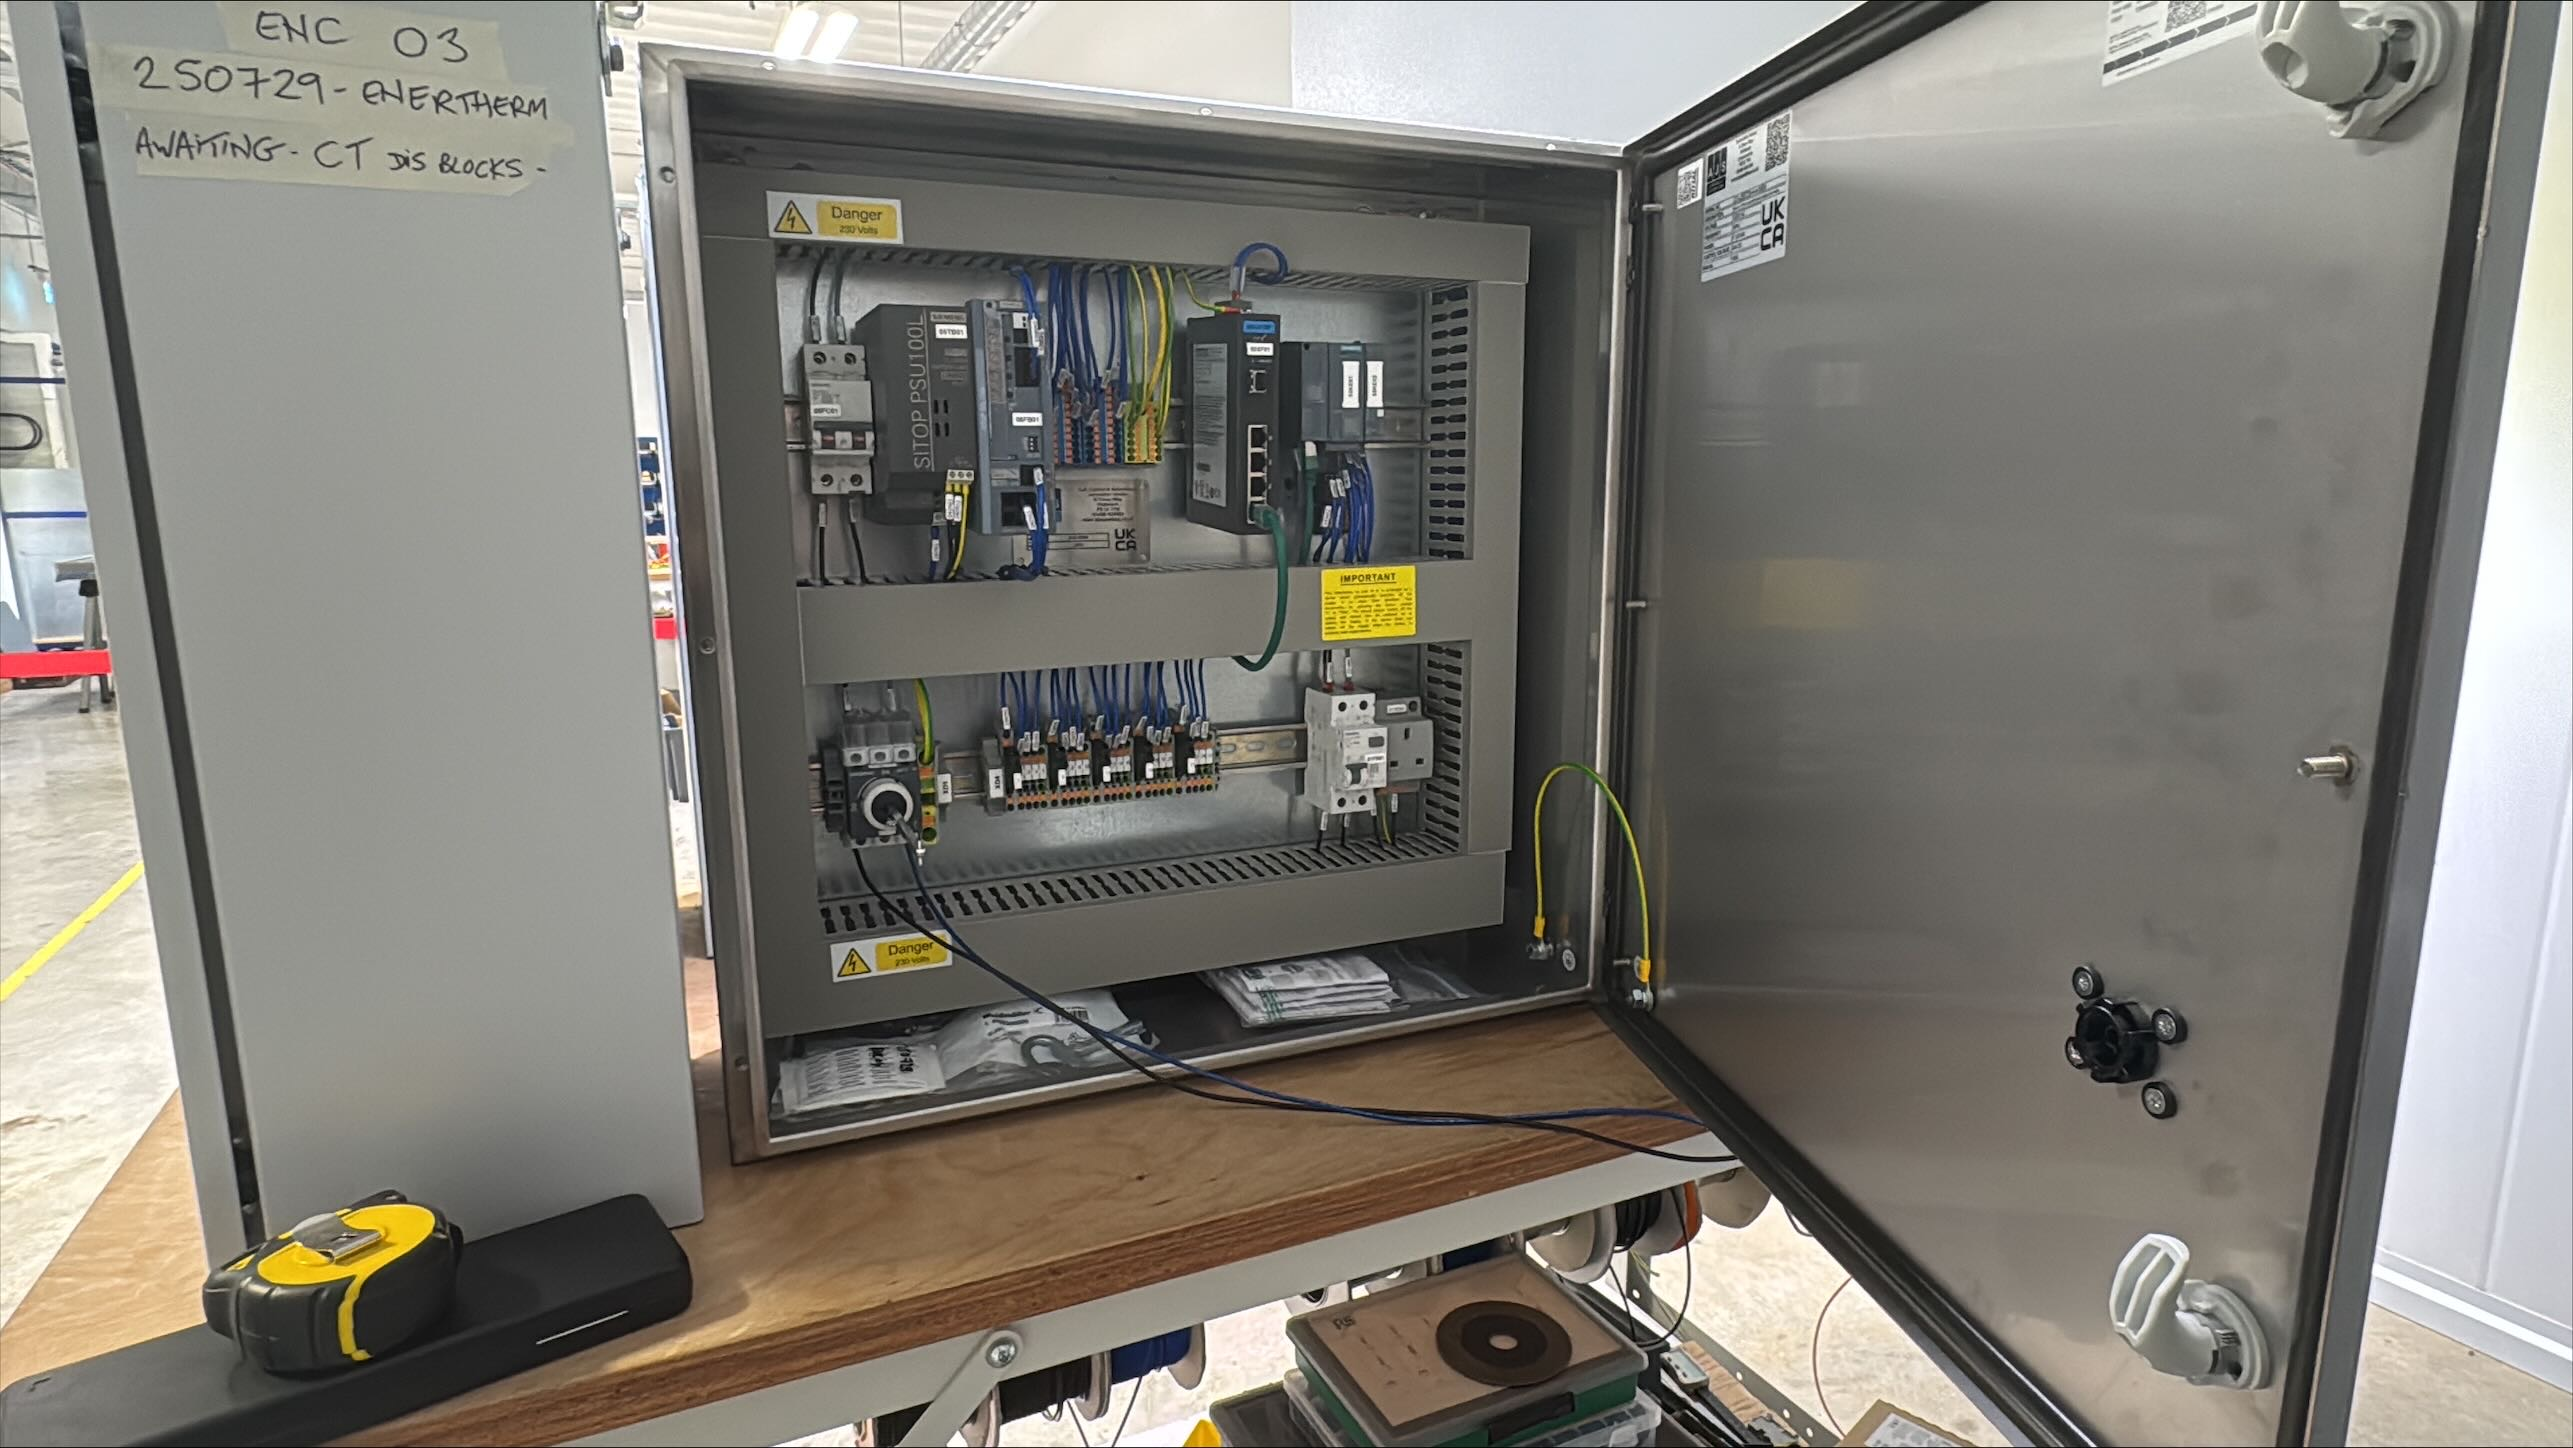
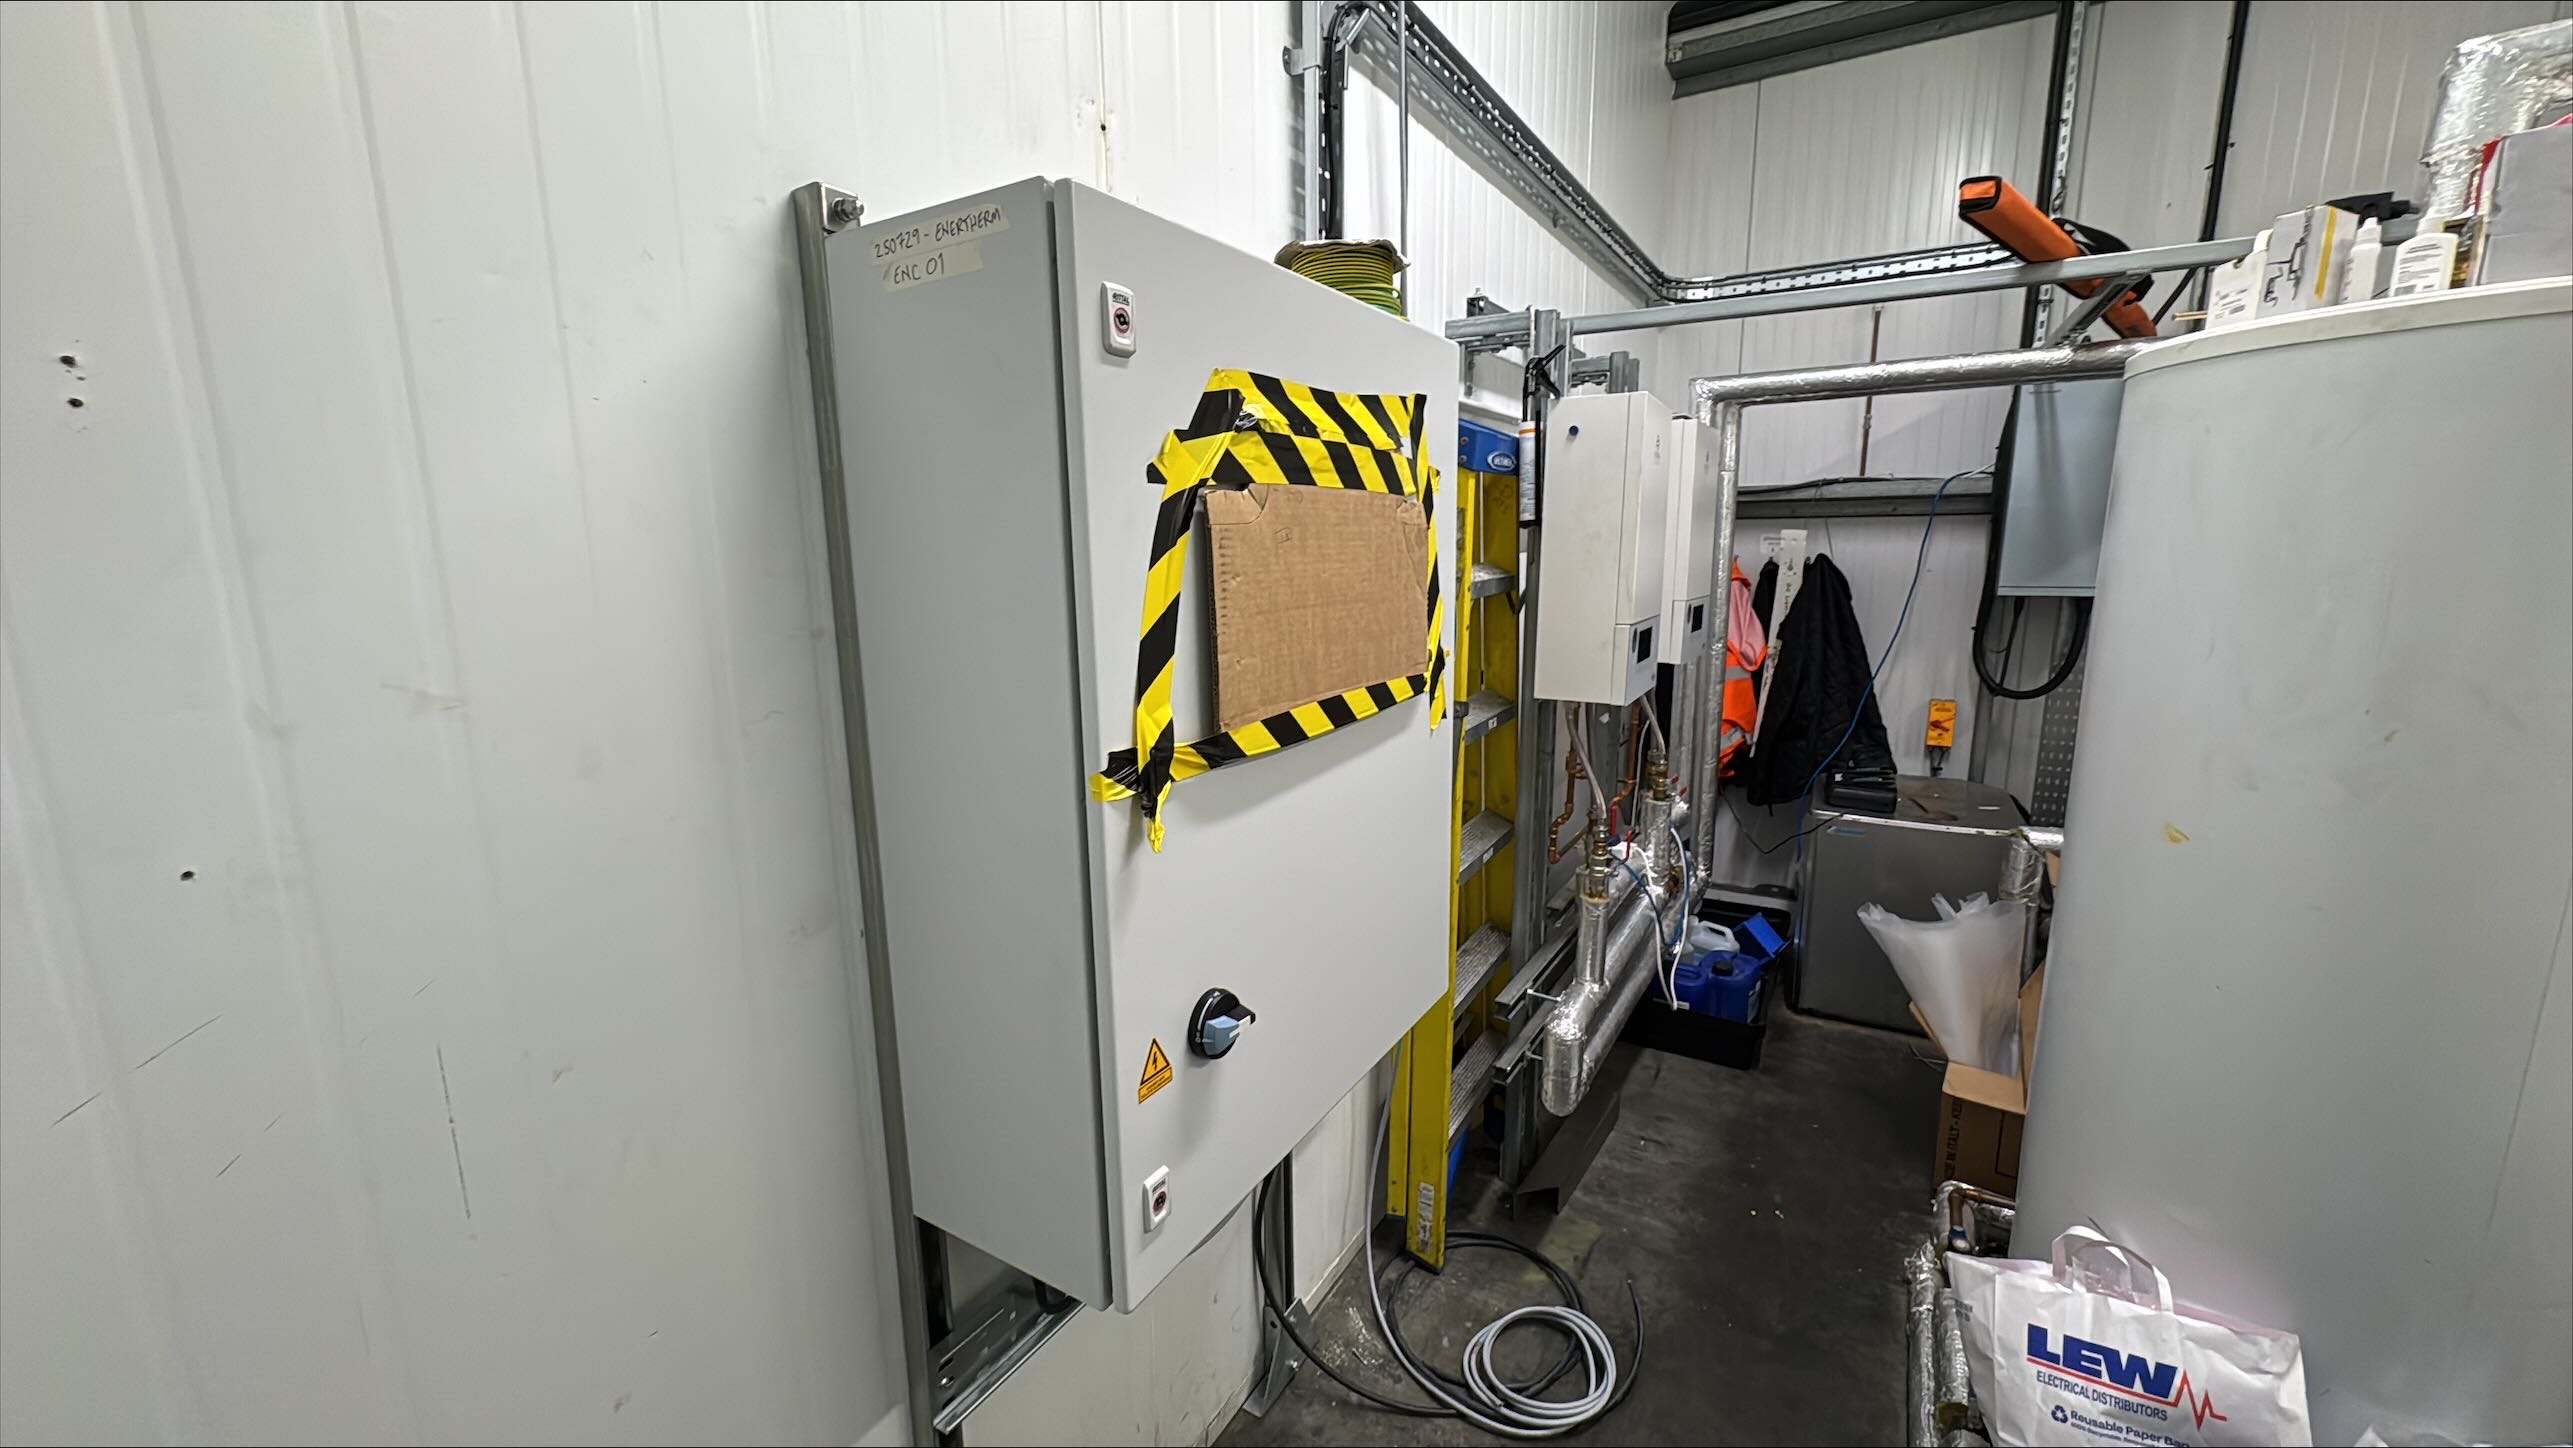
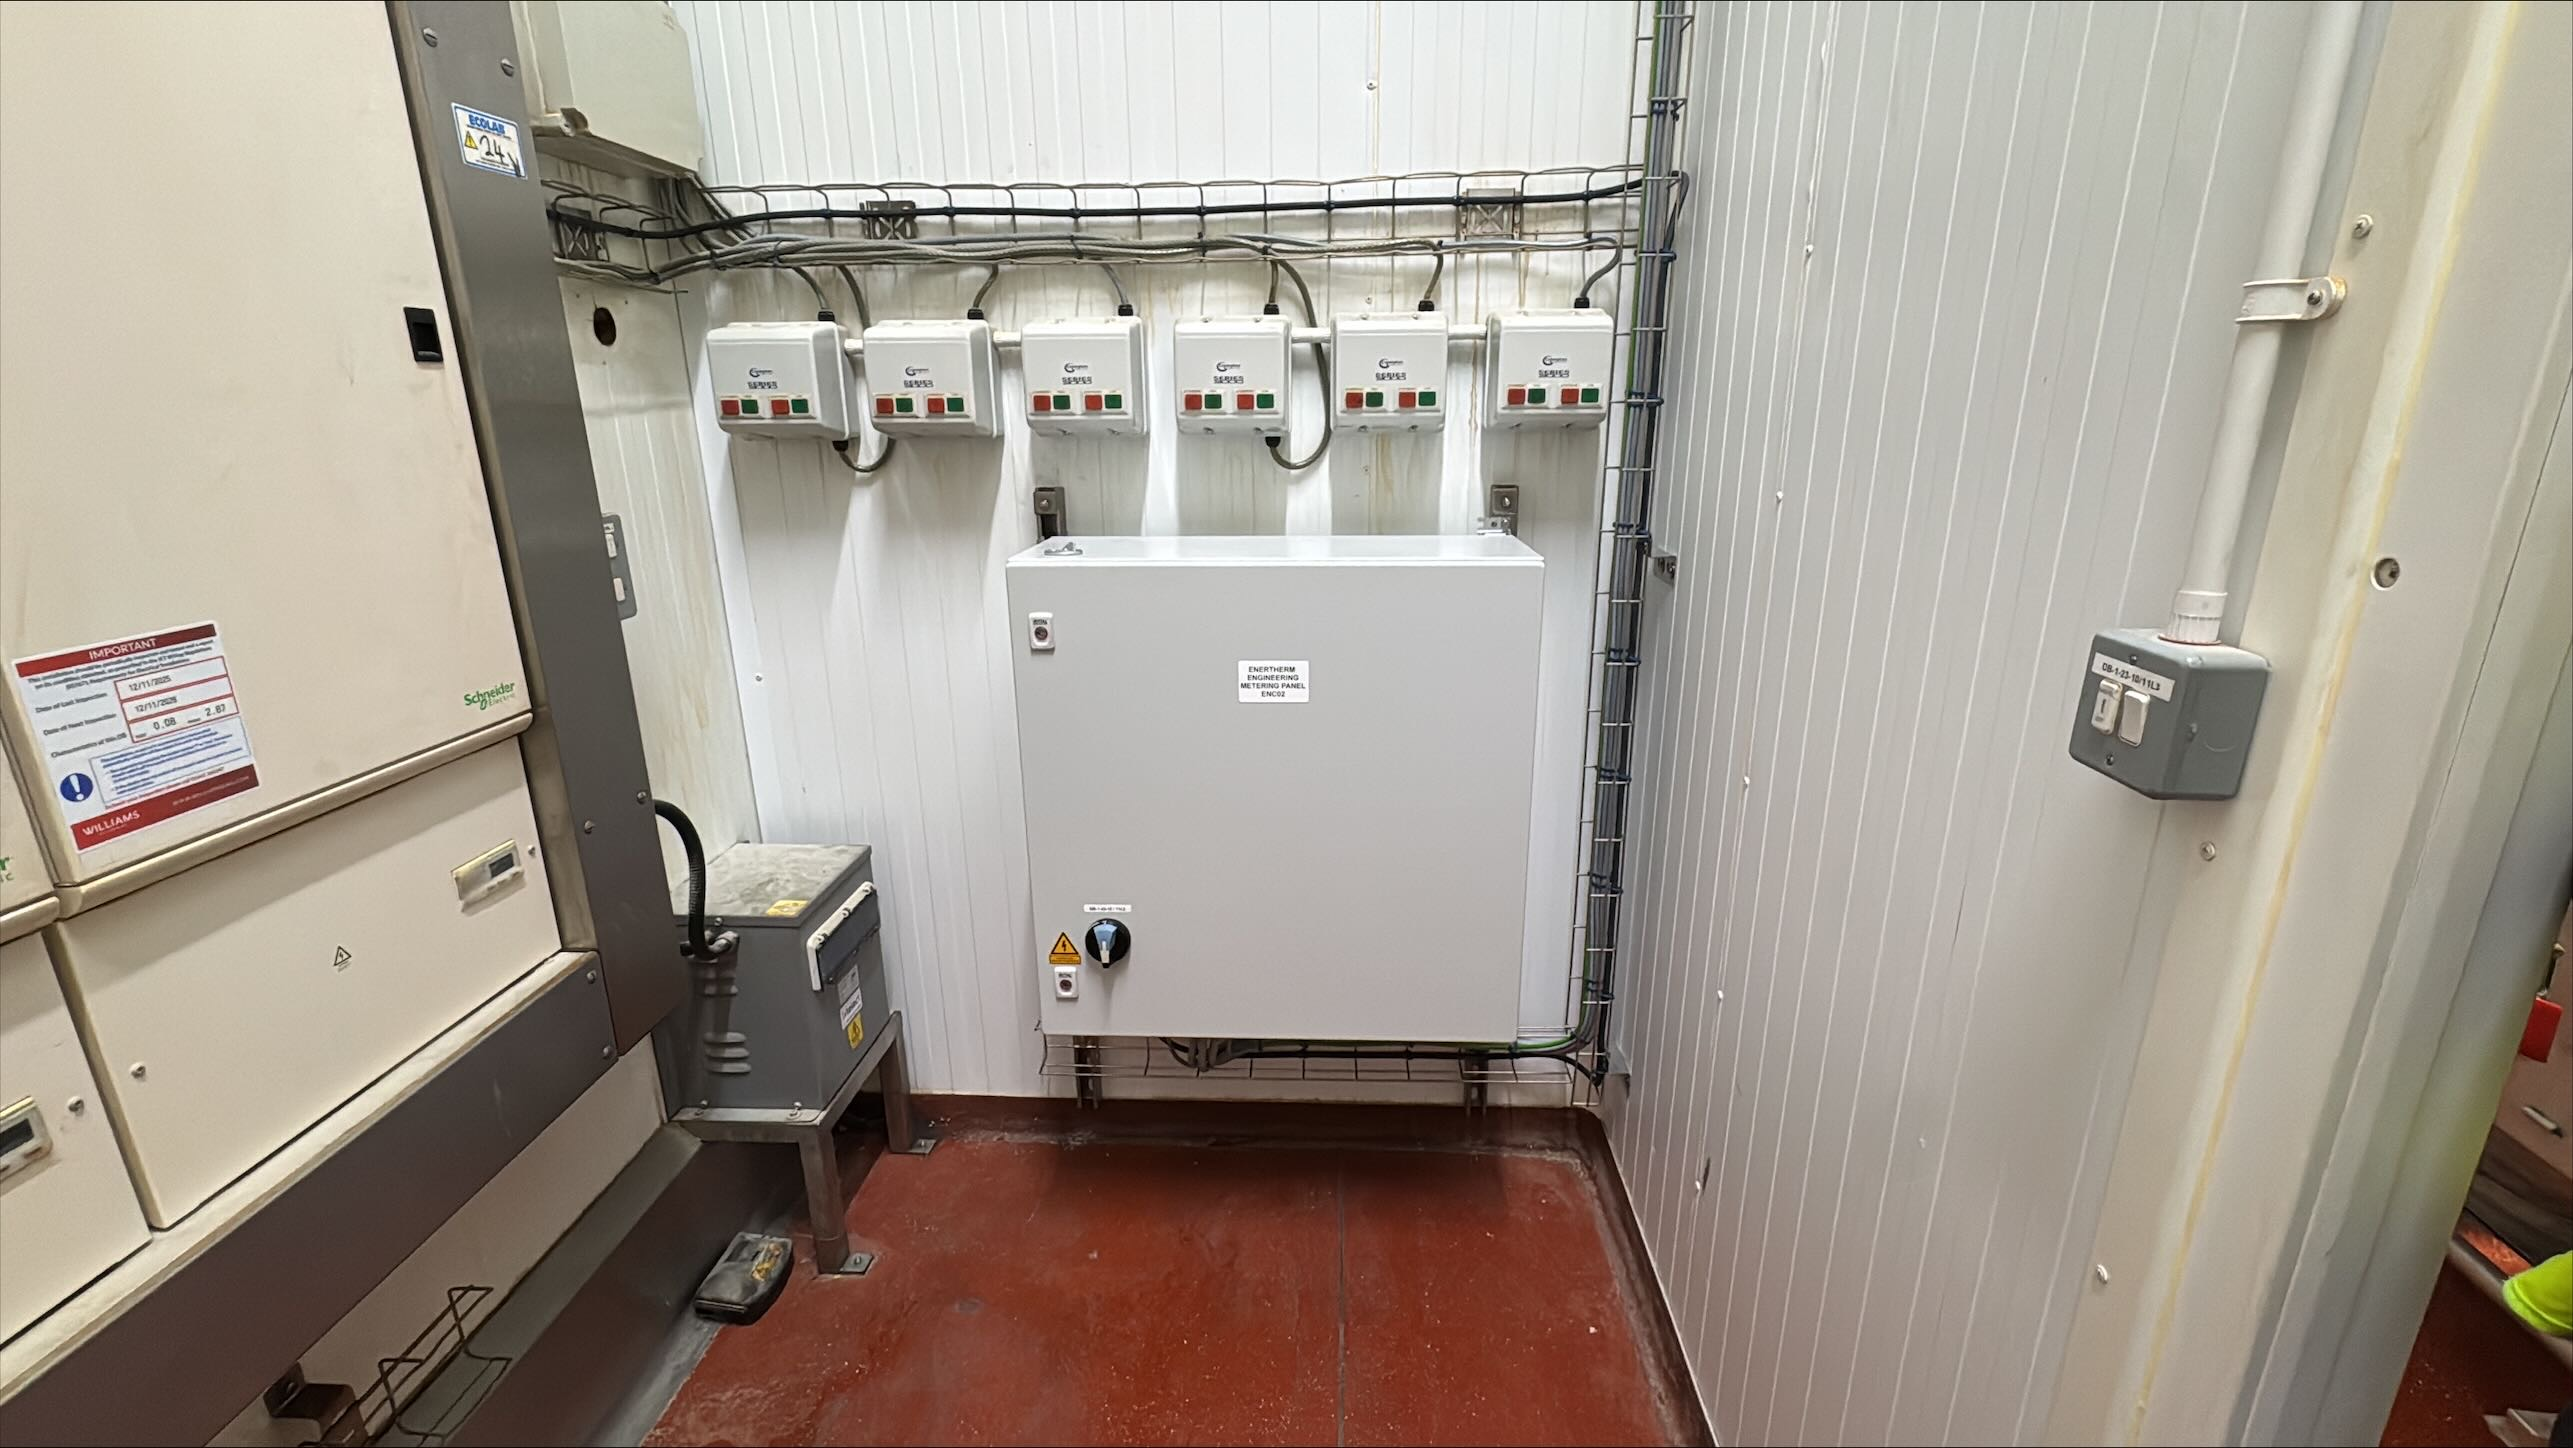
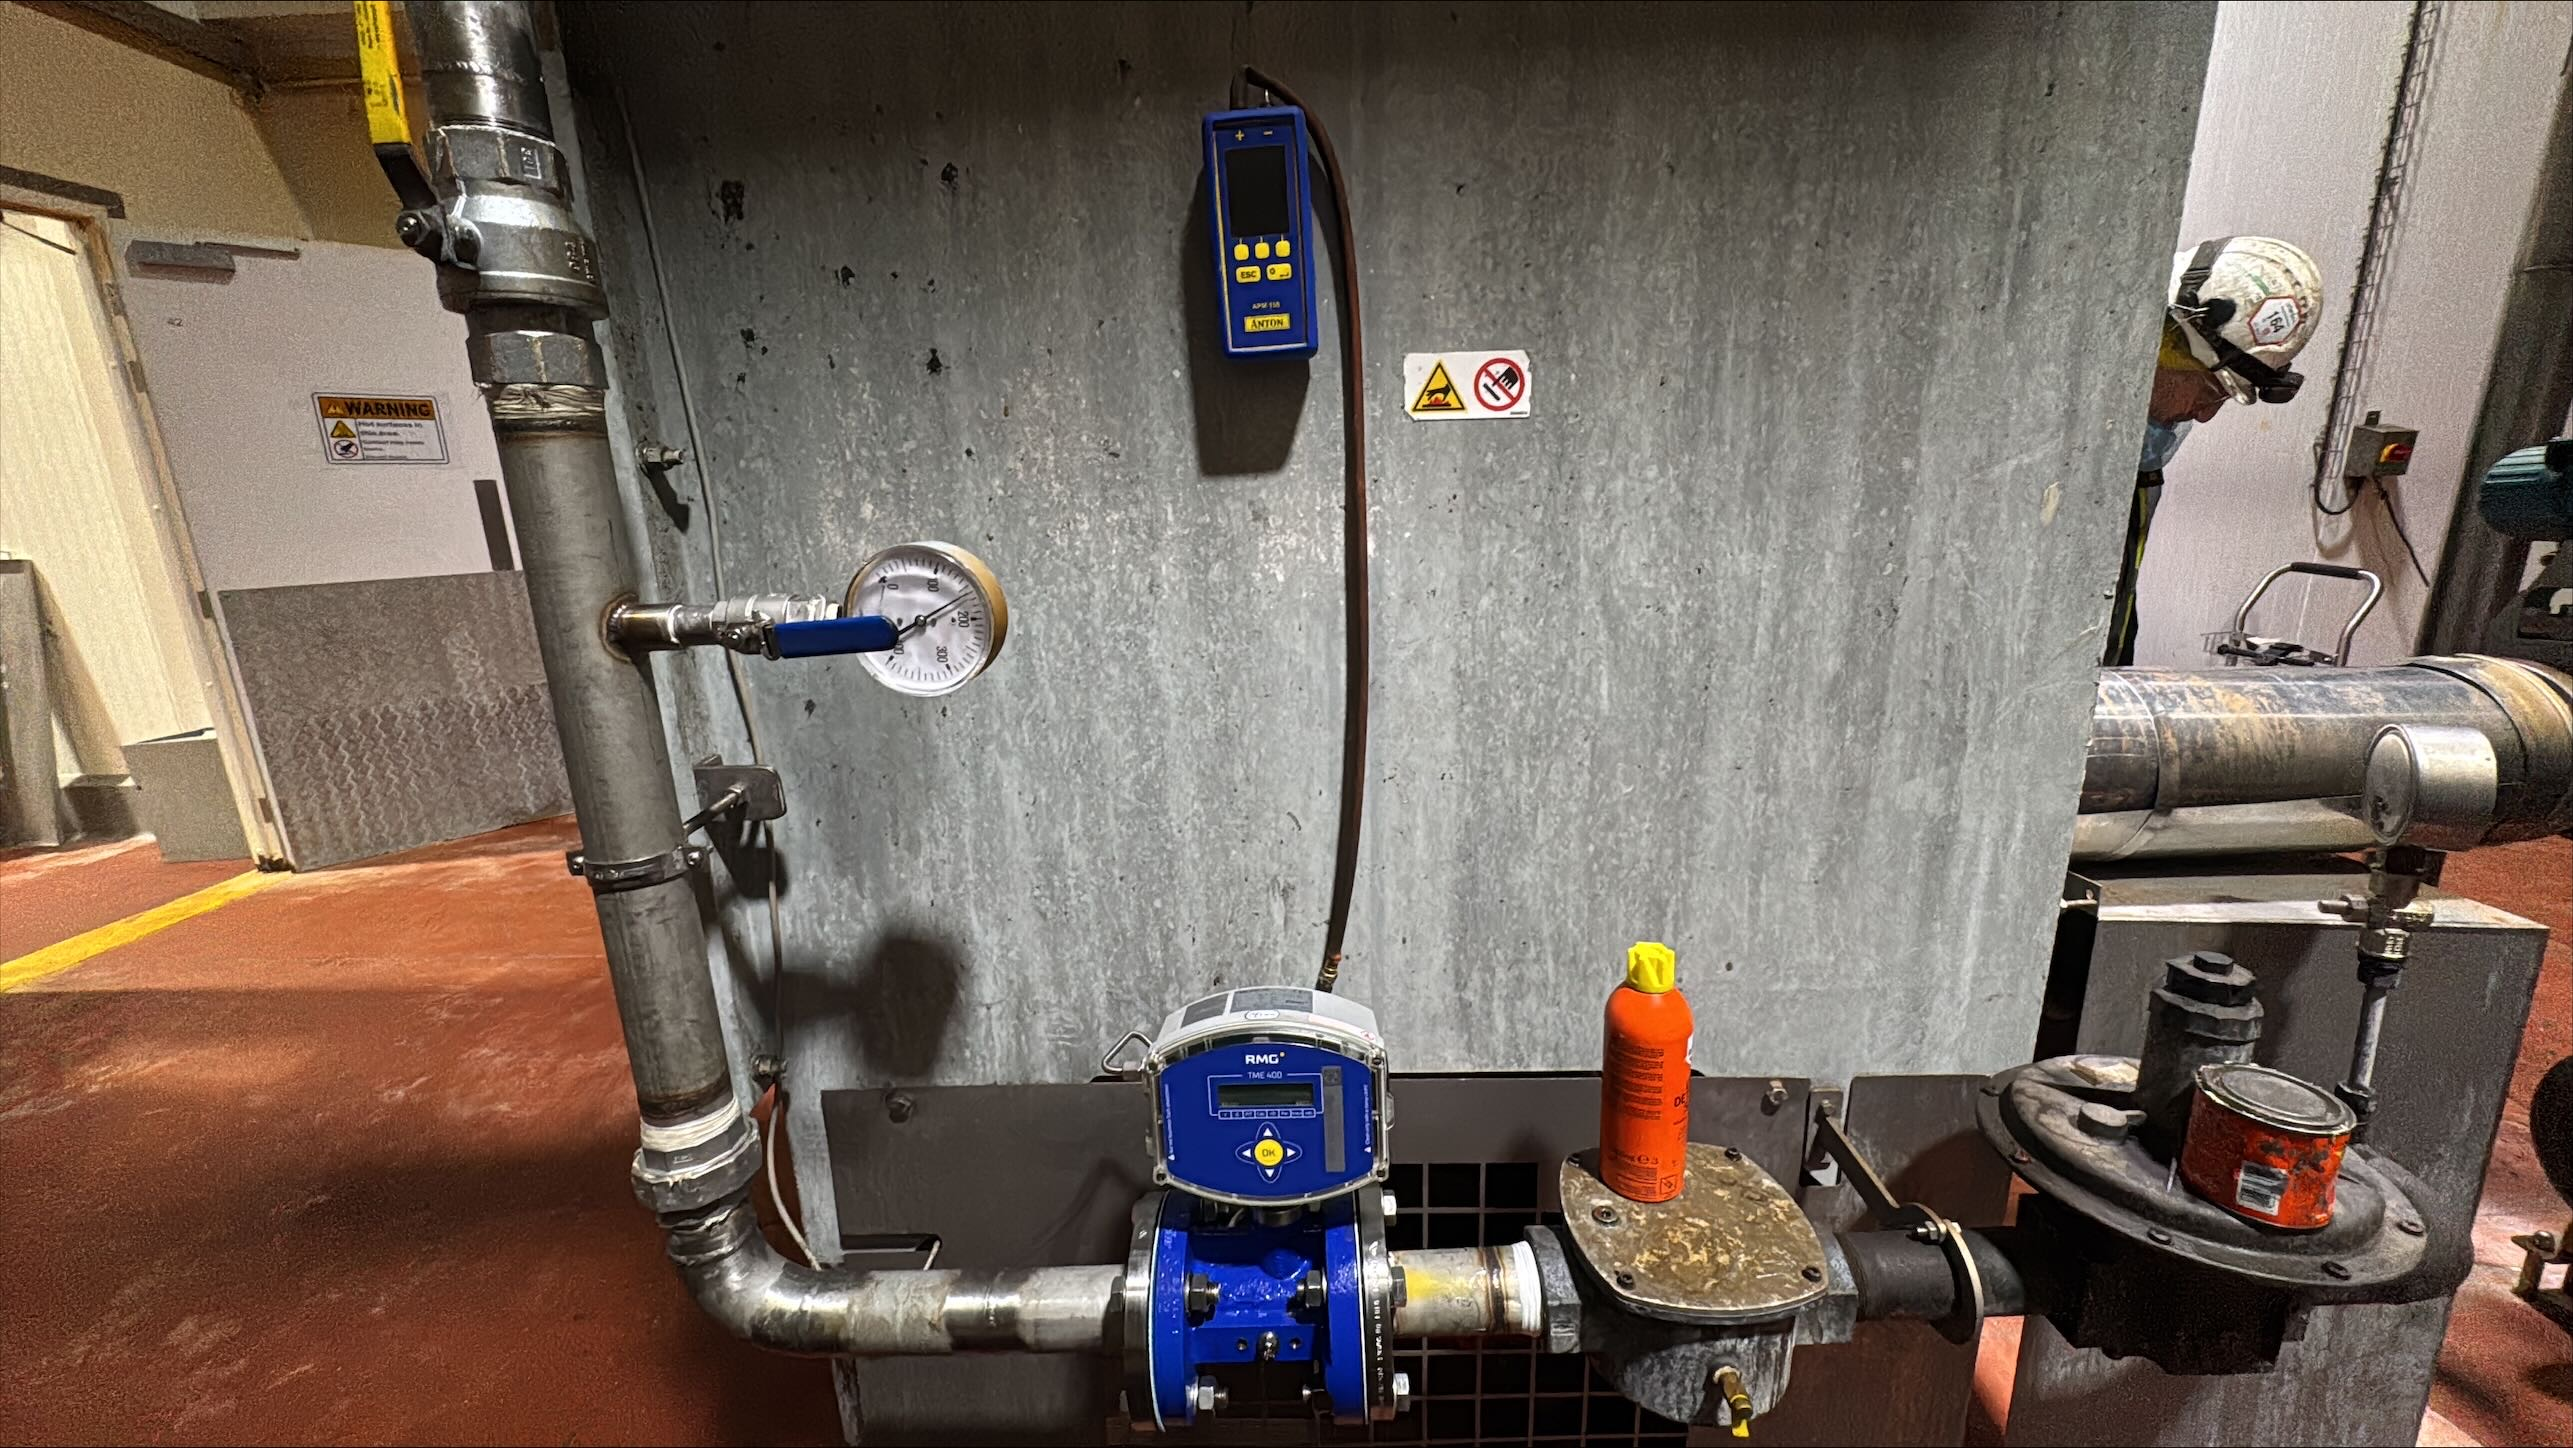
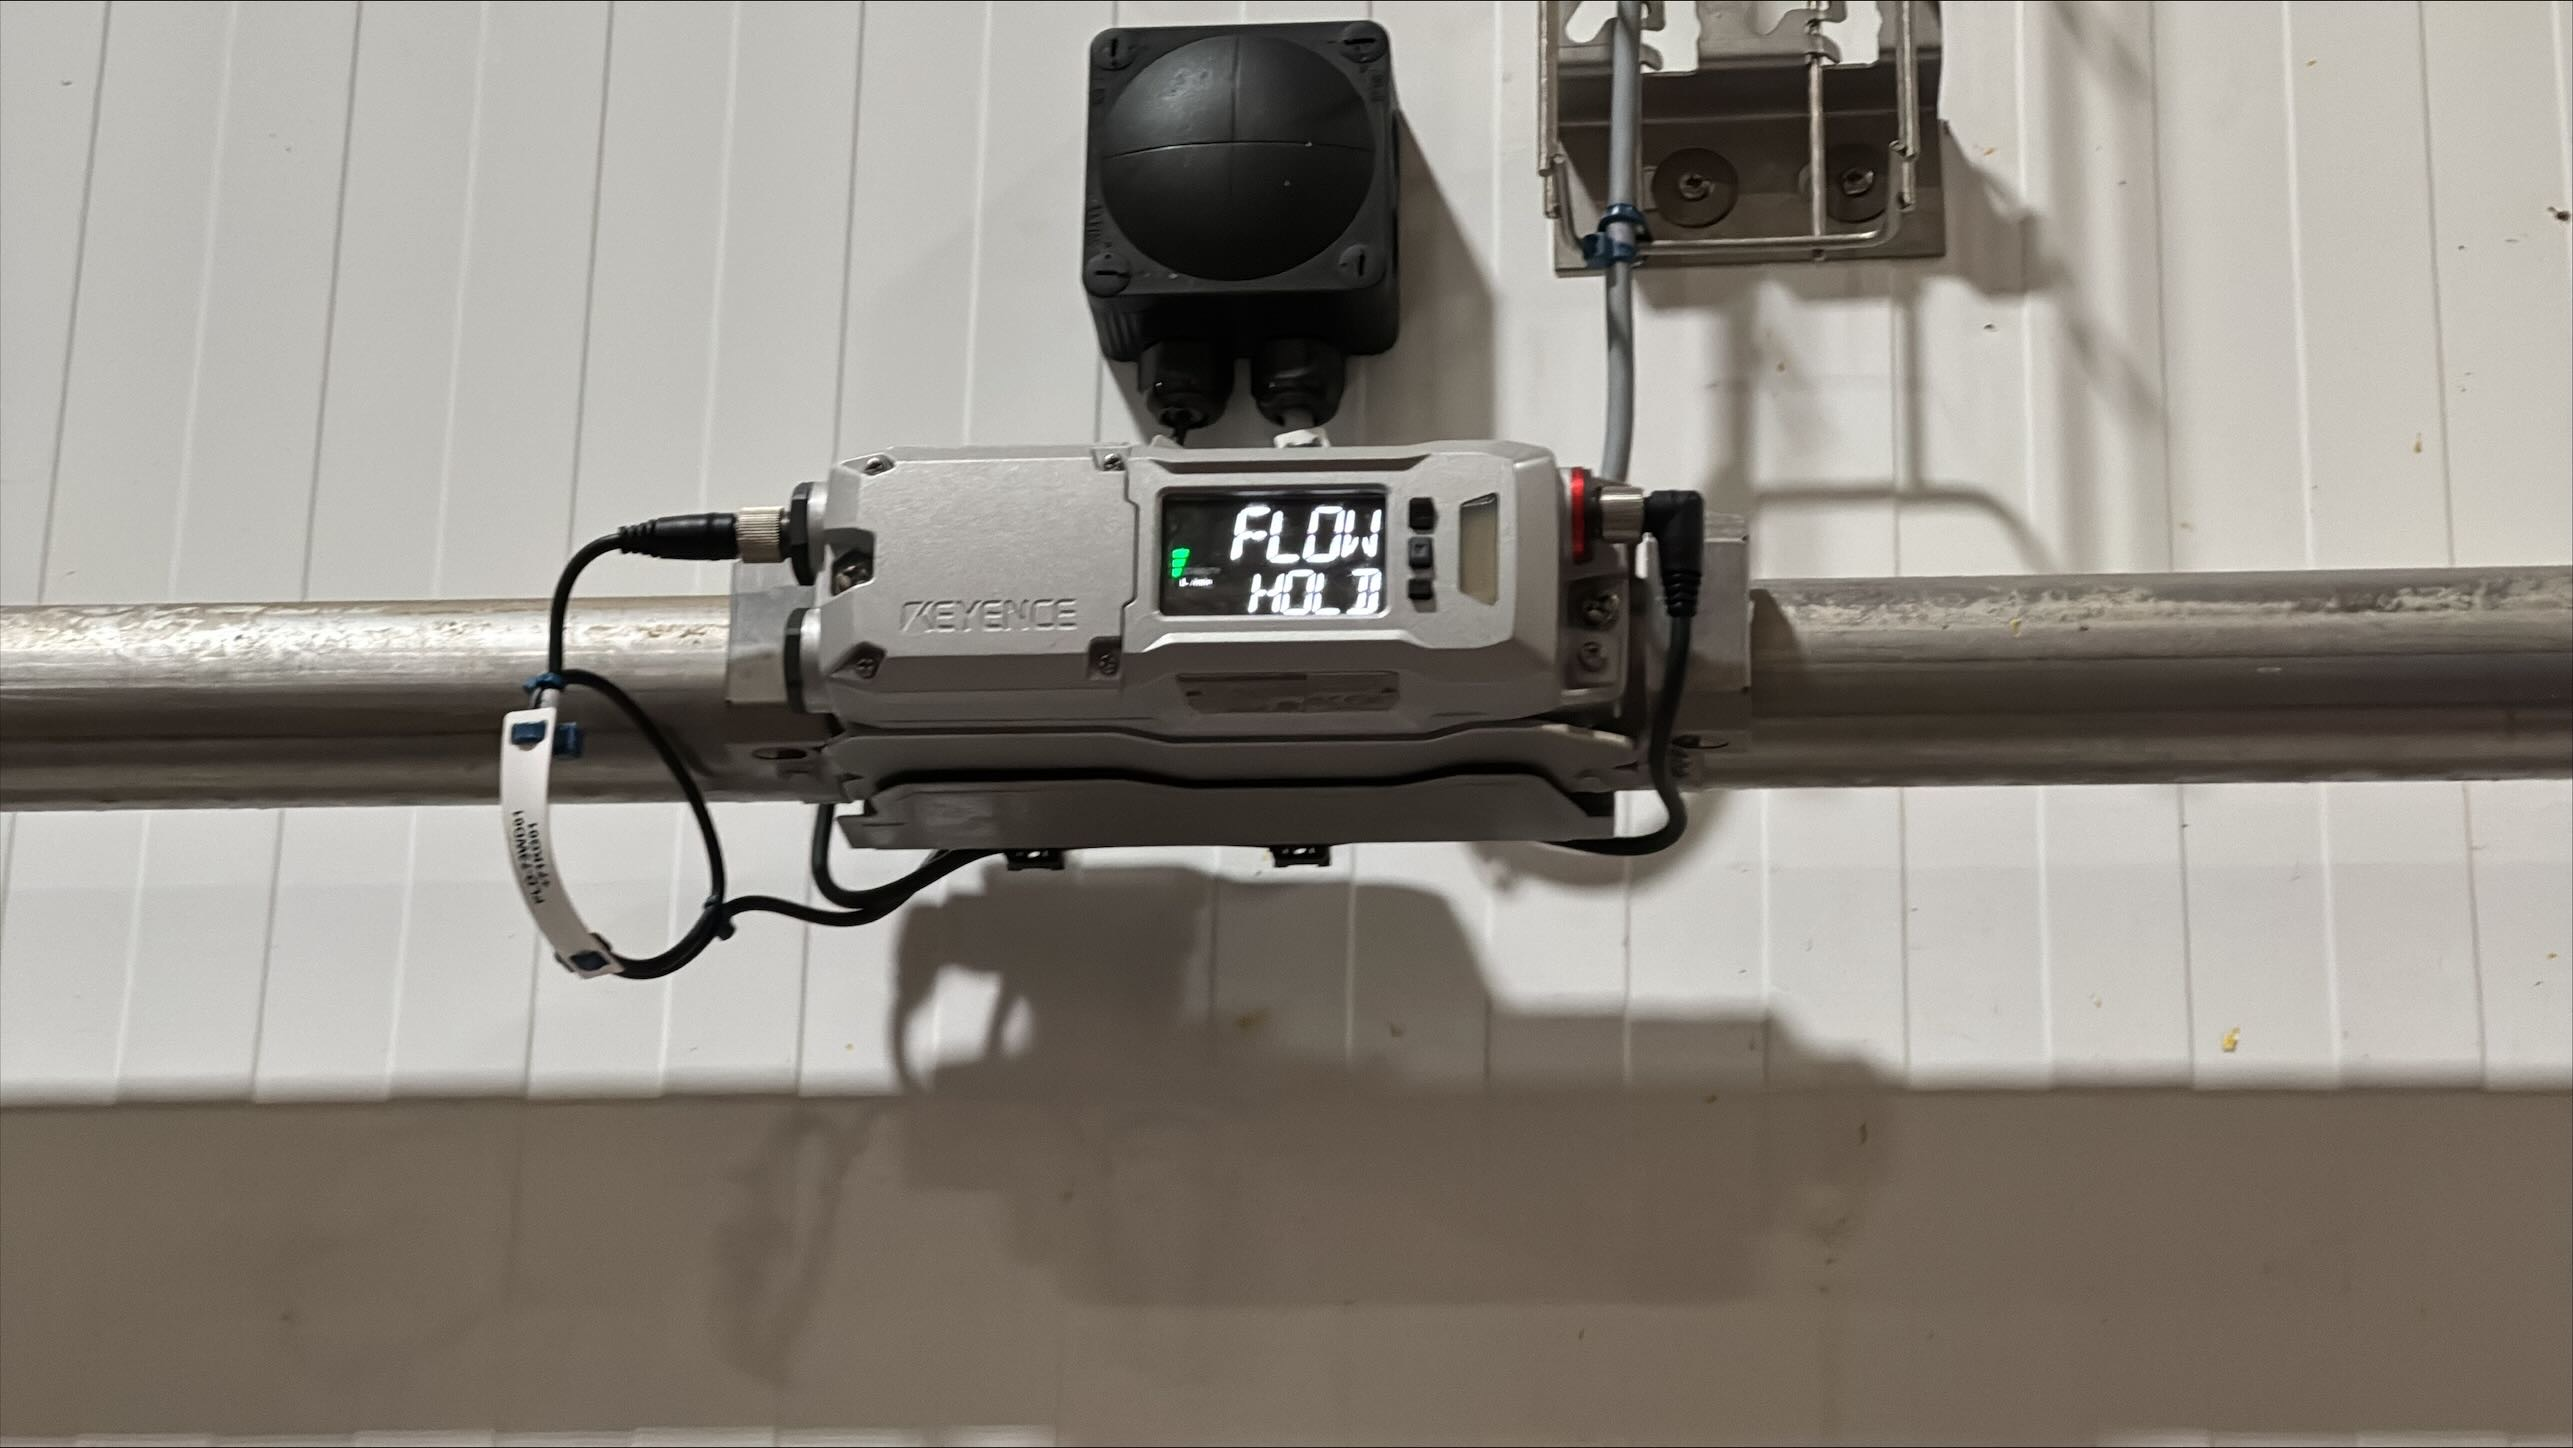
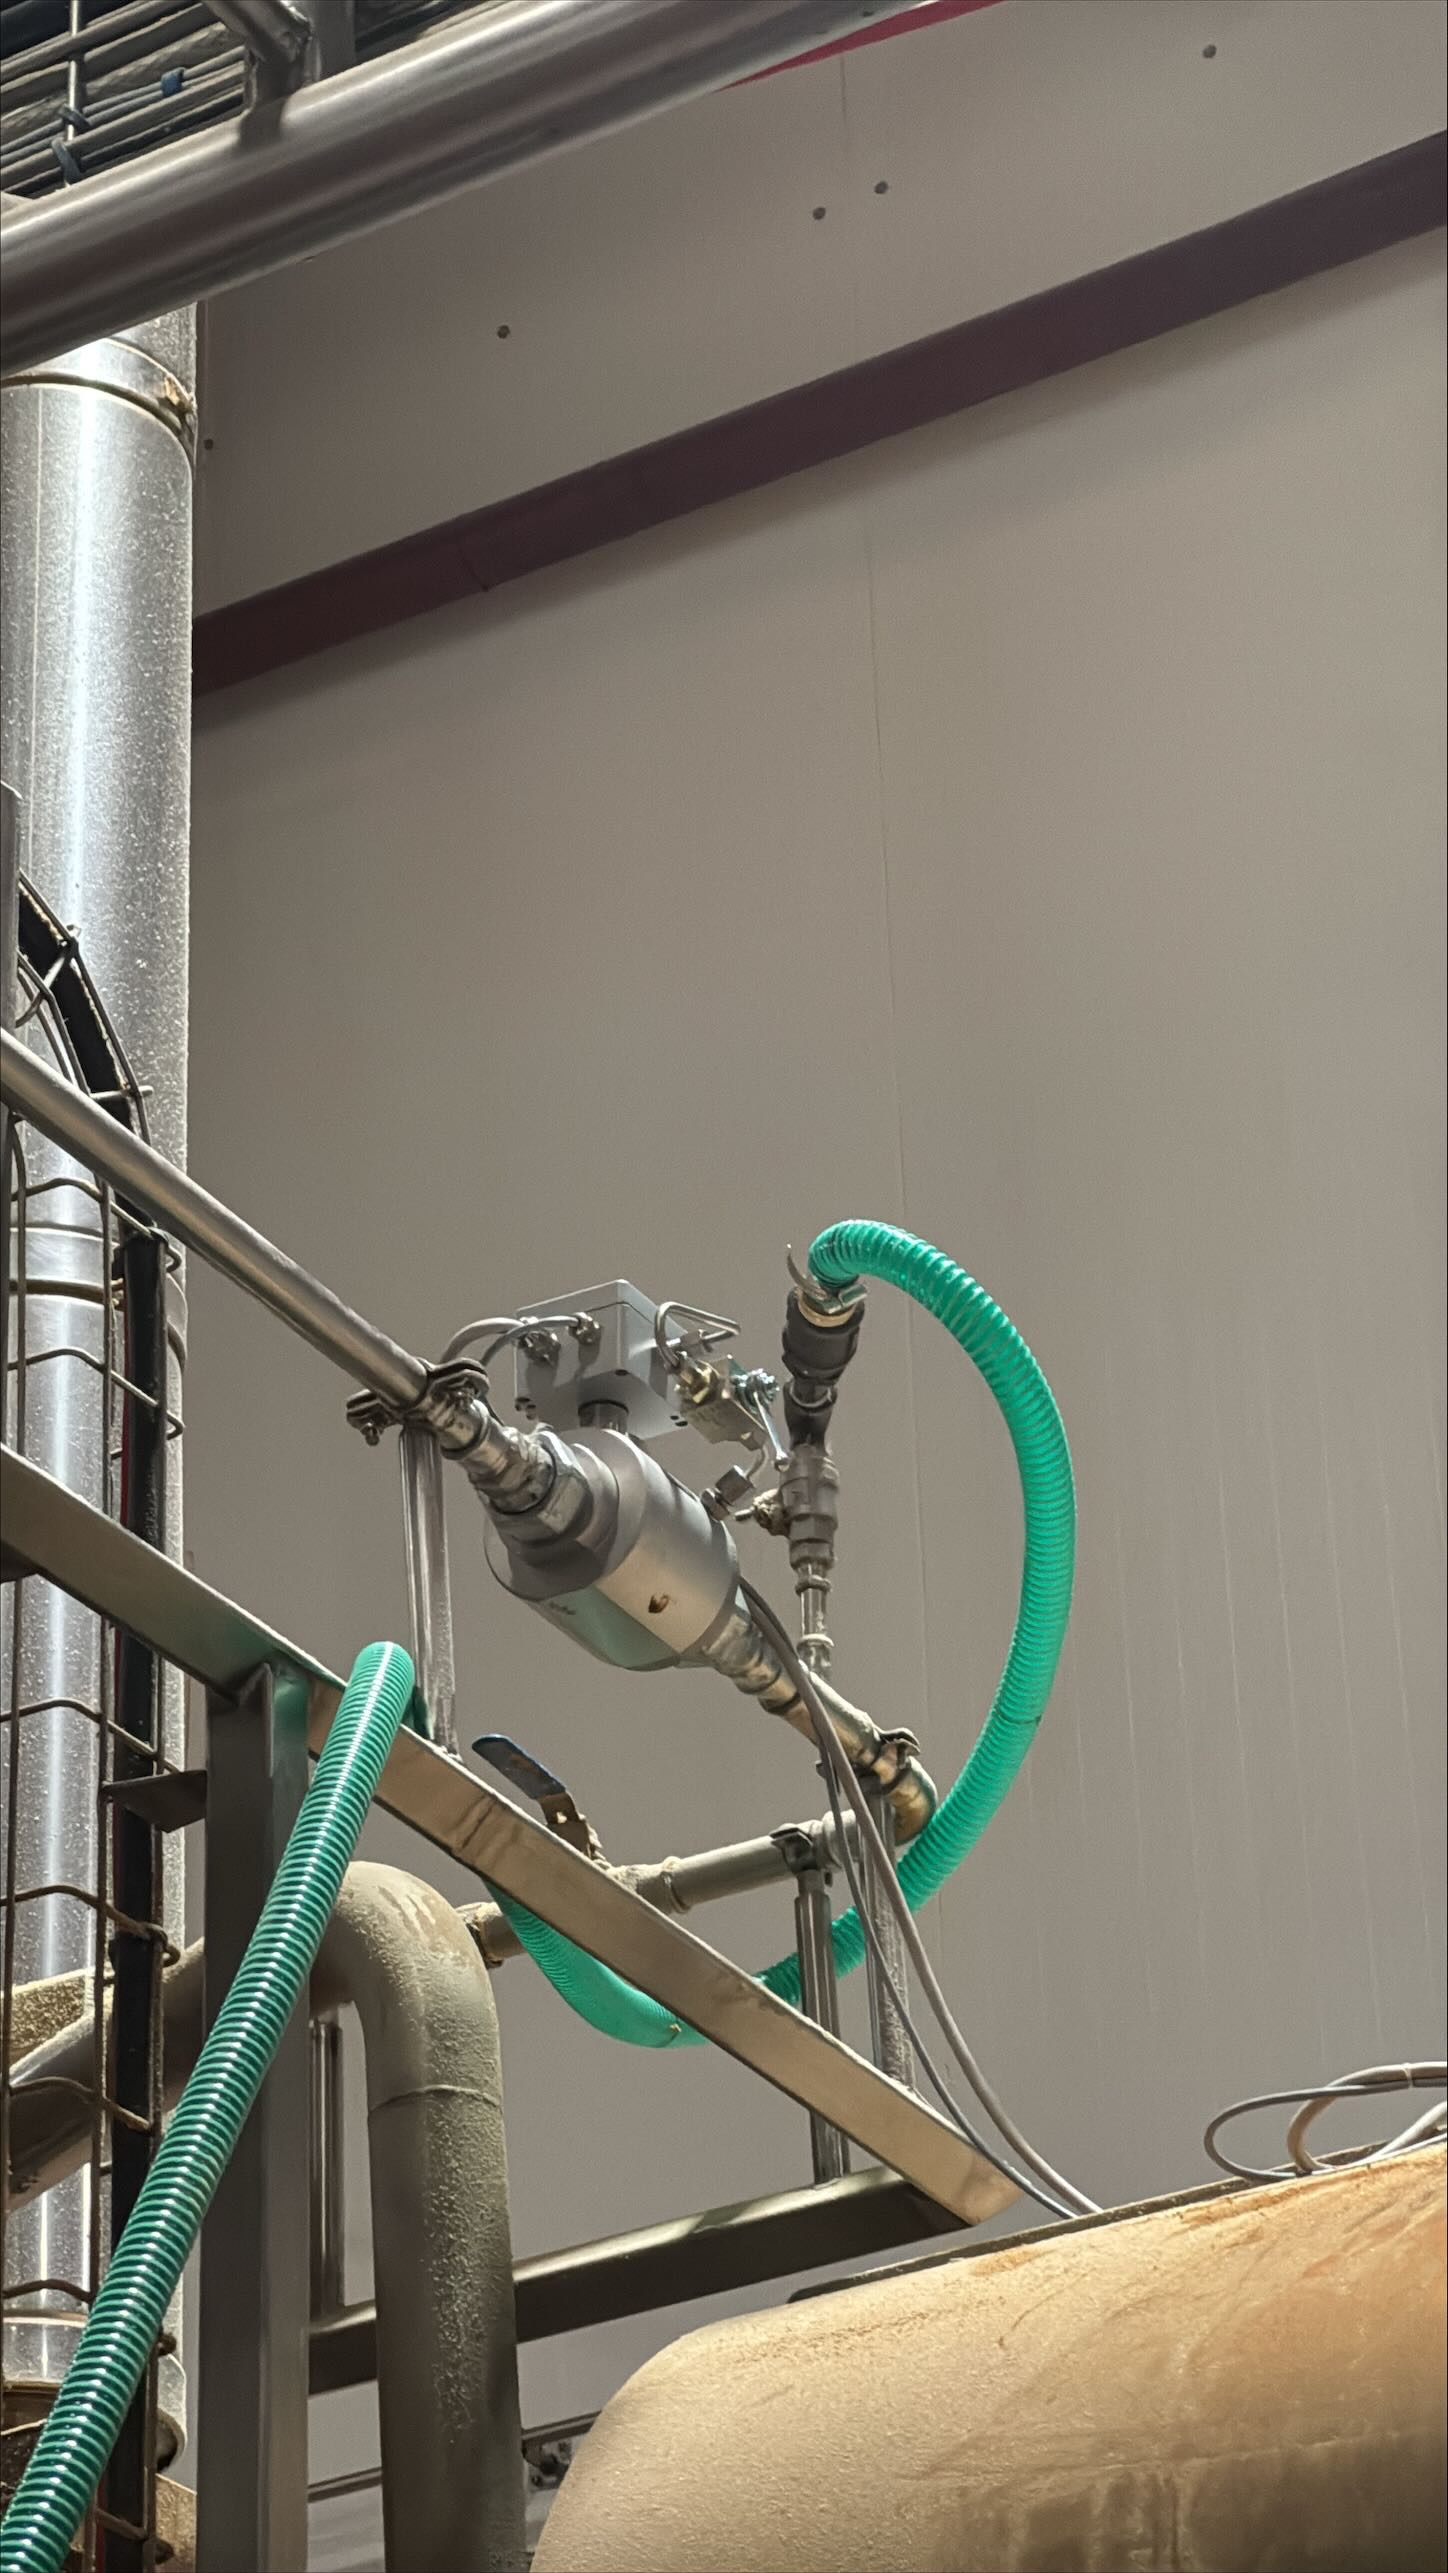
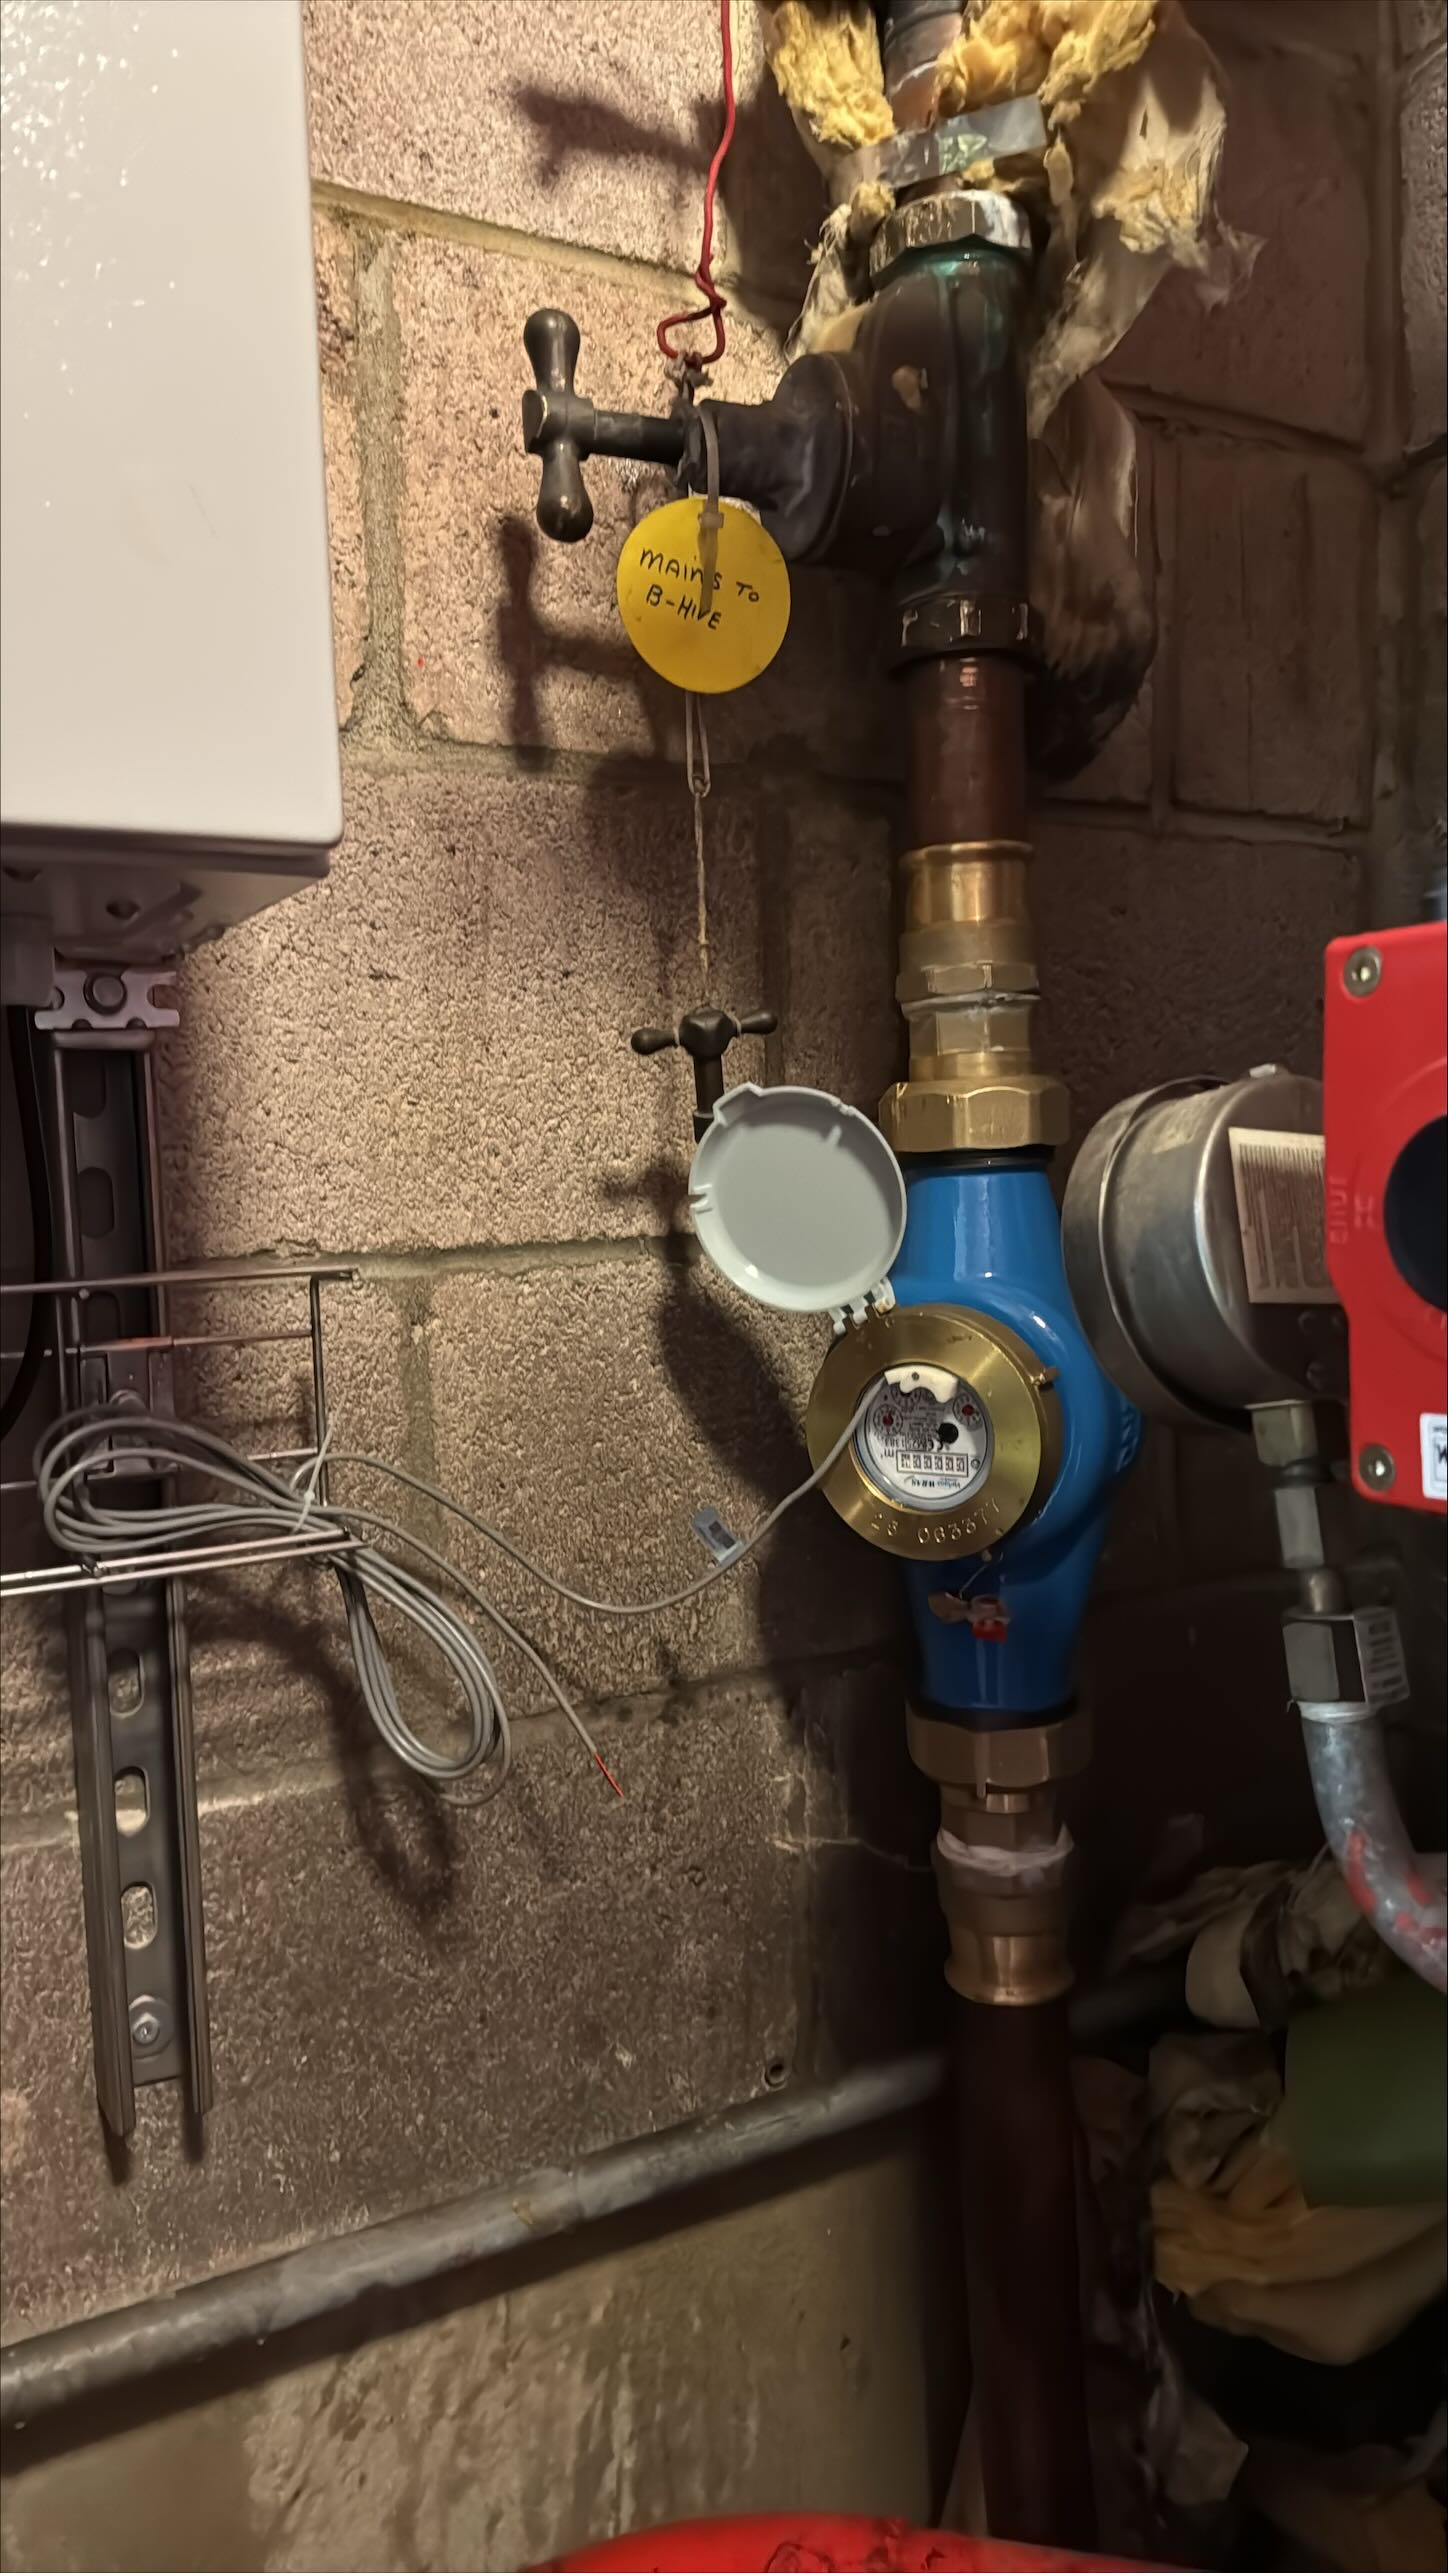
Engineer inspecting process equipment and gas infrastructure
Every Month Without Full Visibility
Is Money You Can't Get Back
A typical manufacturing facility wastes 15-25% of its total utility spend on inefficiencies invisible to basic monitoring. On a £500K annual bill, that's £75,000-£125,000 per year lost across gas, water, steam, and compressed air alone. Without production KPIs linking consumption to output, you cannot even identify which lines, shifts, or processes are driving the waste.
What's In
The Box
Hardware, software, and AI analytics — everything needed to see where every pound of utility spend goes and where it can be reduced.
- Gas metering
- Electrical metering
- Steam metering
- Water metering
- Compressed air metering
- Thermal energy measurement
- Oil flow metering
- Process instrumentation
- Read existing PLC data
- Extract industrial tags
- Connect legacy instrumentation
- Combine new & existing systems
- Protocol bridging (Modbus, OPC-UA, BACnet)
- Centralise datasets
- Secure cloud connectivity
- AI-powered energy analytics
- Real-time dashboards
- Consumption forecasting
- Anomaly detection & alerts
- ISO 50001 action tracking
- Industry-specific KPIs
- Multi-site corporate reporting
- CO2 scope I + II calculation
- Operational benchmarking
- AI-driven recommendations
- Enterprise scalability
Why Turnkey
Beats the Alternatives
Software-only tools monitor what you already have. Omni Vision installs what you are missing — and shows you exactly where money is being lost.
| Omni VisionTurnkey | Software-OnlySaaS Platforms | DIY In-HouseSelf-Build | |
|---|---|---|---|
| Hardware specified & installed | You source & install | ||
| PLC integration & data extraction | You build | ||
| AI-powered analytics | |||
| Single point of accountability | |||
| One contract, one invoice | |||
| Gas Safe certified installation | You arrange | ||
| Time to live dashboards | 8-16 weeks | Months (after you install hardware) | 6-12+ months |
| Ongoing AI optimisation | Limited |
Your Data Stays
Your Data
Read-only cloud architecture with zero plant control. Your operational technology is never at risk.
Omni Vision's architecture securely extracts selected industrial data and pushes it to the cloud platform. The cloud reads your data only — it cannot control your plant and cannot interfere with industrial operations.
All connections are encrypted, authenticated, and operate on a strictly one-way data model. No hardware connection is required — data is acquired through existing protocols (Modbus, OPC-UA, BACnet, MQTT).
Read-Only Cloud
The cloud platform cannot send commands to your plant equipment
Data Ownership
All industrial data remains your property — always
Encrypted Connections
All data transmission uses industry-standard TLS encryption
No Plant Interference
Zero impact on your existing OT systems and operations
Solutions Across
Industries
Full utility visibility and production KPI intelligence — tailored to your sector.
Manufacturing
- ·Production line energy tracking
- ·Cost-per-unit KPI mapping
- ·AI-driven savings identification
Utility Management
- ·Multi-utility metering & analytics
- ·Accurate billing & cost allocation
- ·Consumption forecasting
Pharmaceutical
- ·Cleanroom HVAC energy costs
- ·Energy per batch with audit trail
- ·GMP-safe read-only integration
Food & Beverage
- ·Refrigeration & steam cost visibility
- ·Energy cost per batch tracking
- ·AI flags waste before it compounds
Chemical Industry
- ·Utility costs per reactor & column
- ·Energy per batch & cost per tonne
- ·Scope I + II emissions auto-tracked
Energy Consumption
- ·Cross-utility consumption analysis
- ·AI finds waste audits miss
- ·Reduction target tracking
Environmental Monitoring
- ·Scope I + II auto-calculated
- ·Live permit limit dashboards
- ·Audit-ready regulatory reports
General Industry
- ·Connect any meter, sensor, or PLC
- ·Real-time custom KPI dashboards
- ·AI-driven savings identification
Request Your Free Assessment.
Zero Obligation. Zero Risk.
Frequently Asked Questions
Common questions about Omni Vision - the turnkey utility metering and production KPI intelligence platform.
Omni Vision meters all major utility streams — electricity, gas, water, steam, compressed air, oil, and thermal energy — but it does not stop there. We can connect to any process signal, sensor, PLC tag, or legacy instrument on your site. If it produces data, we can capture it, correlate it, and put it on your dashboard.
Yes. Every dashboard is tailored to the KPIs that matter to your operation and updated in real time. Energy per unit, cost per batch, utility intensity per shift, waste ratios, uptime metrics — whatever drives your decisions. We work with you to define the metrics, then build live custom dashboards that surface exactly the intelligence you need. No generic templates.
Yes. Scope I and II emissions are calculated automatically from metered fuel and electricity data. Because all utility streams are already captured, CO2 reporting comes built in — no additional setup or manual estimation required.
A typical single-site deployment from initial survey through to live dashboards with utility, CO2, and KPI tracking takes 8 to 16 weeks. Most installation work happens during planned shutdowns or off-peak periods. Multi-site rollouts are phased and accelerated through standardisation.
No. Omni Vision operates on a read-only basis. The integration layer extracts data from your existing PLCs, sensors, and meters without interfering with plant control systems. Your operational technology remains completely independent and unaffected.
Yes. Omni Vision includes middleware that bridges legacy industrial systems with modern cloud infrastructure. Data is extracted from older PLCs, analogue instruments, and legacy protocols alongside modern digital systems, combining everything into a unified dataset for AI analytics.
Omni Vision is a turnkey solution combining EnerTherm's field engineering with EPSA Energy's AI analytics platform: site survey, instrumentation sizing, control panel design and build, full M&E installation, PLC integration, connectivity to any on-site data source, commissioning, and custom KPI dashboards with CO2 tracking and ongoing AI analytics. One contract covers everything from meter to intelligence.
Capture Utilities.
Track CO2.
Map Every KPI.
Request a free assessment and see how Omni Vision gives you complete utility visibility and production KPI intelligence — including where your biggest savings opportunities are.
- Free site survey and utility gap analysis
- Map every utility stream to production KPIs
- See projected savings for your facility
- Turnkey hardware and AI analytics
- 8-16 weeks from survey to live intelligence