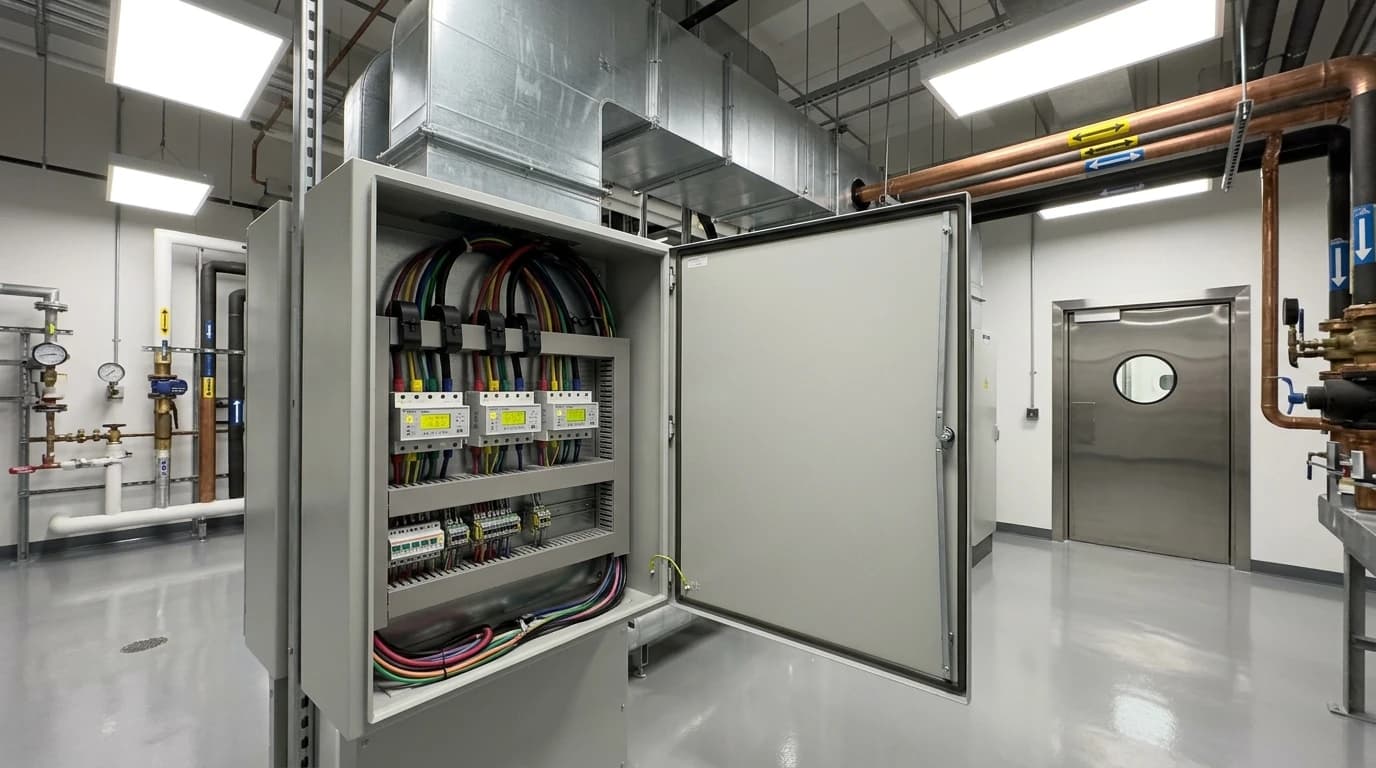
Industrial IoT Metering Cuts Cleanroom HVAC by 15-25%
Non-invasive IIoT tracking cuts HVAC energy, typically 50-80% of cleanroom consumption.
Industrial IoT energy metering for cleanrooms is a non-invasive digital measurement architecture that utilises secure IoT gateways and high-granularity physical sensors to continuously monitor the electricity, thermal loads, and utility consumption of controlled environments without altering validated heating, ventilation, and air conditioning (HVAC) configurations. By collecting real-time energy telemetry and mapping it against production parameters, this methodology identifies operational waste, allowing facility engineers to optimise HVAC operations. Implementing high-resolution utility monitoring allows pharmaceutical manufacturers to achieve energy consumption reductions of 15 to 25 per cent while maintaining strict Good Manufacturing Practice (GMP) standards.
What is Industrial IoT Energy Metering for Cleanrooms?
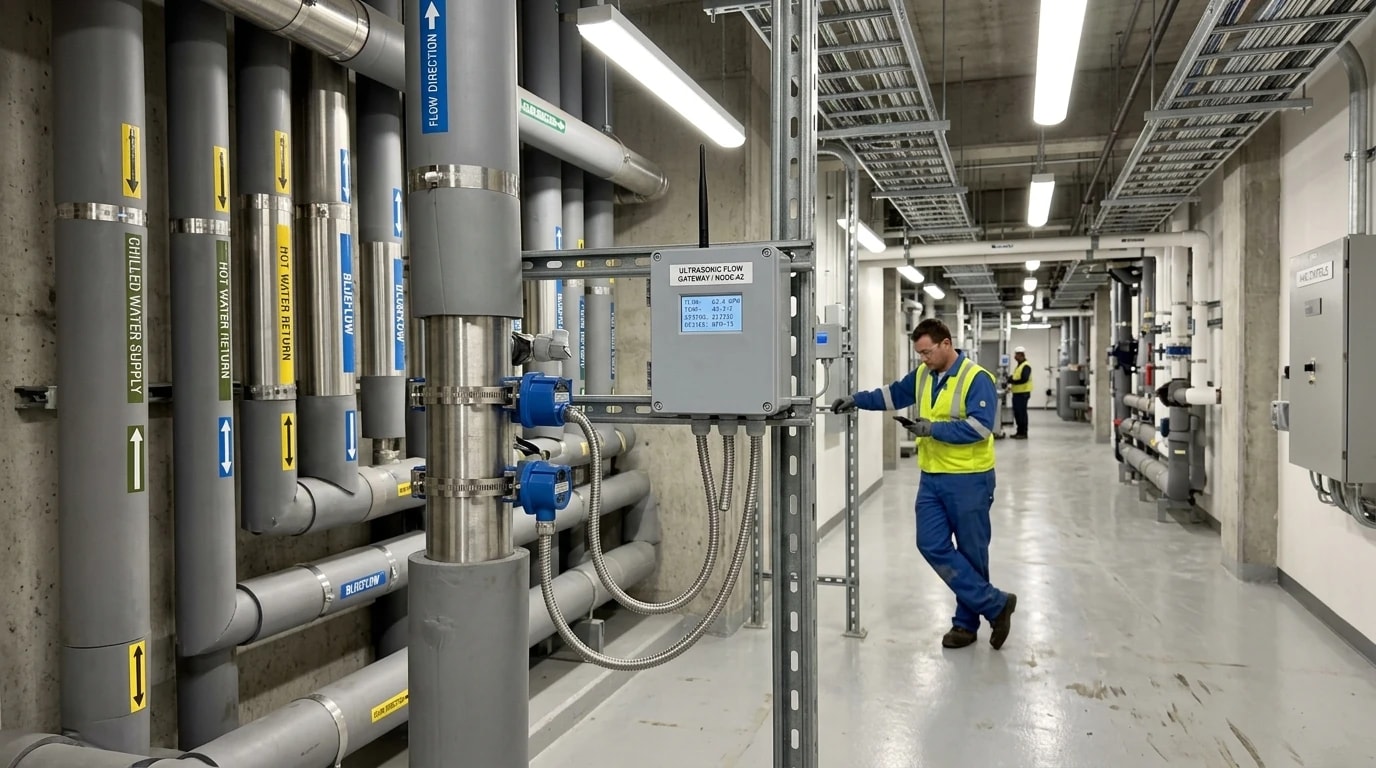
Industrial IoT energy metering for cleanrooms provides a scalable method to track and analyse utility usage across highly regulated environments. Historically, pharmaceutical facilities relied on manual monthly meter readings, which masked short-term demand spikes and structural inefficiencies. Modern industrial IoT (IIoT) architectures replace this fragmented approach with granular, continuous data streams from power meters, flowmeters, and thermal energy sensors.
Technical Definition and Core Components
An integrated IIoT metering setup incorporates hardware and software layers designed to capture utility data at the cleanroom boundary. Physical monitoring instruments, such as sub-meters for primary air handling units (AHUs), steam flowmeters for humidification, and chilled water temperature transmitters, form the hardware foundation. These devices transmit data via fieldbus protocols to an edge gateway, which translates and encrypts the telemetry.
The software layer aggregates these inputs to display energy intensity metrics. By mapping power usage against environmental variables like ambient external temperature and cleanroom occupancy, the system generates actionable operational intelligence.
The Pharmaceutical Cleanroom Energy Dilemma
Pharmaceutical manufacturing facilities operate with high energy demands due to the strict environmental parameters required for sterile product processing. Industry best practice guides for energy-efficient pharmaceutical manufacturing indicate that HVAC systems typically account for 50 to 80 per cent of total cleanroom energy consumption. This high energy intensity stems from the requirement to continuously run high-efficiency particulate air (HEPA) filtration, maintain large air change rates (ACH), control relative humidity, and preserve pressure differentials between adjacent rooms.
Because cleanrooms must operate 24 hours a day to prevent contamination, facility teams often maintain these systems at maximum design capacity regardless of actual process demands. This conservative operating strategy prevents contamination but introduces substantial energy waste, which IIoT monitoring is designed to isolate and eliminate.

Omni Vision delivers turnkey utility metering, CO2 tracking, and AI-powered production KPI intelligence — giving you real-time dashboards and actionable insights across your entire facility.
Non-Invasive Data Acquisition and MHRA Compliance
Maintaining compliance with the Medicines and Healthcare products Regulatory Agency (MHRA) is a primary consideration when integrating new monitoring hardware into an active pharmaceutical facility. The main challenge lies in acquiring utility data without triggering an extensive, costly re-validation process for computerised manufacturing systems.
Maintaining GAMP 5 System Classifications
The International Society for Pharmaceutical Engineering (ISPE) publishes the GAMP 5 framework (including the GAMP 5 Second Edition) to guide the validation of computerised systems in GxP environments. A configurable energy monitoring and analytics platform, such as the Omni Vision platform, is classified as GAMP 5 Category 4 (Configured Products).
Traditional automation retrofits that write commands back to manufacturing PLCs or process control networks require re-validating the underlying control loops. This process is complex and costly, as those systems typically fall under GAMP 5 Category 4 or Category 5 (Custom Applications) and require extensive software lifecycle documentation and long system shutdown periods.
To bypass these intensive re-validation barriers, modern energy intelligence systems utilise a non-invasive, read-only data acquisition model. Because the gateway cannot write to the PLC, the validated control logic of the manufacturing equipment remains completely untouched. The facility maintains its existing validation status for its process controls, while the standalone Category 4 monitoring network requires far simpler, less disruptive validation.
Read-Only Communication Protocols
To guarantee that physical cleanroom controls cannot be modified by the energy monitoring network, hardware installers deploy specific read-only protocols. Process engineers configure standard industrial gateways to pull data using:
- Modbus TCP/RTU: A standard protocol used to read electrical sub-meter registers without write capability.
- OPC-UA: A secure, platform-independent protocol configured with read-only client certificates.
- BACnet/IP: Used to extract environmental data from the building management system (BMS) with strict software-level write blocks.
These protocols establish a unidirectional data bridge. They ensure that even if the external cloud platform is compromised, no write commands can traverse the gateway to disrupt the active HVAC PLCs or cleanroom pressure cascades. This design aligns with the MHRA GxP Data Integrity Guidance (2018), which mandates strict security, attribution, and reliability controls for all manufacturing data streams.
| Protocol | Typical Application | Security Mechanism | GAMP Validation Impact |
|---|---|---|---|
| Modbus RTU | Sub-meter electrical telemetry | Physical wiring isolation | Minimal, read-only data |
| OPC-UA | PLC and process monitoring | Cryptographic certificates | Non-invasive, preserves classification |
| BACnet/IP | Building management systems | Software-level write disabling | No change to validated BMS logic |
| MQTT | Cloud gateway transmission | One-way TLS encrypted transport | External to GxP control boundary |
The Energy Impact of Cleanroom HVAC Systems
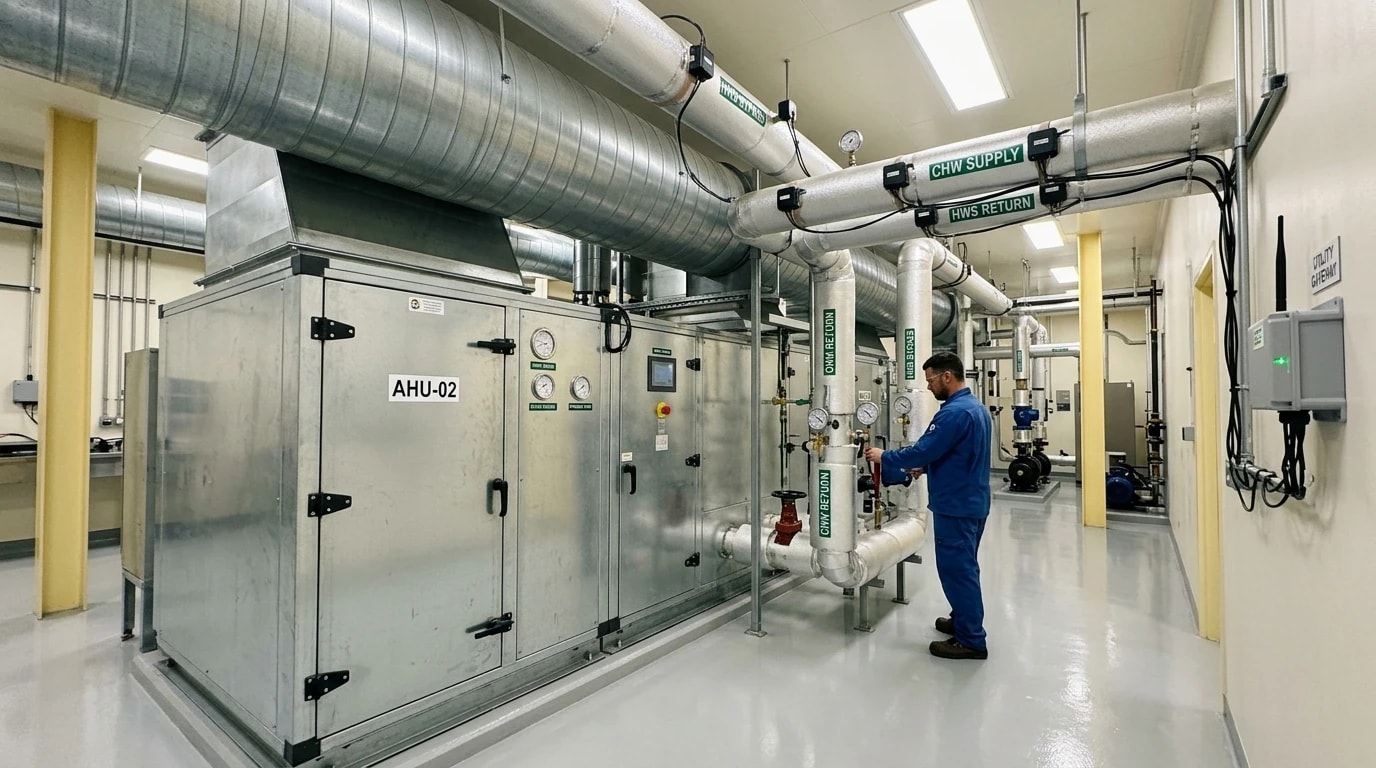
Understanding the relationship between cleanroom operations and energy usage requires a close look at the physics of air distribution. HVAC fans consume energy relative to the volume of air they move, and even minor adjustments to fan speeds yield significant power savings.
The Fan Law Relationship
The power required to drive a centrifugal fan is proportional to the cube of the volumetric flow rate. In cleanrooms, the air change rate directly determines this volumetric flow rate. The relationship between fan power (P) and the air change rate (ACH) is governed by the fan affinity laws:
P2=P1×(ACH1ACH2)3where:
- P1 is the initial fan power consumption in kW,
- P2 is the reduced fan power consumption in kW,
- ACH1 is the initial air change rate per hour,
- ACH2 is the optimised air change rate per hour.
Because of this cubic relationship, reducing the air change rate by a small margin produces a disproportionately large reduction in fan power. For example, if a cleanroom engineer safely reduces the air change rate from 40 ACH to 32 ACH during non-operational periods (a decrease of 20 per cent), the power required by the fan drops by approximately 48.8 per cent.
Without granular IIoT monitoring, however, engineers lack the real-time data needed to verify that airborne particulate levels remain compliant during these reduced flow periods, forcing them to run fans at maximum speeds continuously.
Quantifying the 15 to 25 Per Cent Savings Potential
When industrial IoT energy metering for cleanrooms is deployed, it continuously calculates the energy signatures of the primary AHUs. By combining this energy data with real-time pressure, temperature, and relative humidity readings, the platform uncovers structural inefficiencies. These typically include:
- Simultaneous Heating and Cooling: Instances where the AHU is overcooling air to dehumidify it, and subsequently overheating it to meet zone temperature set points.
- Filter Static Pressure Overload: Identifying loaded HEPA filters that force fans to work harder, allowing maintenance teams to schedule cleanroom filter changes based on energy performance rather than arbitrary calendar schedules.
- Excessive Fresh Air Intake: Highlighting opportunities for operators to safely adjust the ratio of recirculated air to fresh air based on actual carbon dioxide and chemical volatile organic compound (VOC) levels, rather than operating at worst-case design thresholds.
By resolving these hidden faults, pharmaceutical manufacturing plants consistently reduce their overall cleanroom HVAC energy bills by 15 to 25 per cent, resulting in rapid payback periods for the metering installation.

Track energy consumption, emissions, and process parameters with seamless PLC/SCADA integration via Modbus, OPC-UA, and MQTT protocols.
Safeguarding ISO 14644 Compliance During IIoT Integration
While saving energy is a key priority, pharmaceutical manufacturers must never compromise cleanroom compliance. The installation and operation of any energy monitoring platform must not interfere with the physical parameters defined by international cleanroom standards.
Non-Disruption of ISO 14644-1 Cleanroom Classifications
ISO 14644-1:2015 defines cleanroom classifications based on the maximum allowable concentration of airborne particles per cubic metre of air. For instance, an ISO 5 environment (equivalent to EU GMP Grade A or B at-rest) must not exceed 3,520 particles of size ≥0.5 μm per cubic metre.
Integrating IIoT monitoring hardware must not disrupt these particulate thresholds. Non-invasive current transducers (CTs) and clamp-on thermal sensors are ideal because they attach to the exterior of electrical cables and utility piping. This avoids cutting into pipes or opening electrical enclosures inside the cleanroom boundary, preventing the release of construction debris or metallic particles that would invalidate the classification.
Preserving ISO 14644-3 Testing Methods and Recovery Times
ISO 14644-3:2019 specifies the test methods used to verify cleanroom performance, including airflow direction tests, pressure differential tests, and cleanroom recovery tests. The cleanroom recovery test is particularly important; it measures the time required for a cleanroom to return to its target cleanliness level after being subjected to a controlled particulate challenge.
If facility teams implement an energy optimisation programme that dynamically adjusts fan speeds during non-production hours, they must do so without compromising this recovery time. High-resolution IIoT metering monitors cleanroom behaviour during these transitions, allowing engineers to validate that the HVAC system can ramp back up to full operational flow and recover the required cleanliness classification well before production staff enter the zone. This data-driven approach replaces arbitrary safety factors with verified empirical performance profiles.
Designing a GMP-Compliant Industrial IoT Energy Metering Architecture
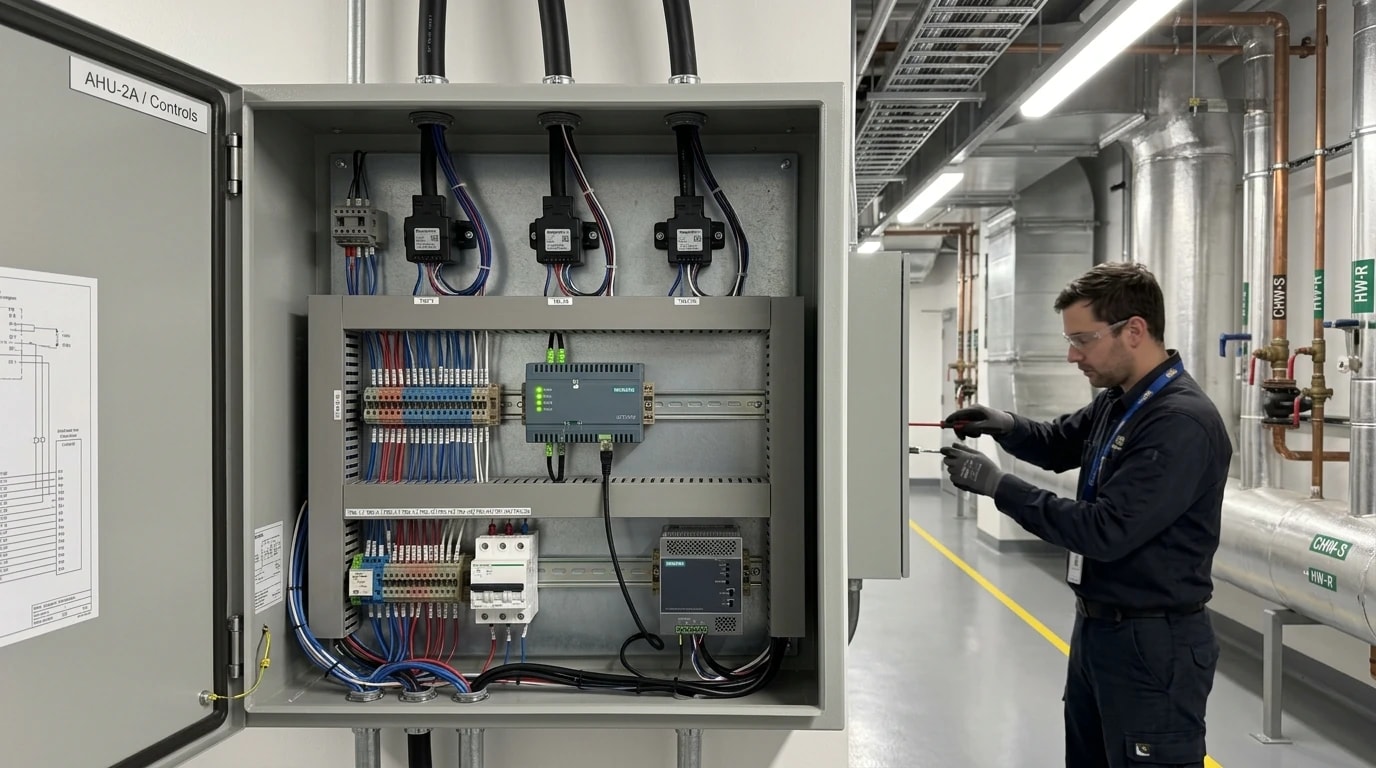
A GMP-compliant IIoT architecture must be designed to satisfy both energy analysts and QA directors. This requires a clear separation between the validated cleanroom control systems and the data analysis network.
One-Way Data Flow and Cyber Security
To guarantee network security, the external communication pipeline operates strictly as a one-way system. On-site edge gateways harvest telemetry from field sensors but reject all incoming remote connections from the internet. The gateway encrypts and packages this utility data, transmitting it to the cloud-based analytics engine via MQTT using Transport Layer Security (TLS).
With zero write-access to the local process network, this unidirectional pipeline ensures that external cloud-level analysis cannot feed back any commands to the cleanroom controls. This architecture keeps the validated manufacturing boundary isolated, aligning with UK and EU cyber security frameworks.
Granular Monitoring of Six Core Utility Streams
Comprehensive energy intelligence requires monitoring all primary utility streams rather than just electrical power. A complete facility analysis tracks:
- Electricity: Measuring power consumption of compressor motors, fans, and chillers to evaluate mechanical efficiency.
- Steam: Monitoring mass flow rates for clean steam humidification, which is a major driver of boiler fuel consumption.
- Chilled Water: Calculating thermal energy transfers across cooling coils to spot fouling or heat exchanger inefficiencies.
- Compressed Air: Detecting air leaks within automated packaging or product transfer lines.
- Hot Water / Gas: Tracking the thermal energy used in post-heating cycles within the AHUs.
- Process Water: Monitoring water-for-injection (WFI) and purified water generation systems to identify opportunities for optimising thermal sanitisation cycles.
Implementing the Omni Vision Energy Intelligence Platform
The Omni Vision Energy Intelligence Platform provides a structured path for pharmaceutical manufacturers to move from manual spreadsheets to automated, compliant energy management.
Standardised Turnkey Deployment Model
The platform is delivered via a standardised deployment model, typically completed over an 8 to 16 week timeline. This structured process ensures minimal disruption to active manufacturing schedules:
- Weeks 1-4: Site Survey and Engineering Design: Detailed identification of all cleanroom utility boundary points, existing sensor locations, and GAMP system classifications.
- Weeks 5-8: Hardware Installation: Mounting of non-invasive sub-meters, flow sensors, and edge gateways. All physical connections are designed to preserve ISO 14644-1:2015 and ISO 14644-3:2019 parameters.
- Weeks 9-12: Network Commissioning: Establishing the read-only, encrypted data pipelines and configuring one-way communication protocols.
- Weeks 13-16: Dashboard Activation and Training: Configuring energy dashboards, setting up automated alerts, and training plant operators on predictive energy tracking.
This rapid implementation strategy delivers a fully operational intelligence platform with a typical return on investment (ROI) of under 12 months.
AI-Driven Anomaly Detection and Batch-Level KPIs
Once operational, the platform processes incoming telemetry using cloud-based AI analytics. The software automatically establishes baselines for each cleanroom zone based on external weather, production scheduling, and product types.
If a fan motor begins drawing more power than expected, or if a steam valve sticks open during dehumidification, the AI engine flags this anomaly immediately. This allows maintenance teams to fix faults before they trigger a cleanroom deviation report.
Furthermore, by integrating production scheduling data, the platform links energy usage directly to specific manufacturing batches. It calculates production-specific key performance indicators (KPIs), such as energy per batch or utility cost per vial.
This level of transparency helps quality assurance directors and operations managers align their sustainability initiatives with active manufacturing goals, proving that energy efficiency and GMP compliance can be achieved together.
This article reflects the independent analysis and editorial opinion of EnerTherm Engineering. Product names, trademarks, and brands mentioned belong to their respective owners. EnerTherm Engineering is not affiliated with, endorsed by, or a licensee of any third-party software or product mentioned unless explicitly stated.

Technical Manager — EnerTherm Engineering
John Naranjo is Technical Manager at EnerTherm Engineering, bringing specialist expertise in chemical and environmental engineering. He recently led the implementation of Omni Vision, EnerTherm's real-time energy and utility monitoring platform. He holds an MSc in Environmental Engineering from the University of Huelva and a BSc in Chemical Engineering, with memberships in both the Energy Institute and IChemE.
