Pharma Plants Turn Scope 1 and 2 Data Audit-Ready
Granular utility data supports SECR, ESOS and CDP-ready emissions reports.
The Environment Agency has set 5 December 2027 as the compliance notification deadline for ESOS Phase 4. A Phase 3 annual progress update falls due on 5 December 2026 for qualifying organisations that submitted an action plan. For pharmaceutical manufacturers, those dates sharpen the focus on plant-level energy and carbon data.
Scope 1 and 2 carbon reporting in pharmaceutical manufacturing often begins with invoices, meter readings and spreadsheets. That can produce a year-end number, but rarely a clear audit trail. A sustainability lead may explain total gas consumption, then face questions from an auditor, finance team or CDP reviewer: how was the figure collected, which production areas does it cover, which conversion factor was used, and did the reporting boundary change during the year?
The answer needs to sit in the data, not in an employee’s memory or an archived email trail.
Pharmaceutical sites face a particular challenge. Cleanroom HVAC, steam generation, chilled water, compressed air, purified-water systems and batch production can create substantial, variable utility demand. Consumption also changes with campaigns, product mix, shutdowns and qualification activity. Carbon reporting must reflect that operating reality without disrupting validated systems or creating a manual process that quality and engineering teams cannot trust.
What Scope 1 and 2 carbon reporting covers in pharmaceutical plants
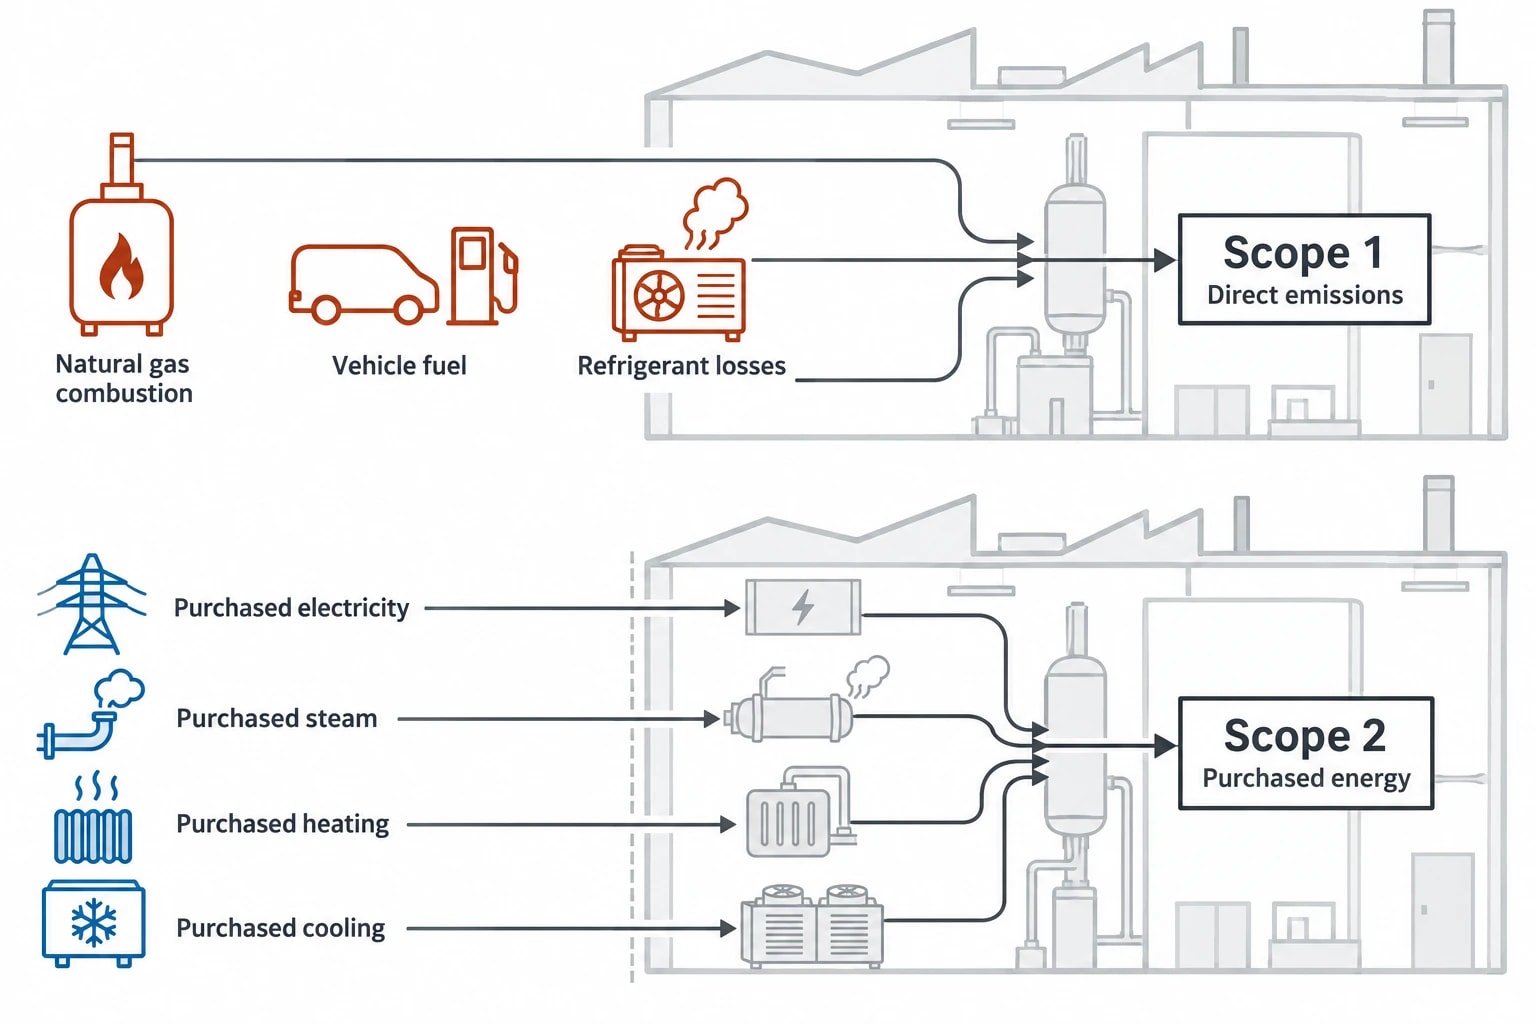
Scope 1 emissions are direct emissions from sources owned or controlled by the reporting organisation. In a pharmaceutical plant, these can include natural gas burned in boilers, furnaces and thermal-oil systems; fuel used in company-controlled vehicles; and fugitive refrigerant emissions from cooling equipment.
Scope 2 emissions arise from purchased or acquired electricity, steam, heating and cooling consumed by the reporting organisation. Electricity used by air-handling units, chillers, cleanroom fans, pumps, compressors, process skids and laboratory services commonly dominates this category at UK pharmaceutical sites.
The GHG Protocol distinguishes these categories because their emissions sources, data requirements and reduction measures differ.
Direct fuel use needs site-level evidence
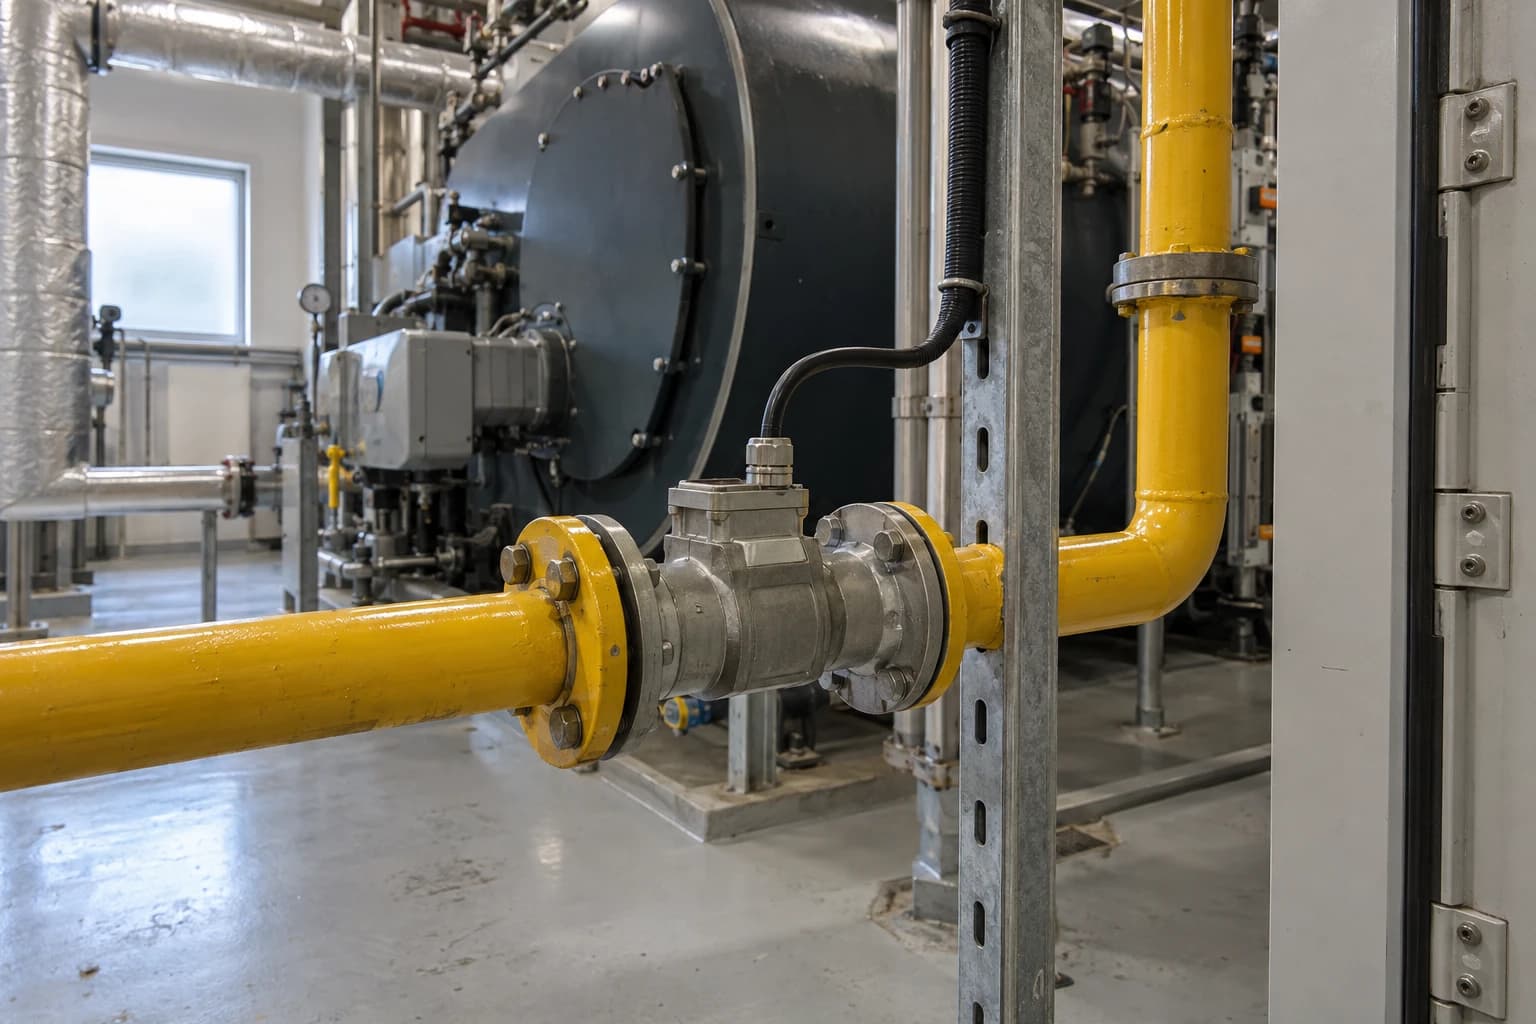
Gas invoices provide a useful financial record, but may not show how fuel use divides between steam generation, comfort heating, thermal processes and standby plant. That distinction matters when a site needs to explain an intensity increase or support an energy-efficiency narrative under the Streamlined Energy and Carbon Reporting framework.
Sub-metering of boiler gas, fuel oil and major thermal loads improves completeness and investigation. It can show whether a year-on-year change arose from higher production, changed boiler operation, a prolonged commissioning period or a data-quality issue.
Refrigerant data needs equal care. Emissions may be smaller than purchased-electricity emissions in some facilities, yet a refrigerant loss can be material because of its global-warming potential. Maintenance records, leak reports, refrigerant top-up logs and asset registers should sit within the Scope 1 evidence set.
Purchased energy must follow a consistent boundary
Scope 2 reporting requires a defined organisational boundary and a complete list of energy supplies within it. This can be difficult where a pharmaceutical group operates leased laboratories, distribution spaces, secondary manufacturing buildings or multi-tenant campuses.
A plant inventory should record each supply point, utility type, billing account, physical location, accountable site owner and reporting treatment. It should also identify whether electricity, heat, steam or cooling is purchased directly or supplied through a landlord or another group entity.
The reporting team should document any estimation method used for incomplete intervals. Estimated data may be necessary during a meter failure or supplier-data delay, but should be labelled, approved and replaced with actual readings where possible.

Omni Vision delivers turnkey utility metering, CO2 tracking, and AI-powered production KPI intelligence — giving you real-time dashboards and actionable insights across your entire facility.
SECR makes methodology and intensity visible
Streamlined Energy and Carbon Reporting applies to quoted companies and to large unquoted companies and limited liability partnerships that meet the relevant size thresholds, unless an exemption applies. Quoted companies disclose global energy use and greenhouse-gas emissions. Large unquoted companies and LLPs disclose UK energy use and associated emissions.
For in-scope organisations, SECR requires more than an annual carbon total. The Directors’ Report must include energy use, associated greenhouse-gas emissions, at least one intensity ratio, a narrative of energy-efficiency action taken during the reporting year, and the methodology used to calculate the disclosures.
Choose intensity metrics that reflect pharmaceutical output
An intensity metric makes energy and emissions figures meaningful. A site with a higher annual electricity total may have improved operational performance if output rose by a greater proportion. The reverse can happen when cleanroom ventilation, utilities or a process asset consumes heavily during a low-throughput period.
Suitable pharmaceutical metrics depend on the operation and should remain consistent enough to support year-on-year comparison. Examples include:
- kWh per batch released
- kWh per tonne of product
- kg CO₂e per thousand packs produced
- kWh per operating hour for a utility plant
- kg CO₂e per square metre for sites dominated by laboratories or controlled environments
A single group-wide ratio can conceal useful information. Manufacturing, R&D and warehousing often have different energy profiles and should be assessed separately where that provides a clearer explanation.
Keep the method stable, then disclose change
The carbon figure is only as defensible as its calculation method. Reporting teams need a controlled record of organisational boundaries, emission sources, meter references, units, conversion factors, data substitutions and calculation approvals.
The Department for Energy Security and Net Zero publishes annual greenhouse-gas conversion factors for company reporting. Using the correct reporting-year factor set and retaining it with the calculation record prevents a common error: recalculating historic emissions with a newer factor without explaining the restatement.
If a company changes its reporting boundary, acquires a site, changes a meter configuration or corrects a material historic error, it should record the decision and assess whether comparative figures need restatement. Clear treatment of change protects the trend line presented to directors and external stakeholders.
ESOS Phase 4 raises the standard for energy evidence
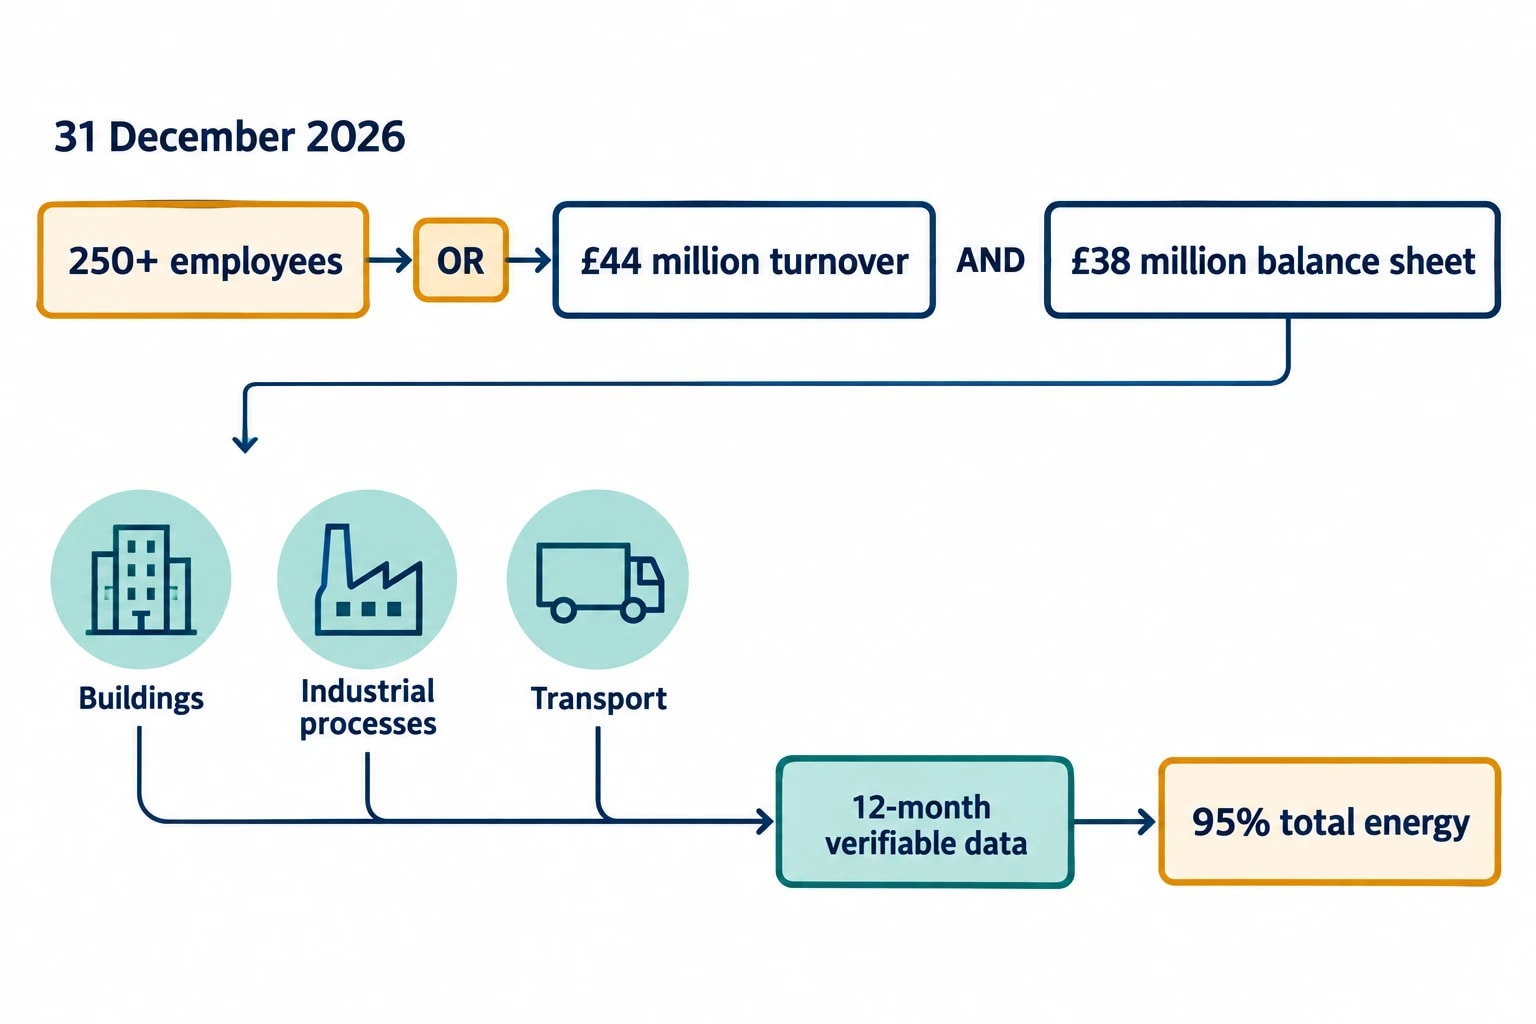
ESOS is a mandatory energy-assessment scheme for large UK undertakings and groups. An organisation qualifies for ESOS Phase 4 if, on 31 December 2026, it has 250 or more employees, or annual turnover above £44 million and an annual balance-sheet total above £38 million.
The scheme requires an assessment of energy used by buildings, industrial processes and transport. Areas of significant energy consumption must account for at least 95% of total energy consumption. For a pharmaceutical manufacturer, the ESOS evidence pack needs a reliable view of utility and process energy, not a broad annual estimate.
The evidence pack should be built continuously
An ESOS energy audit must, so far as reasonably practicable, rely on verifiable energy-consumption data measured over a 12-month period. Site visits, analysis of consumption and efficiency, and identified energy-saving opportunities form part of a compliant assessment.
Waiting until the final months before an ESOS deadline creates avoidable gaps. A continuous evidence process can retain:
- interval and cumulative meter data
- supplier bills and reconciliation records
- meter commissioning and maintenance records
- site and utility asset registers
- production or batch data used for intensity metrics
- calculation files and conversion-factor records
- energy-saving opportunity assessments
- evidence of implemented measures and achieved savings
- management and board sign-off records
Phase 4 requires participants to report progress against action-plan commitments, describe implemented measures and report achieved energy savings. The assessment must also identify proposed measures that were not implemented and explain why. This shifts reporting from a periodic audit exercise towards an operating record of energy management.
ISO 50001 can reduce ESOS burden, but only with adequate coverage
ISO 50001 provides a structured energy-management framework. Under the Phase 4 rules, ISO 50001 certification covering at least 95% of total energy consumption can satisfy ESOS requirements without an ESOS report or lead assessor.
That route still depends on sound measurement. A certificate cannot compensate for uncertain boundaries, missing supply data or production KPIs that cannot be traced to source records.
Audit-ready reporting starts with traceable activity data
Audit-ready does not mean every value is manually checked at year-end. It means an independent reviewer can trace a reported number from the disclosure through the calculation, source data and governance controls.
ISO 14064-1:2018 specifies requirements for designing, developing, managing, reporting and verifying an organisation’s greenhouse-gas inventory. Its emphasis on transparency, consistency, completeness, relevance and accuracy provides useful discipline for pharmaceutical carbon reporting.
Build a data hierarchy before year-end
A reporting team should define the preferred source for each utility stream. Direct meter readings may be the primary record, supplier data the reconciliation source, and engineering estimates the final fallback. The hierarchy should explain who approves exceptions and how the team flags them.
| Reporting element | Preferred evidence | Audit question answered |
|---|---|---|
| Purchased electricity | Half-hourly or interval metering, reconciled to invoices | Is consumption complete and assigned to the correct site? |
| Boiler fuel | Fiscal or dedicated gas meter, invoices and boiler records | Does the reported Scope 1 figure match fuel consumed? |
| Purchased steam or cooling | Supplier invoice, meter data and contract record | Has purchased energy been classified as Scope 2? |
| Refrigerants | Asset register, maintenance logs and top-up records | Has fugitive Scope 1 emissions been captured? |
| Production intensity | Manufacturing execution, batch or release records | Does the denominator match the reporting period? |
| Emission factors | Controlled factor register and calculation file | Which factor set was used, and why? |
This approach avoids blending raw readings, estimates and financial consumption figures into one opaque spreadsheet total.
Reconcile routinely, not annually
Monthly reconciliation is the fastest way to find an omitted meter, a reversed export register, a sudden data gap or a mismatch between supplier invoices and site telemetry. It also allows facility directors to investigate operational changes while records and personnel remain available.
For a regulated plant, the process should specify ownership at each stage. Engineering may own meter availability. Finance may validate invoice totals. Sustainability may own calculation rules. Quality may advise on systems connected to validated environments. A documented responsibility matrix reduces the risk that a discrepancy remains unresolved because each team assumes another function owns it.

Track energy consumption, emissions, and process parameters with seamless PLC/SCADA integration via Modbus, OPC-UA, and MQTT protocols.
Scope 2 requires care with electricity claims
The GHG Protocol Scope 2 Guidance covers emissions from purchased or acquired electricity, steam, heat and cooling. It describes location-based and market-based calculation methods for organisations operating in markets where contractual instruments and supplier-specific data are available.
The location-based method reflects grid-average emission factors for the location where energy is consumed. The market-based method uses qualifying contractual instruments or supplier-specific information. Organisations following the GHG Protocol should report the approach transparently and retain evidence supporting any market-based claim.
Avoid treating contracts as a substitute for consumption data
An energy contract can support a market-based Scope 2 calculation, but does not prove how much energy a site consumed. A defensible disclosure needs both measured or reconciled activity data and documentation for the contractual instrument or supplier factor.
Reporting teams should keep contract dates, volumes, site eligibility, certificates where applicable, cancellation evidence and relevant supplier documentation with the annual calculation package. The evidence must align with the reporting period and organisational boundary.
This distinction matters where a pharmaceutical group makes public decarbonisation commitments. Electricity procurement may affect market-based reporting, while reduced kWh consumption remains the direct route to lower location-based Scope 2 emissions.
Connecting granular utility data to pharmaceutical compliance
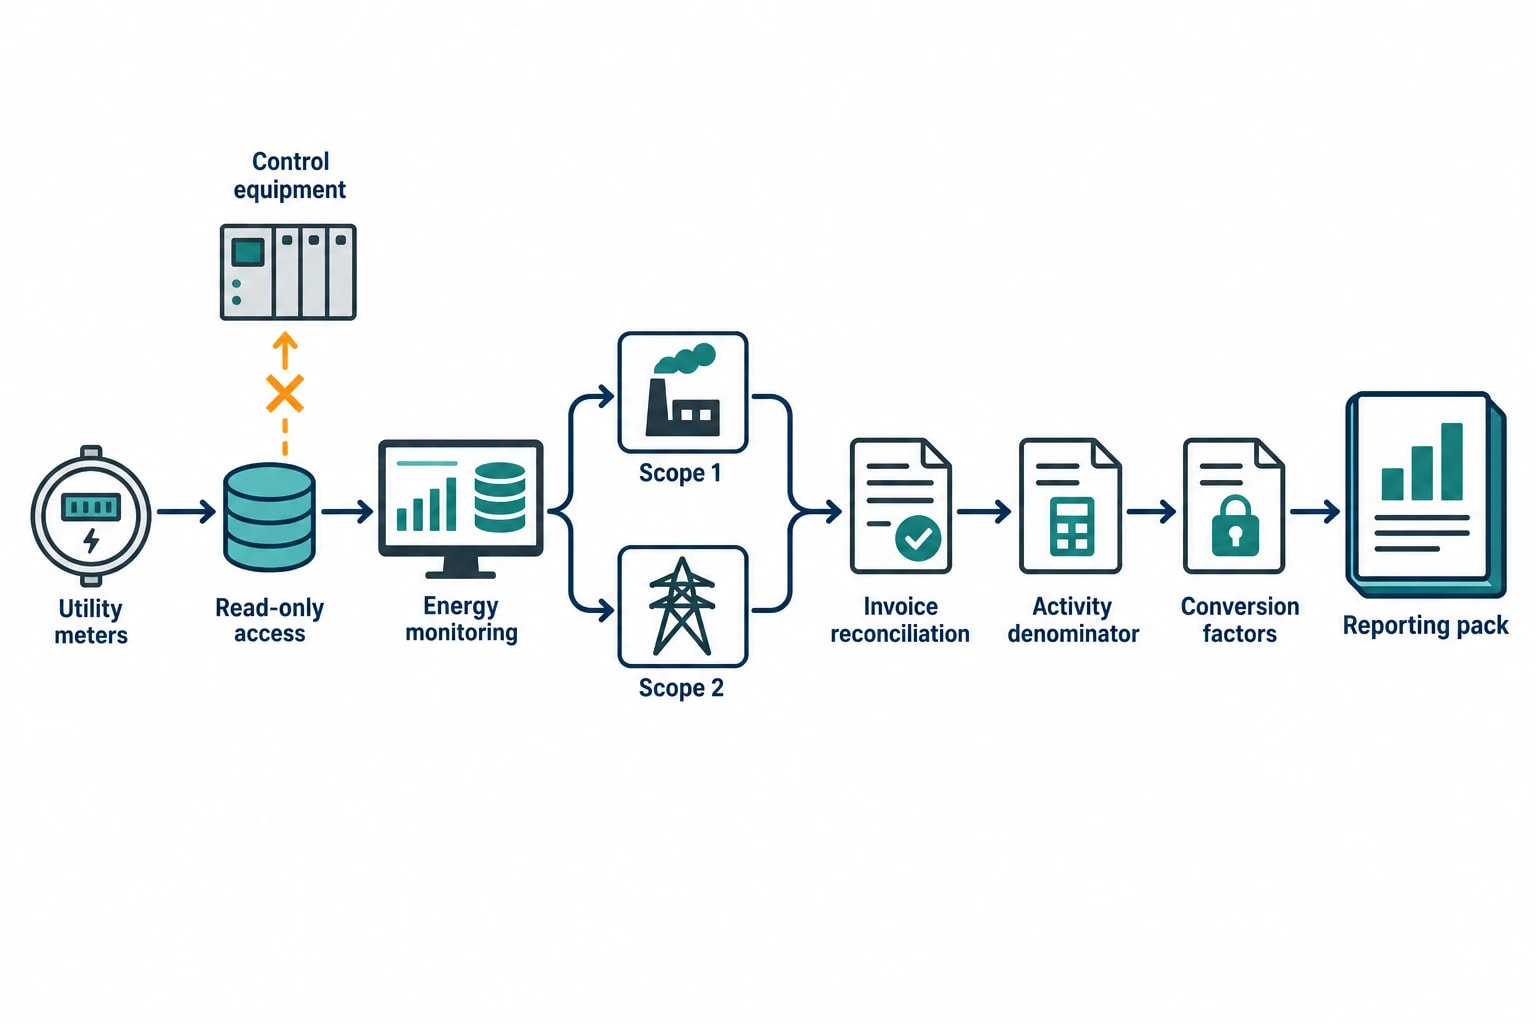
Pharmaceutical facilities need carbon reporting that respects operational control. Energy monitoring should not interfere with validated production or laboratory systems. A suitable deployment defines read-only data access, confirms the assets and signals in scope, records the change-control route and assigns responsibility for data review.
Omni Vision centralises utility data from electricity, gas, water, steam, compressed air and oil, then associates consumption with plant areas and production activity. It monitors and informs through read-only access; it cannot write back to PLCs or control equipment. The platform can identify variance and support recommendations, while operators or building-management systems apply approved changes during validated change windows.
Focus on the utility loads behind variance
Granular data helps a site explain why its intensity metric moved. Common lines of enquiry include:
- cleanroom air handling operating outside planned production hours
- compressed-air base load remaining high during shutdown
- steam demand rising because of condensate-return performance or boiler control
- chilled-water demand increasing during a refrigeration issue
- electricity use rising in a suite with low batch throughput
These are operational questions with reporting consequences. A credible explanation of a Scope 1 or Scope 2 variance should distinguish a production change from a metering gap, an emission-factor change and an efficiency issue.
A practical implementation sequence
The strongest programmes establish reporting governance, then improve the underlying measurements.
- Define the legal entities, sites, emission sources and reporting period.
- Create a complete utility supply and meter register.
- Map each source to Scope 1, Scope 2 or a documented exclusion.
- Reconcile interval data with invoices and investigate material variances.
- Link energy data to a stable production or activity denominator.
- Lock the applicable conversion-factor set and calculation method.
- Retain approvals, exceptions and evidence in a controlled annual reporting pack.
- Use the same evidence base for SECR, ESOS, ISO 50001 and voluntary CDP disclosure where the reporting boundaries allow.
CDP verification makes completeness a board-level issue
CDP aligns its climate-reporting requirements with the GHG Protocol Corporate Standard and Scope 2 Guidance. Its 2026 verification guidance states that organisations seeking Leadership points for Scope 1 and Scope 2 verification need 100% of each category verified within the reporting boundary, with no relevant exclusions.
That threshold makes partial data coverage difficult to defend. A plant may have high-quality electricity data while still weakening the group inventory through an excluded leased building, an unrecorded refrigerant source or a poorly evidenced purchased-steam supply.
This article reflects the independent analysis and editorial opinion of EnerTherm Engineering. Product names, trademarks, and brands mentioned belong to their respective owners. EnerTherm Engineering is not affiliated with, endorsed by, or a licensee of any third-party software or product mentioned unless explicitly stated.

Managing Director — EnerTherm Engineering
Dr. François Pierrel is Managing Director of EnerTherm Engineering with over two decades of expertise in thermal design, heat transfer, and industrial energy optimisation. He holds a PhD in Heat Transfer from Cranfield University and a Post-Doctorate from Heriot-Watt University.
