Achieving Real-Time Energy Visibility: Implementing Industrial Metering Across a Multi-Line Food Processing Facility
A leading food manufacturing company operating a facility in a city in the East Midlands was facing limitations in energy management due to a lack of granular consumption data across its production lines. The site, which manages complex crisp frying and popcorn processing, relied on high-level utility readings that did not provide the necessary resolution to identify inefficiencies. EnerTherm Engineering was engaged to implement a comprehensive energy monitoring system, capturing real-time electrical, gas, and water consumption data to integrate with third-party analytics platforms.
The Challenge: Identifying Utility Consumption
The facility required improved visibility into its resource usage to support operational efficiency and cost reduction initiatives. Without specific data from individual production lines, management could not correlate energy spikes with specific operational processes. The existing infrastructure lacked the necessary metering granularity to track electricity (kWh), gas (Nm³), and water (m³) effectively.
The scope of the project required a turnkey solution: design, procurement, installation, and commissioning of a robust monitoring network. The system needed to interface with multiple assets across the facility and transmit this data securely to a cloud-based analytics platform for long-term storage and analysis.
System Design and Infrastructure
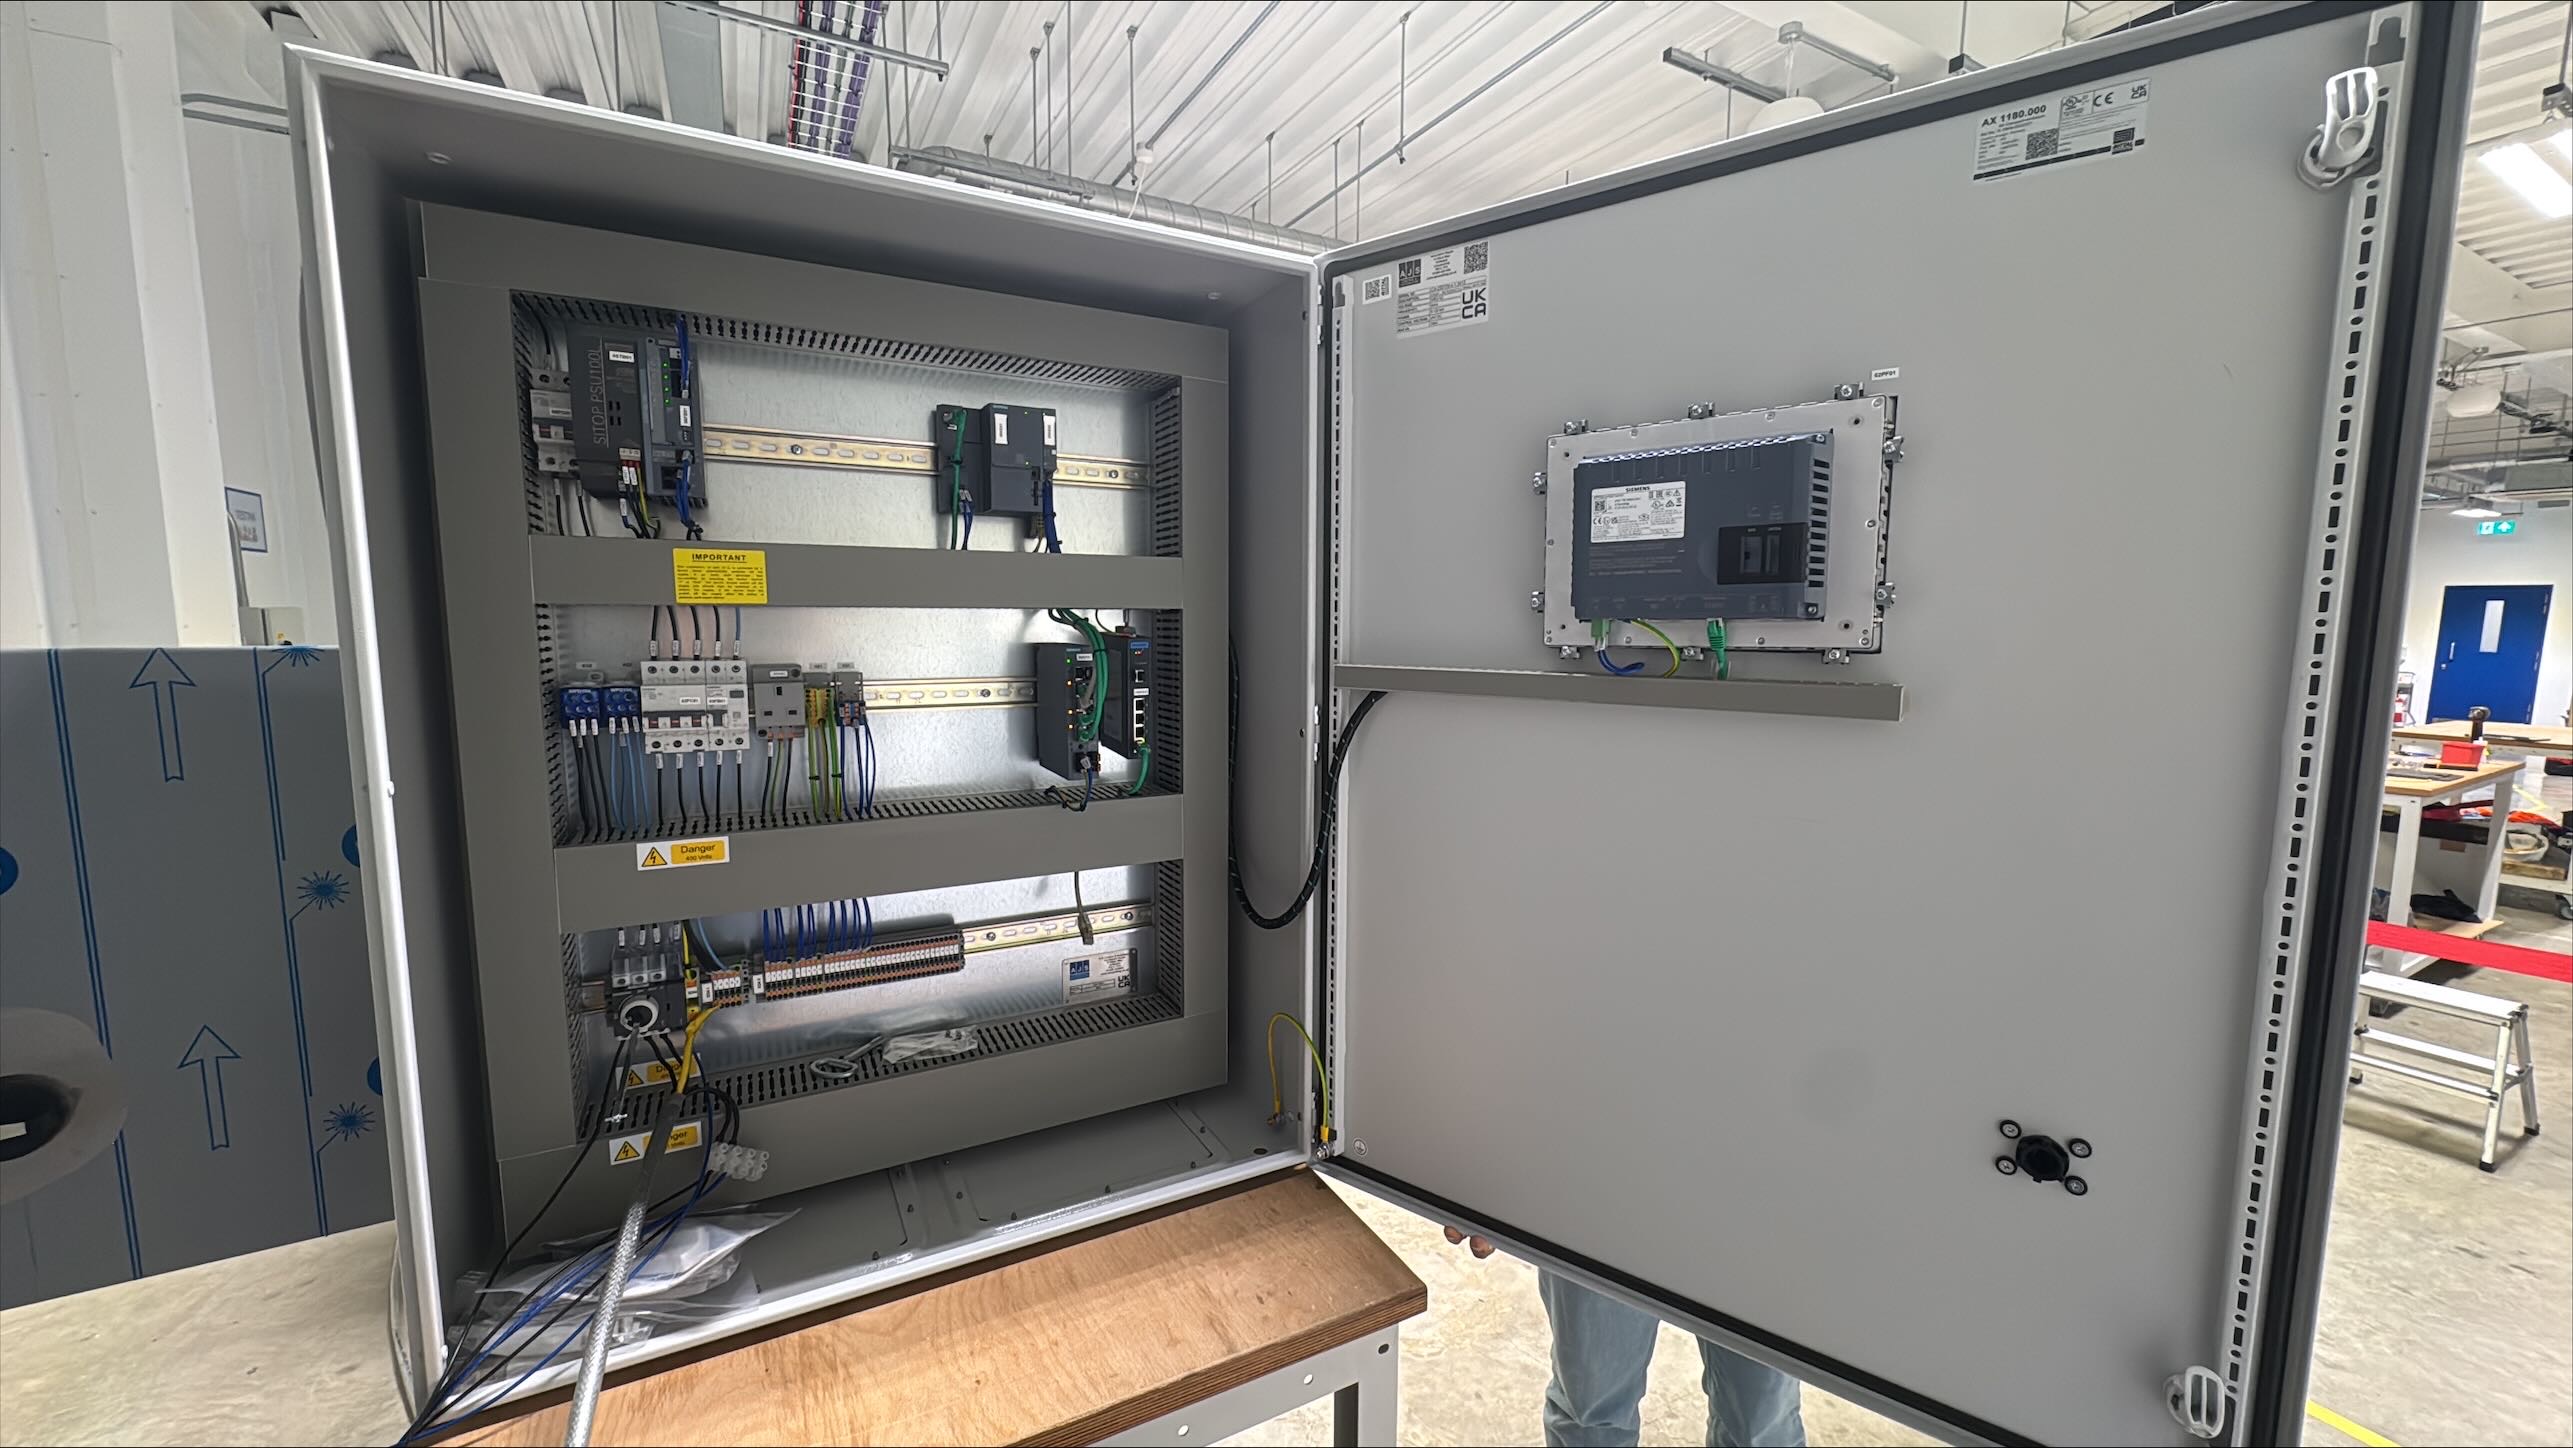
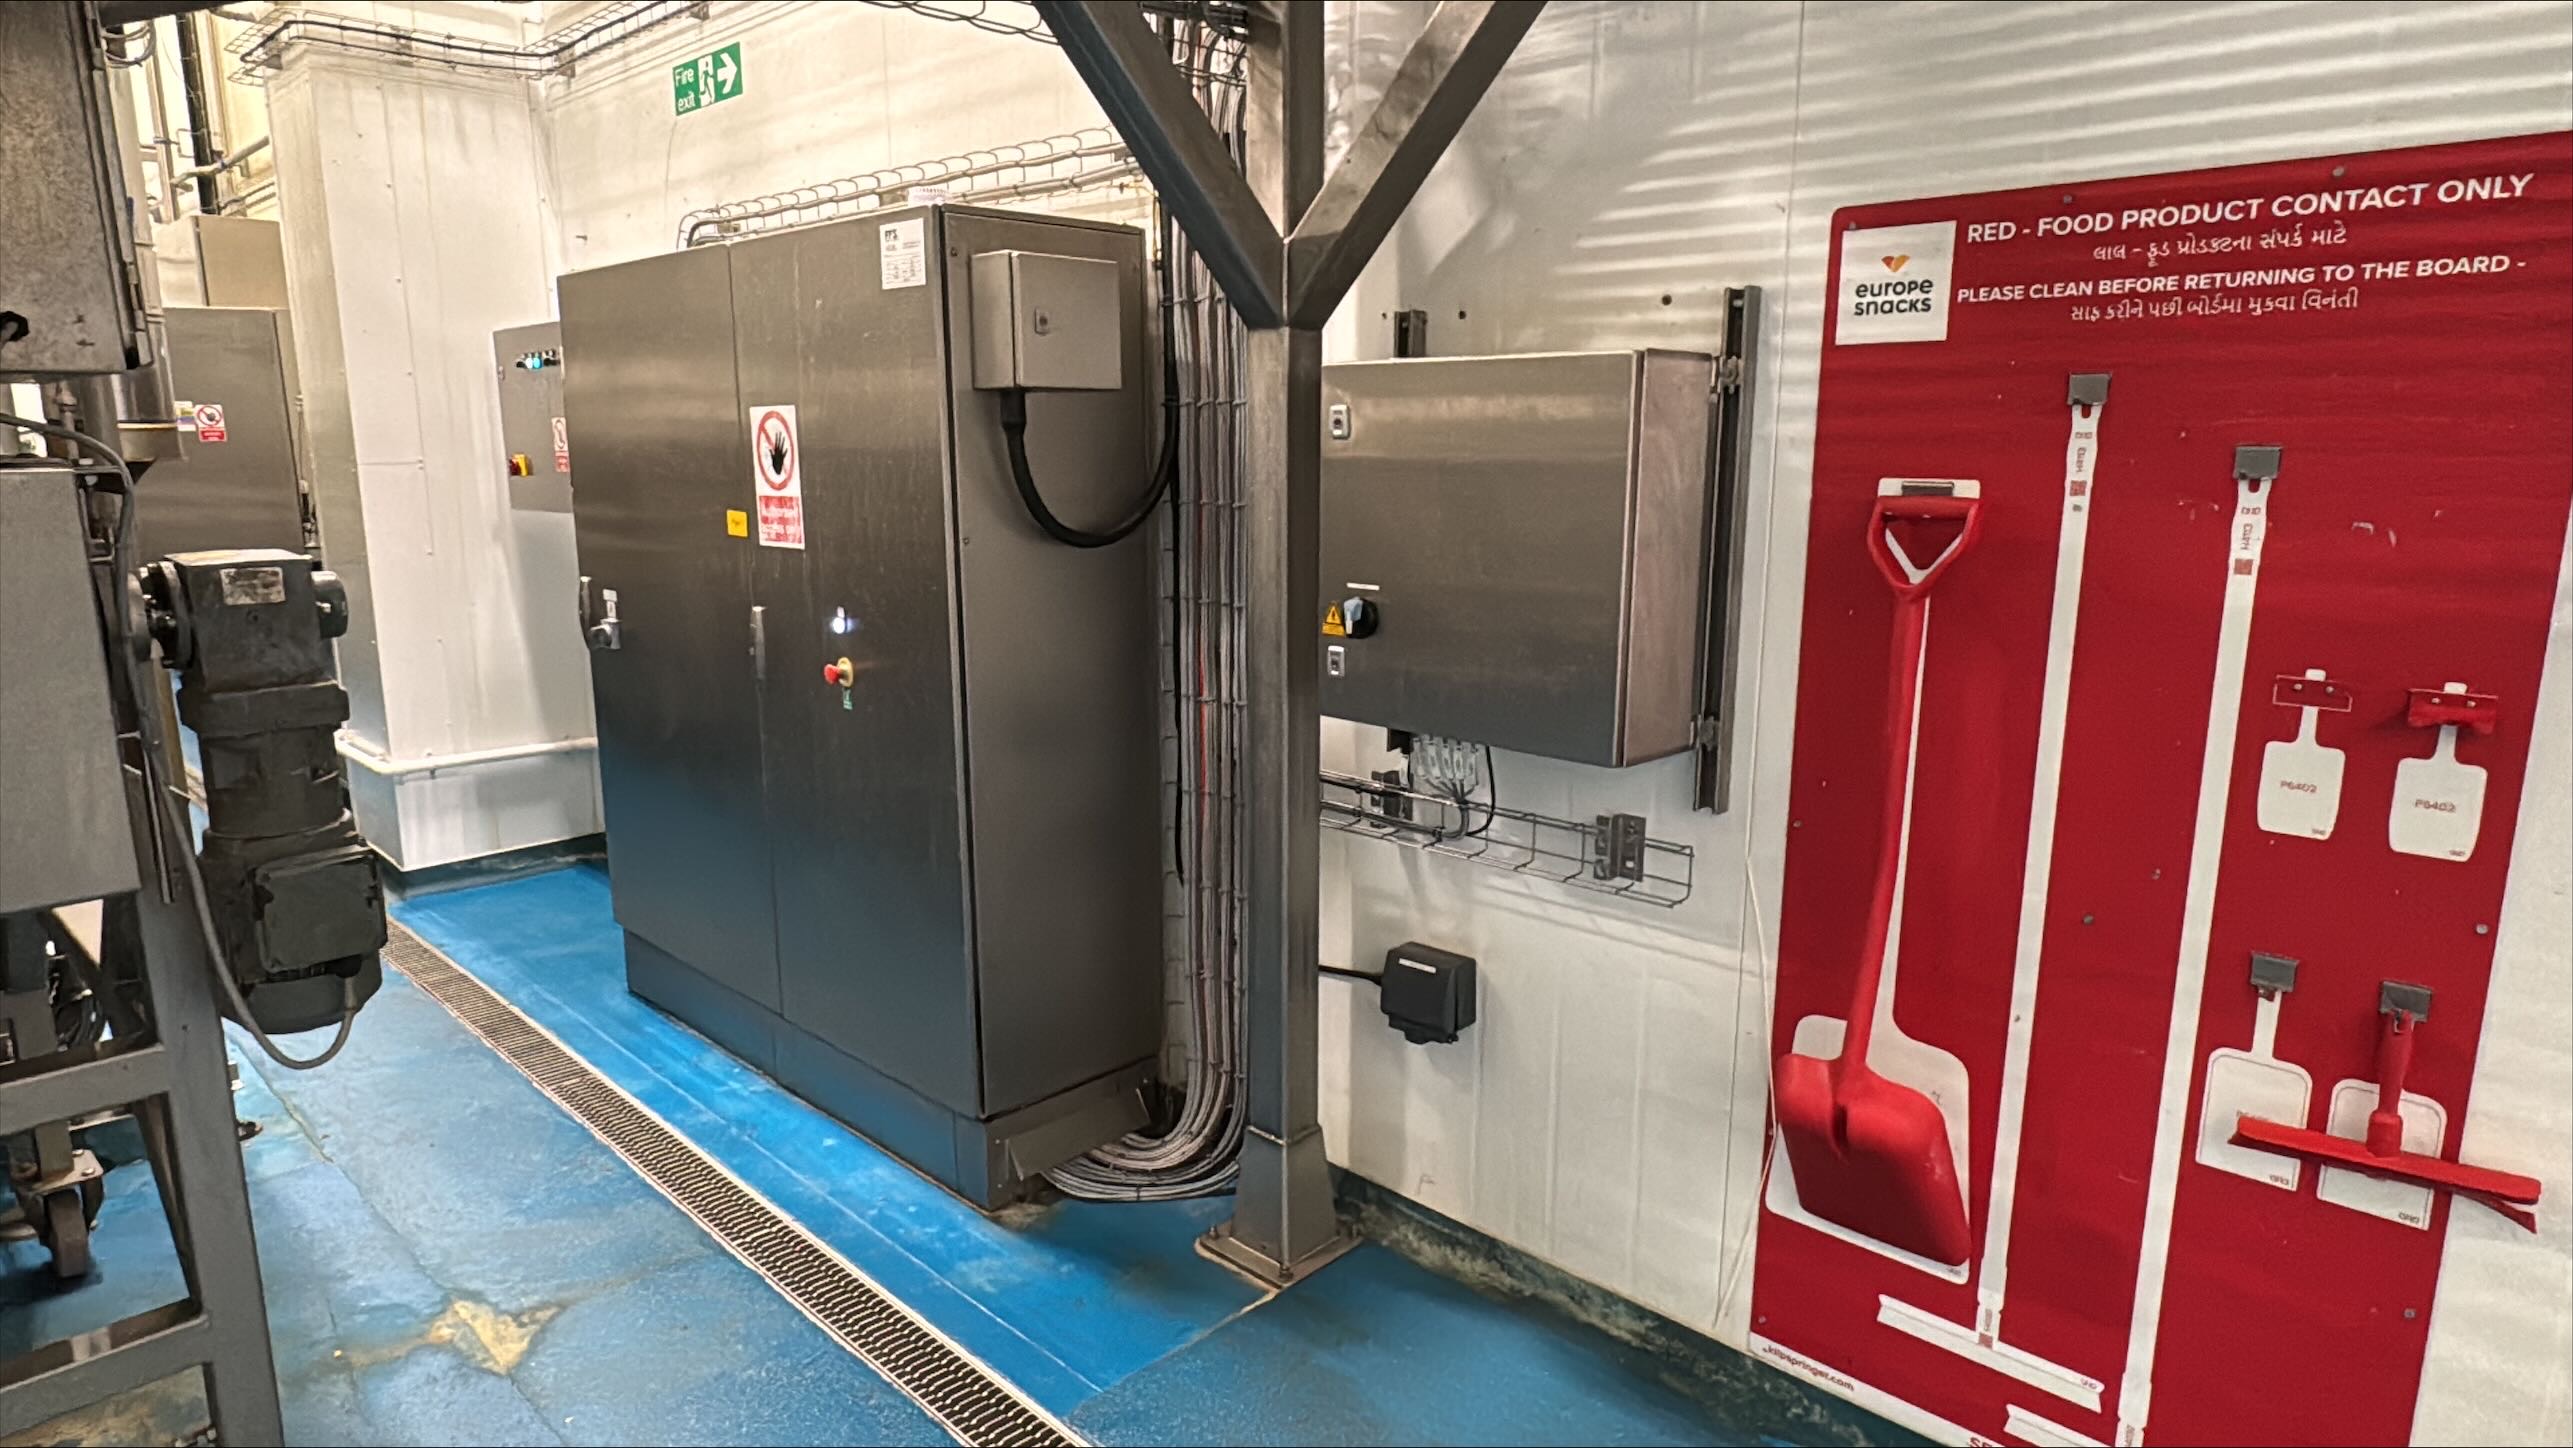
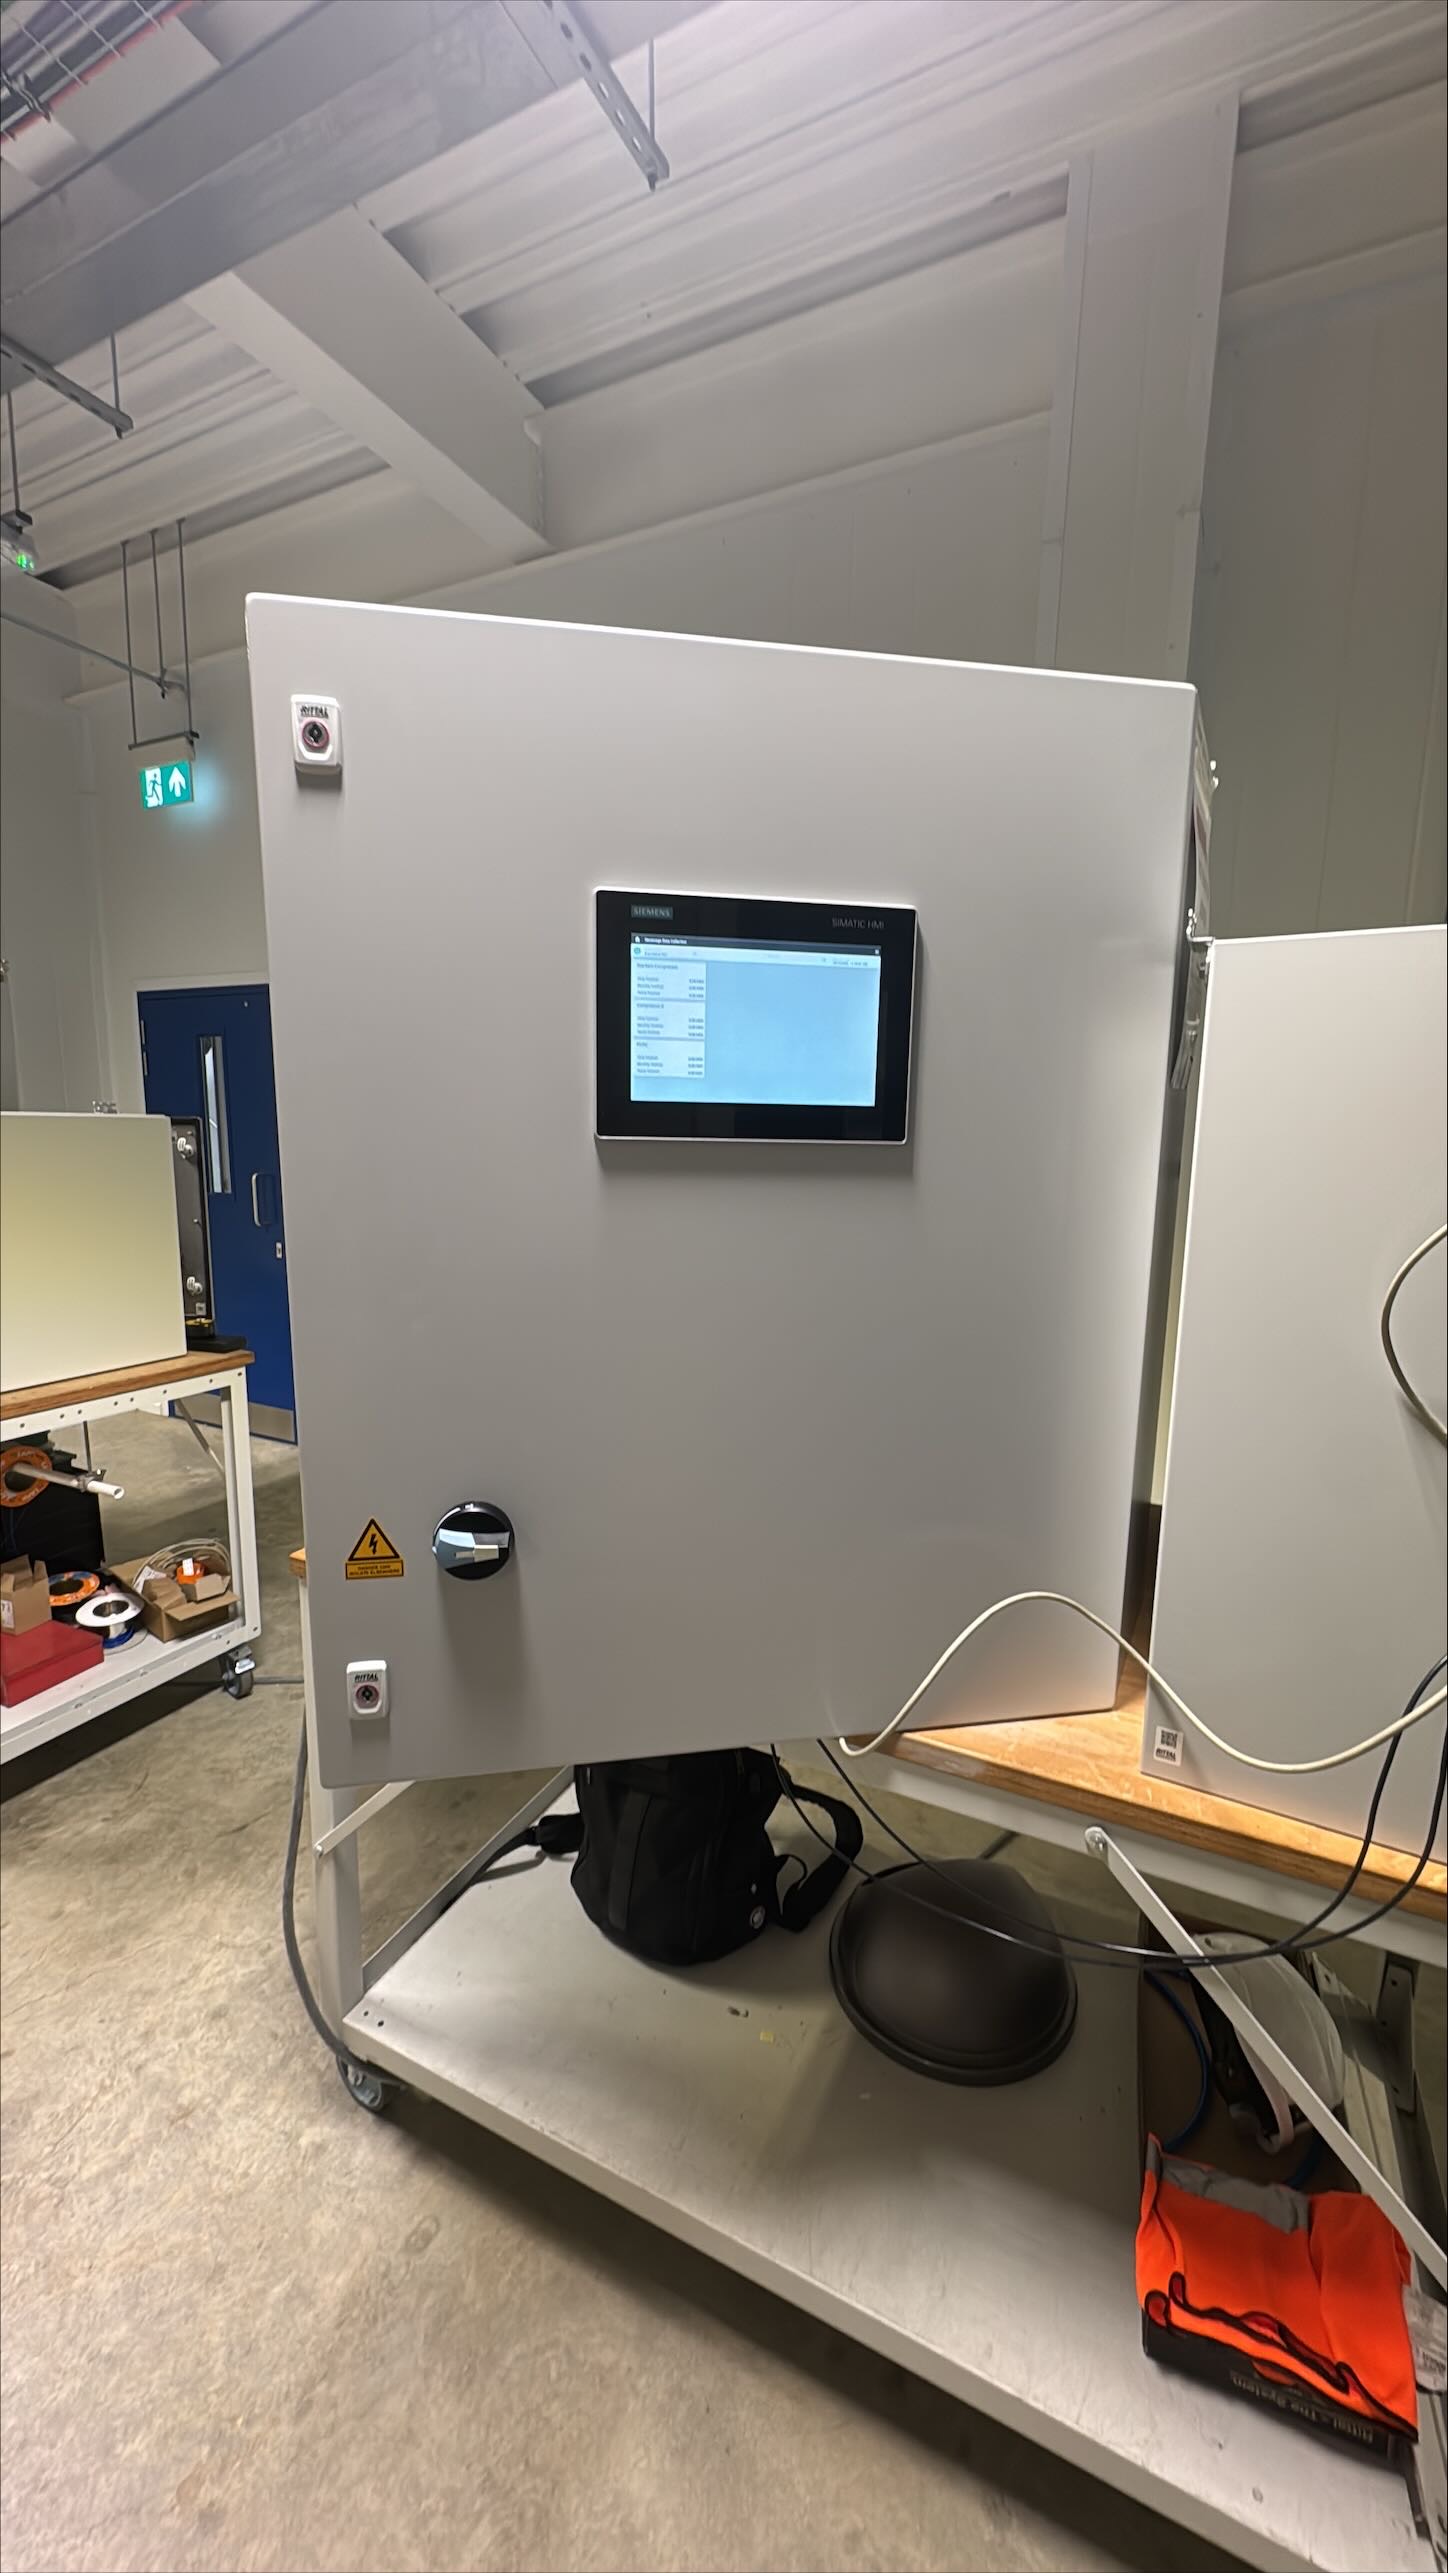
The EnerTherm Engineering team commenced the project with an assessment of the site to determine the optimal locations for data collection. The infrastructure design required the installation of 5 distinct control panels, designated ENC01 through ENC05, to act as central collection points for field devices.
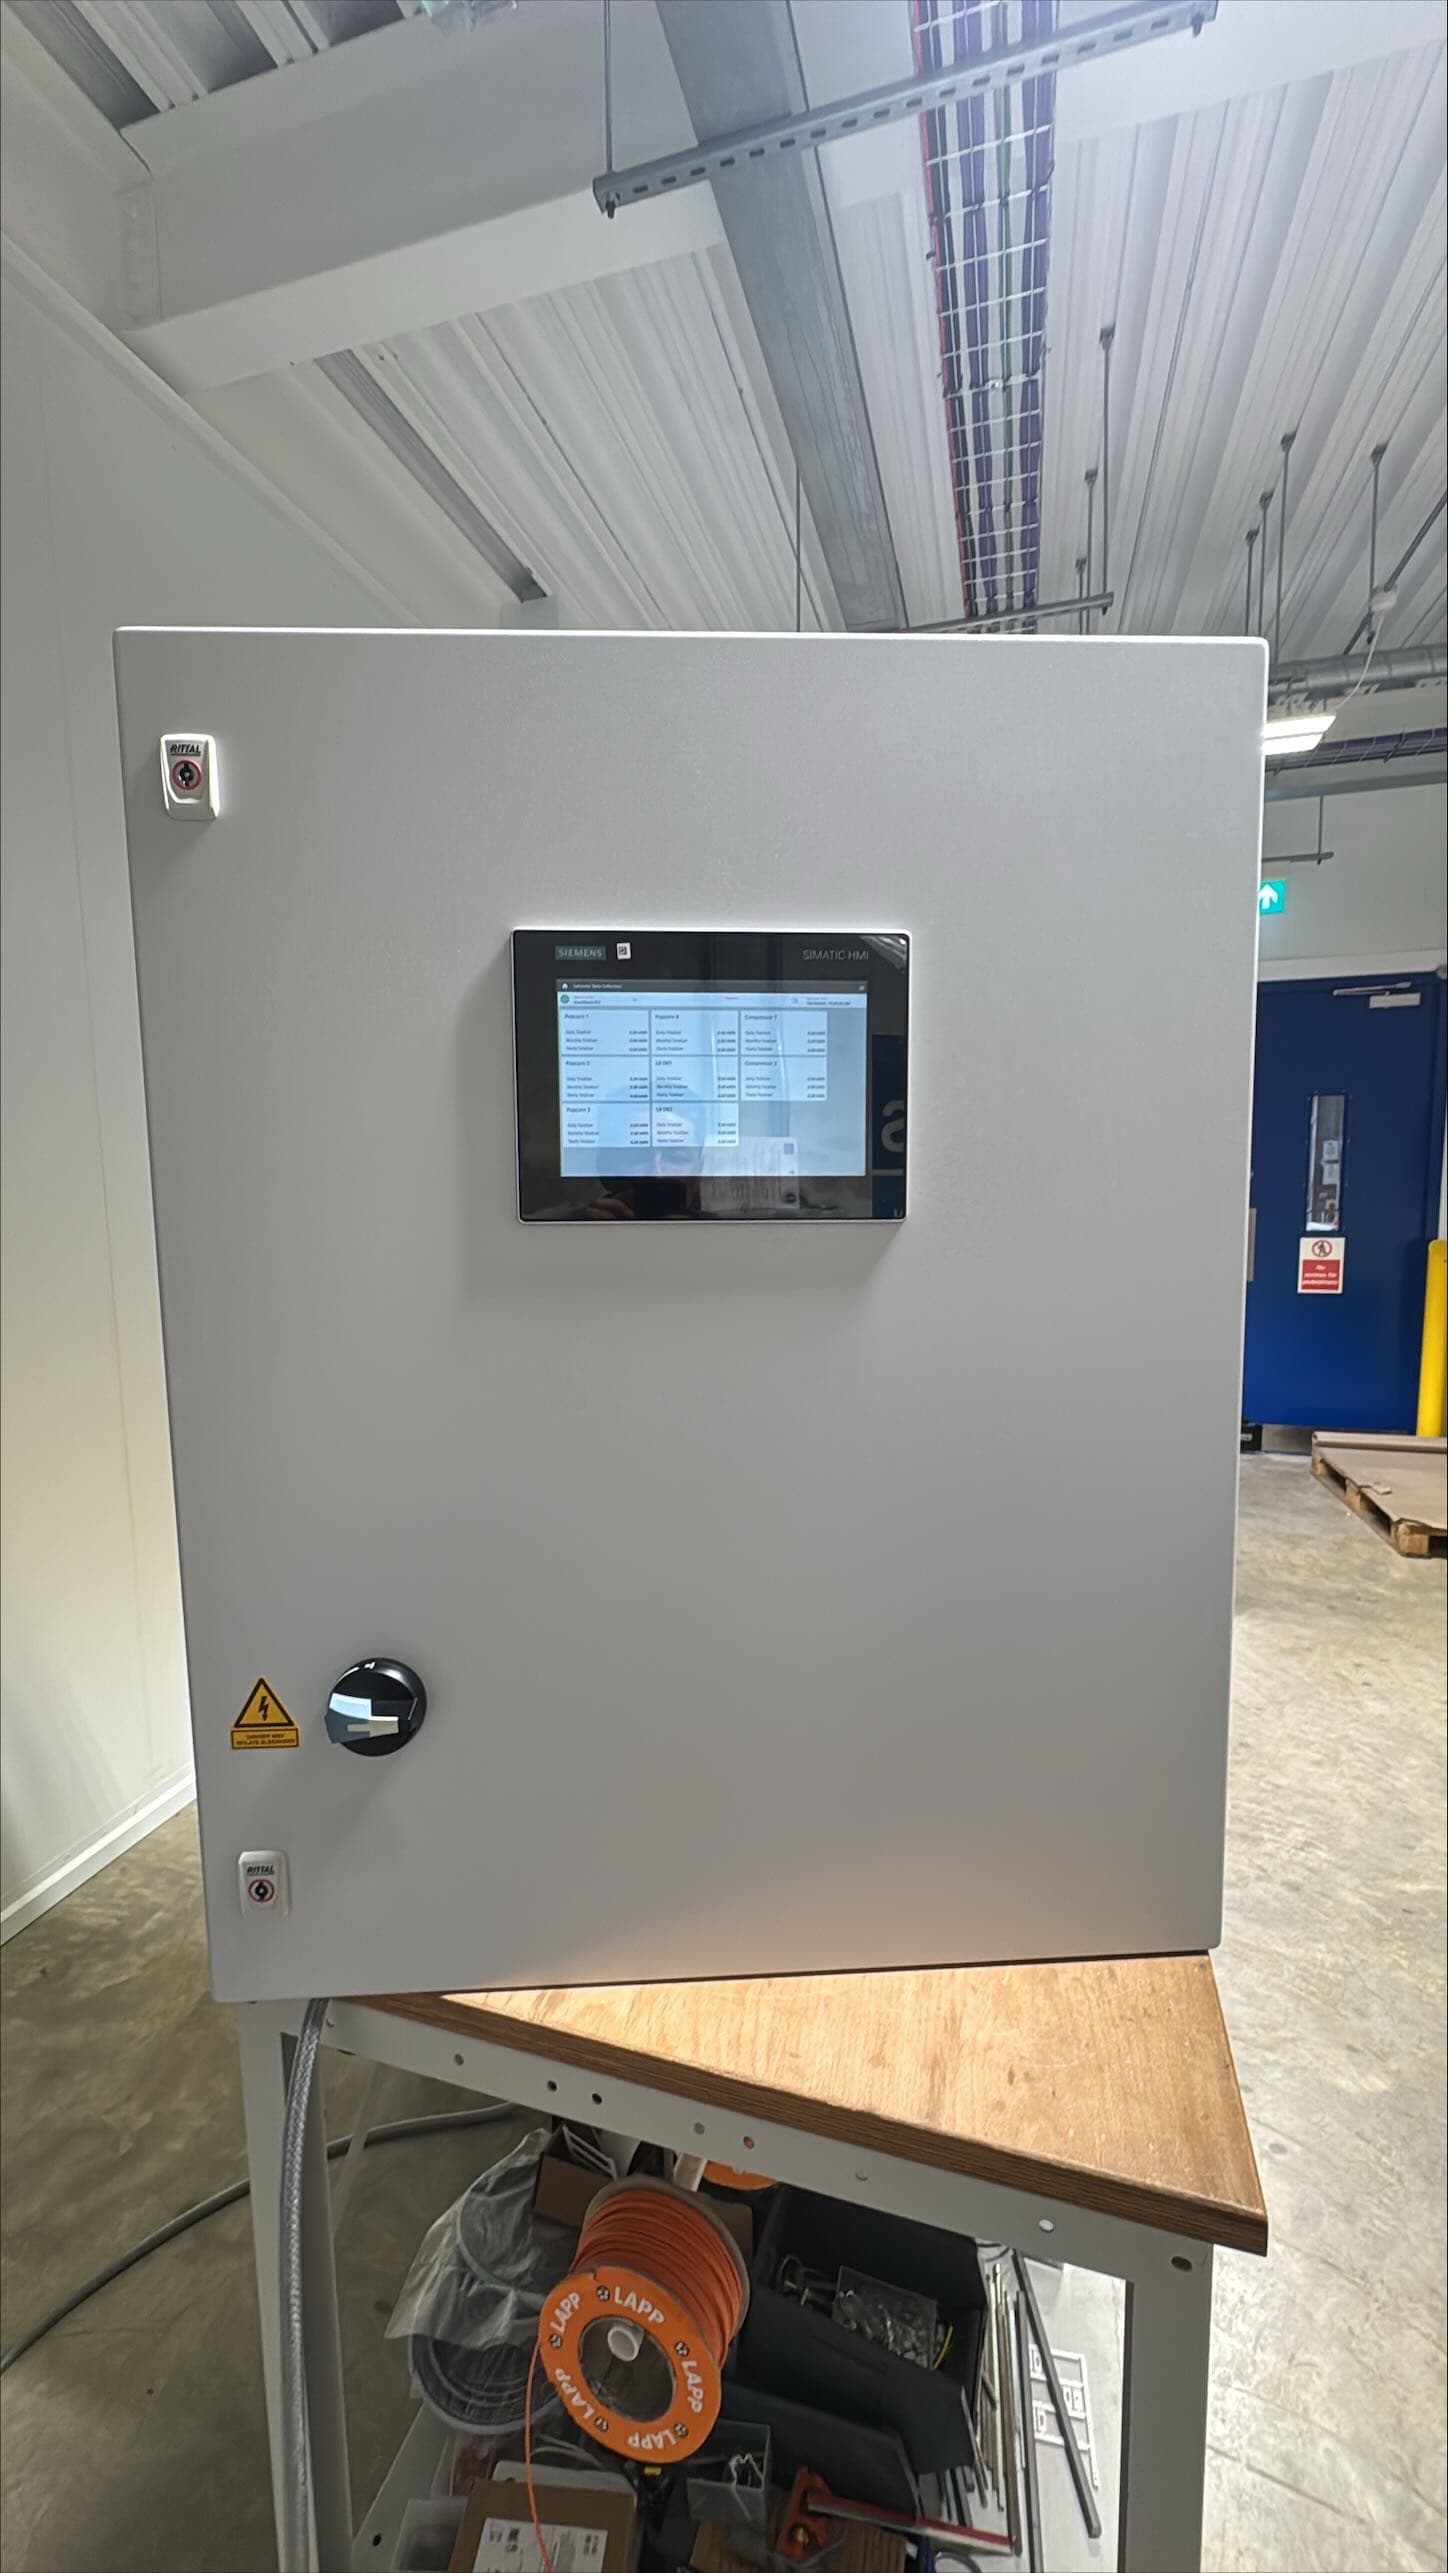
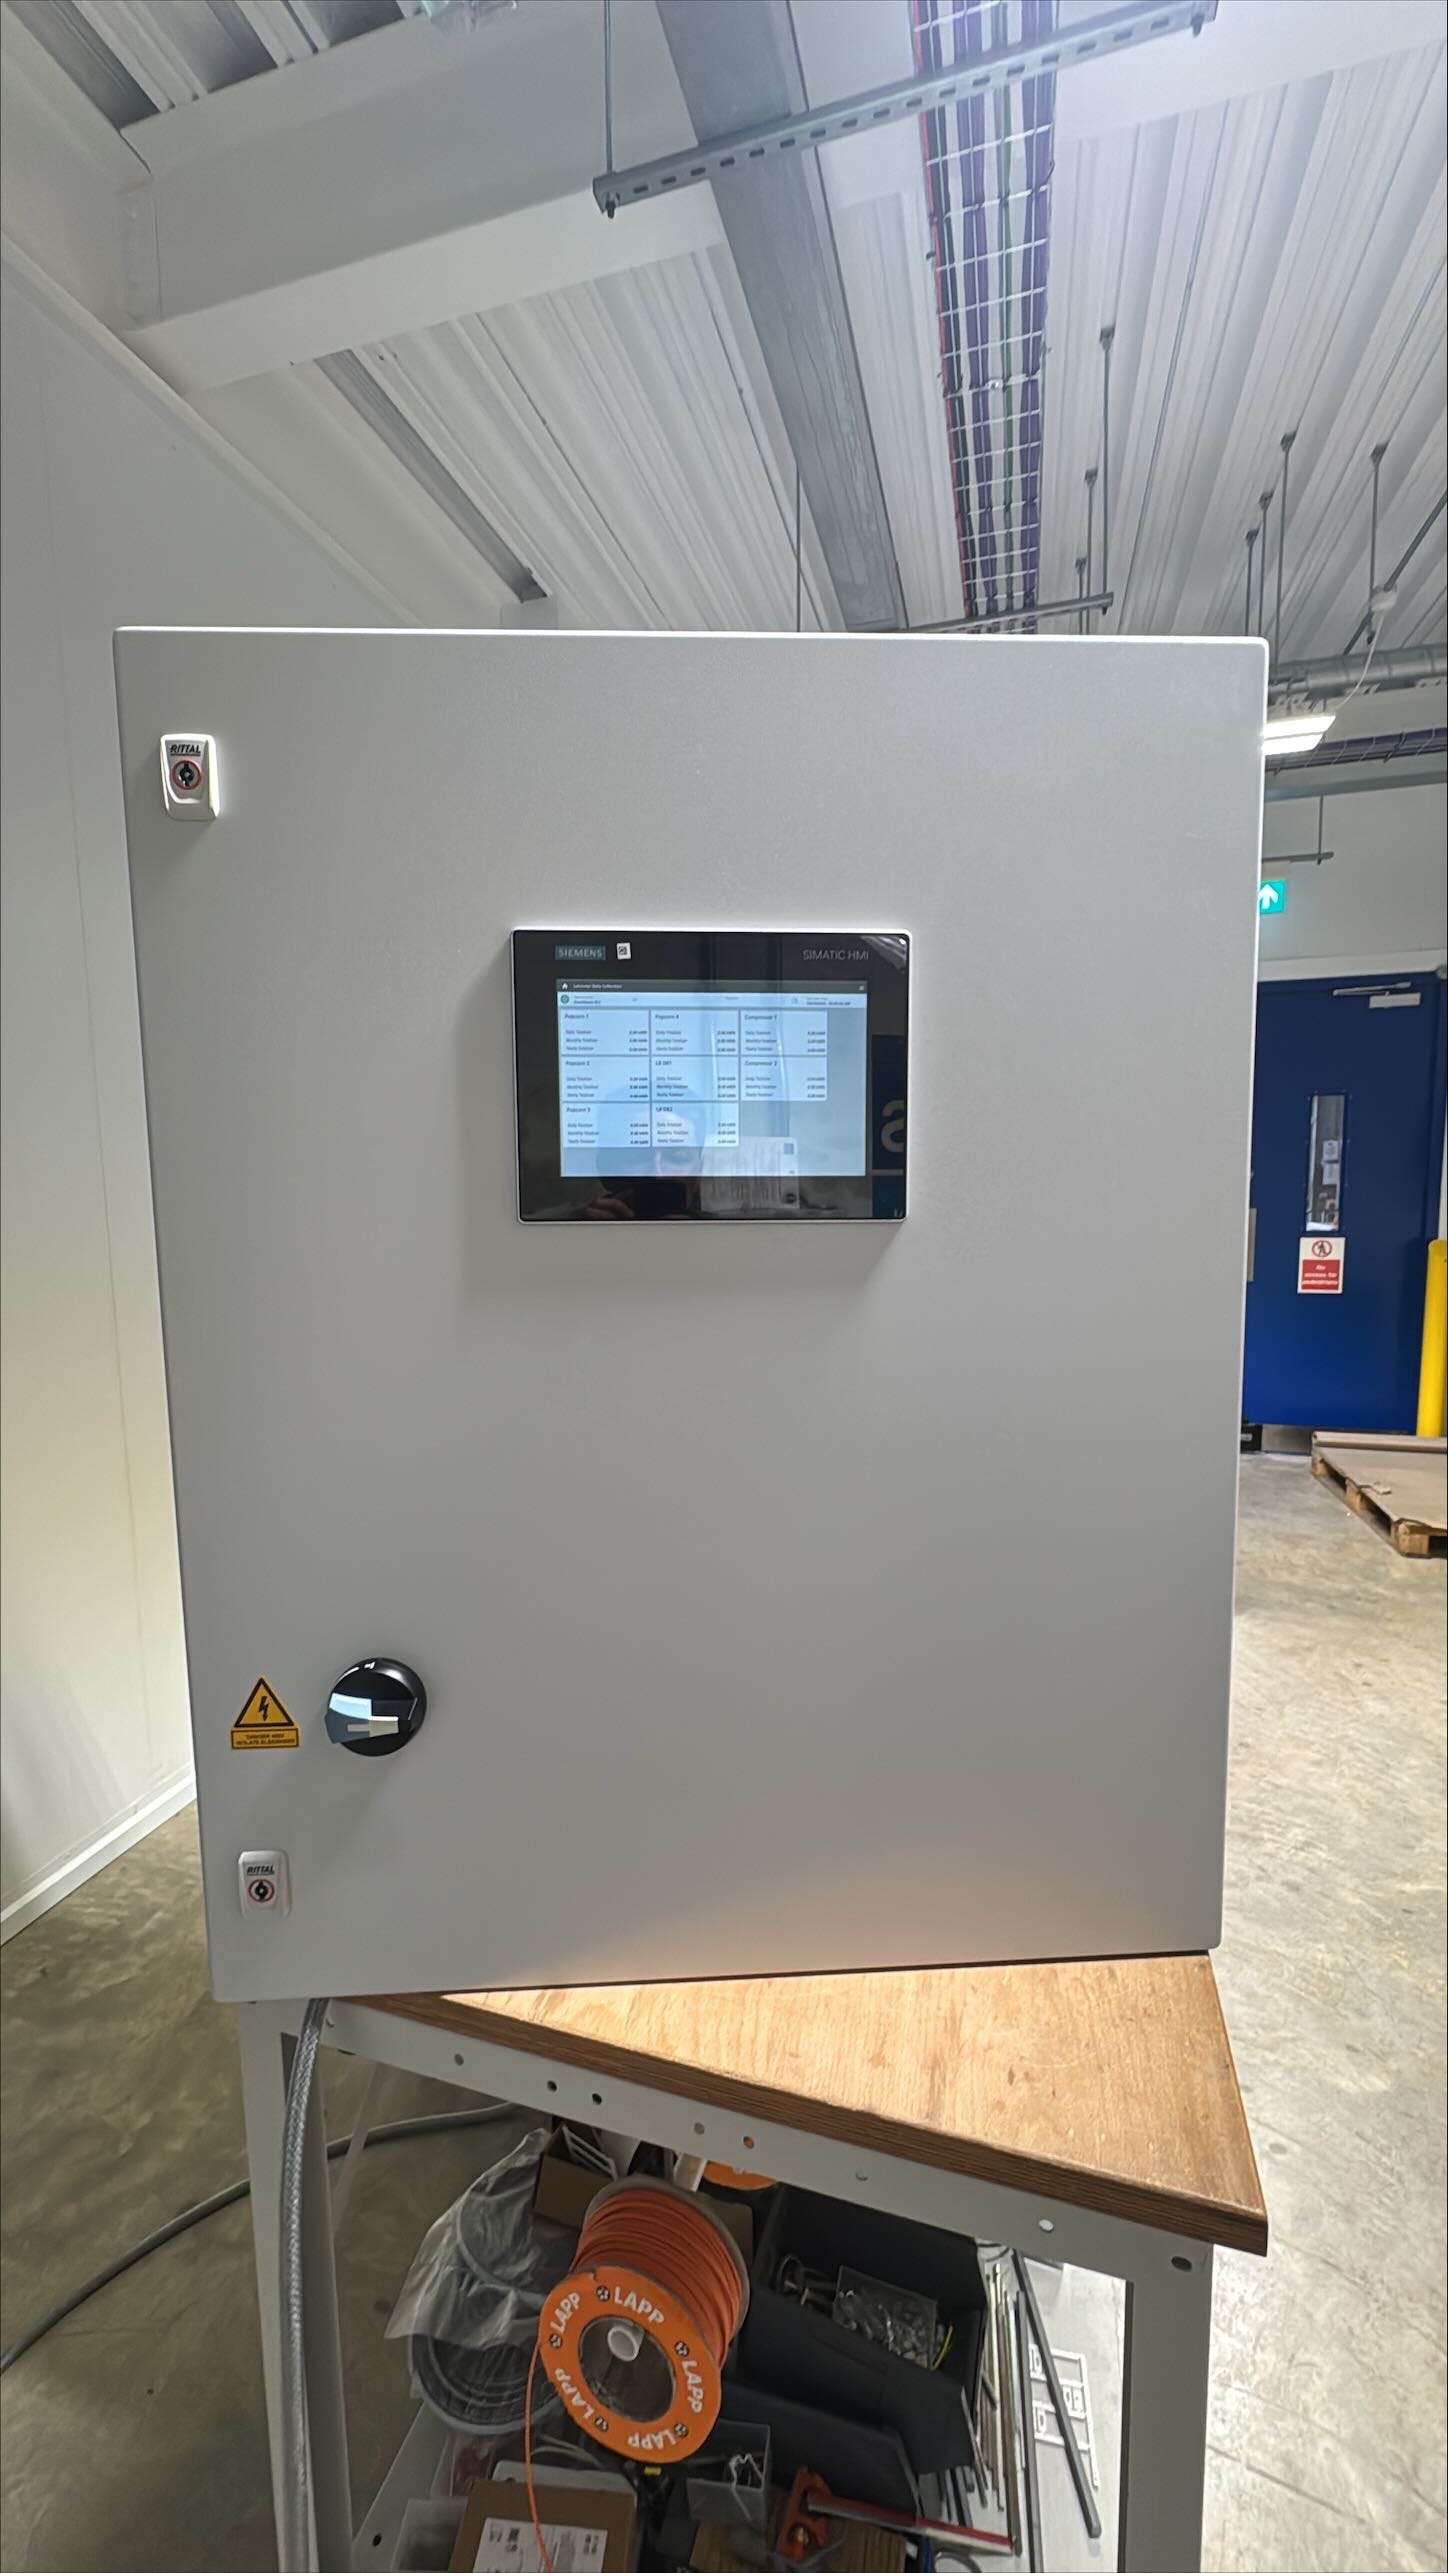
ENC01 was established as the primary PLC panel, housing the CPU and network infrastructure, as well as an HMI for on-panel visualisation. The remaining four panels were strategically positioned to aggregate signals from specific production areas, such as the compressor house, the mezzanine floor, and the fryer rooms.
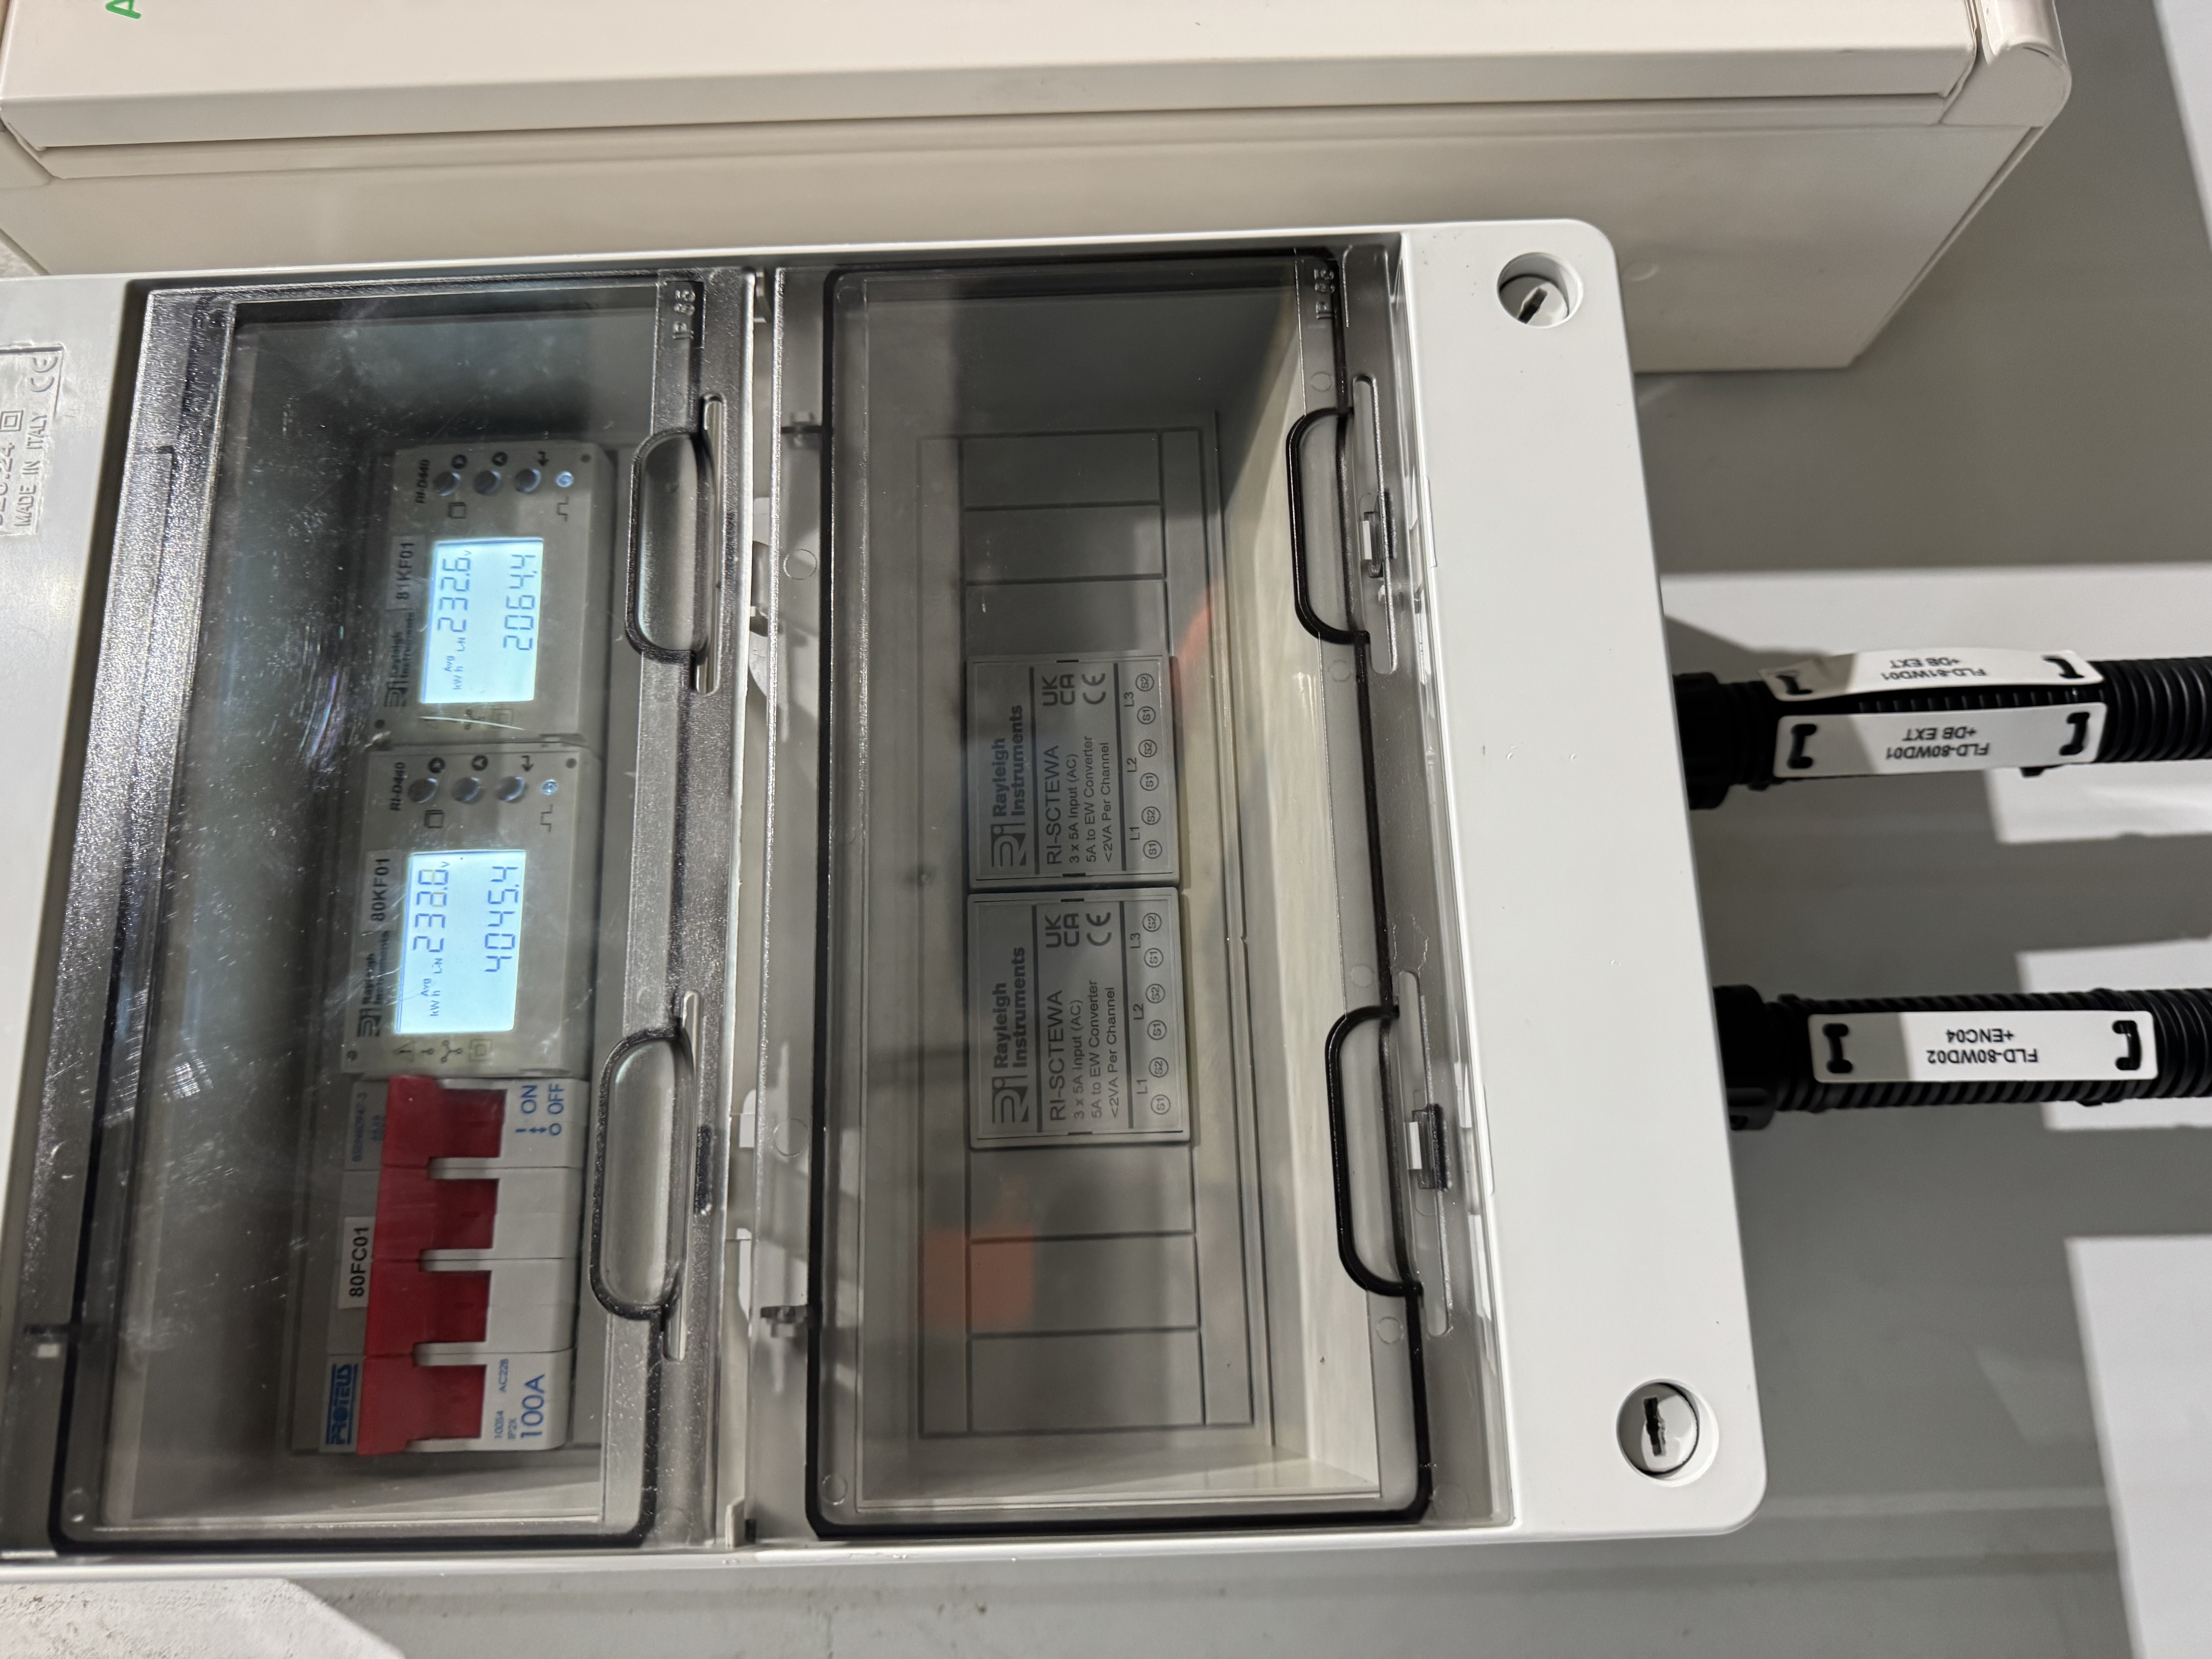
The physical metering scope was extensive, requiring the team to manage the electrical and mechanical installation of:
- 10 electric meters to monitor busbars and compressor power consumption.
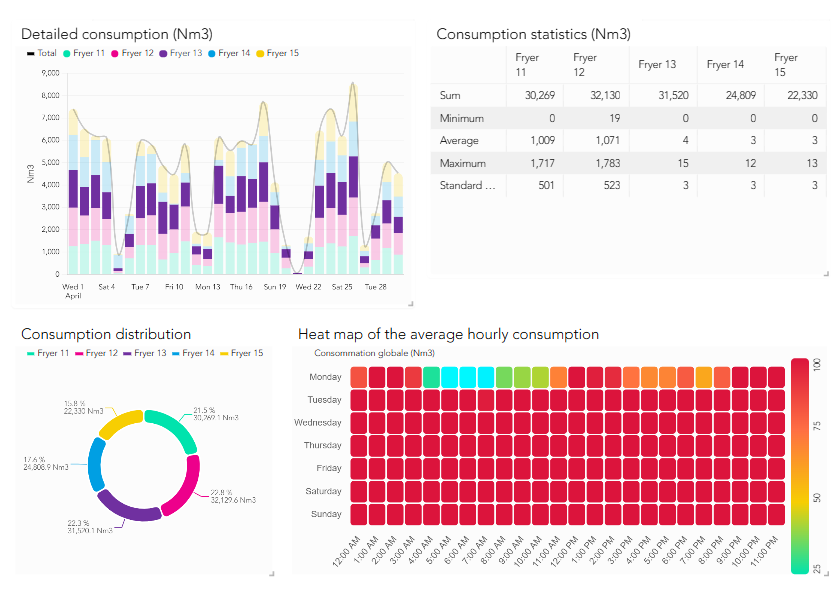
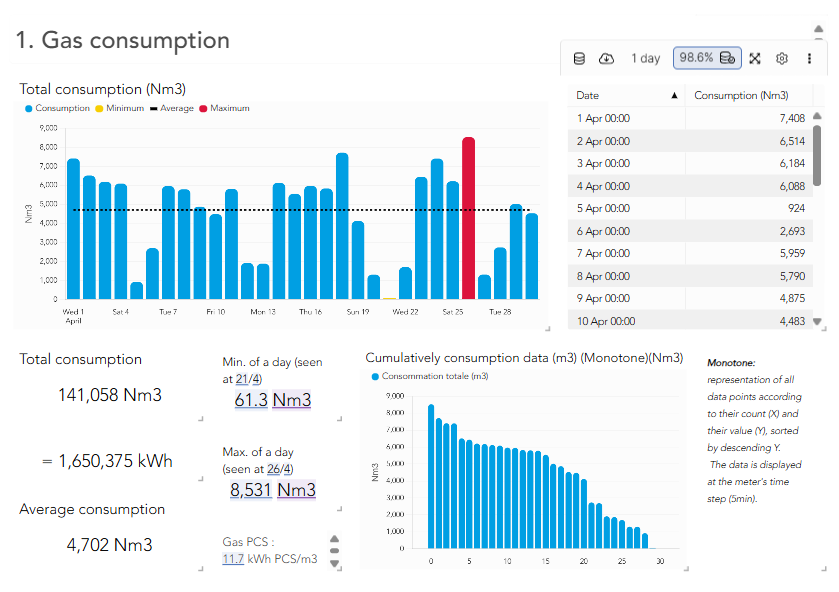
- 5 gas meters to track consumption across multiple fryer units.
- 1 water meter to monitor the crisp plant mains supply.
This phase required the project team to handle site-wide coordination, including pressure testing gas pipework for all new meter installations and installing approximately 50 metres of cabling to connect the water flow meter to the remote I/O panel. All electrical installations were performed to ensure full signal integrity from the pulse-output meters back to the central PLCs.
Data Architecture and Software Development
The core of the project was the development of a data transfer architecture that could handle raw signal processing, local storage, and cloud-based transmission. The team utilised an industrial automation provider TIA Portal V19 to programme the PLCs, ensuring that raw pulse signals were converted into meaningful engineering units (kWh, Nm³, m³) and stored as totalised data (daily, monthly, and yearly).
The Software Chain
To enable integration with the client's preferred analytics platform, EnerTherm developed a multi-stage data transfer solution:
- Data Acquisition: The PLC gathers signals and stores them in a remote SQL Server database on a client virtual machine.
- Monitoring: A custom Windows background service monitors the directory for new raw CSV reports generated by the SQL database.
- Processing and Transmission: A PowerShell script automatically processes the data, filters for the most recent hour of readings, and formats the information into the structure required by the third-party analytics provider.
- Secure Upload: The processed files are transmitted to the cloud platform via an automated FTP upload using a third-party file transfer utility.
| Utility Type | Monitoring Scope |
|---|---|
| Electricity | Popcorn lines, Nitrogen compressors, Main plant compressors |
| Gas | Fryer 11 through Fryer 15 |
| Water | Crisp plant mains supply |
This automated pipeline removes the need for manual data handling, ensuring that energy analysts have access to clean, reliable data for their efficiency programmes without ongoing manual intervention from the operations team.
Commissioning and Operational Readiness
Before the system went live, the team conducted a rigorous FAT and on-site commissioning programme. This included I/O checking, where every signal path was verified for connectivity and accuracy, and comprehensive TCP/IP communication testing between the panels and the virtual machine.
A key aspect of the commissioning was the coordination with the analytics platform provider. The team performed end-to-end testing, confirming that the tag naming conventions (such as EM-01-PC1 for Popcorn 1 electricity) were correctly mapped and that data was arriving in the cloud platform in the correct format. This ensured that immediately upon project handover, the client had a fully functional energy dashboard.
Project Outcome
The installation provides the client with the granular visibility required to move from reactive energy management to proactive operational optimisation. The system is designed to scale; while the current HMI focuses on real-time visualisation, the underlying database structure supports long-term data retention and trend analysis.
Following the successful handover, the client now possesses the infrastructure to identify baseline energy usage, detect anomalies in consumption, and measure the impact of efficiency projects across their critical production lines. The project was closed upon the successful delivery of the documentation package, which included electrical schematics, calibration certificates for all gas meters, and software setup guides to ensure the client maintains full operational control of the monitoring system.

Managing Director — EnerTherm Engineering
Dr. François Pierrel is Managing Director of EnerTherm Engineering with over two decades of expertise in thermal design, heat transfer, and industrial energy optimisation. He holds a PhD in Heat Transfer from Cranfield University and a Post-Doctorate from Heriot-Watt University.
