Reducing Coating Flow Variability by 7.5x: A Manifold Optimisation Study
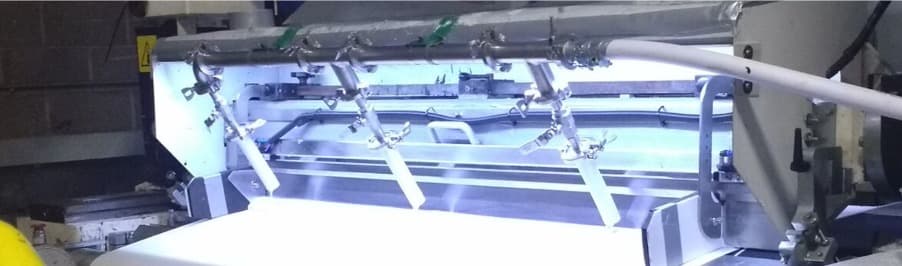
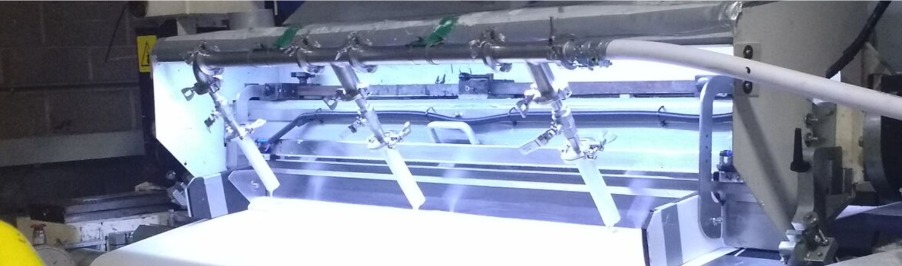
A manufacturing client operating a specialised coating line was experiencing chronic inconsistencies in coating mass flow distribution. The facility utilised a three-valve pipe manifold arrangement to deposit coating material onto a moving belt. The project lead was engaged by the client to investigate the root causes of the variable mass flow rate and to identify potential operational optimisations to stabilise the process.
Establishing the Baseline
The core objective of the investigation was to determine why coating mass flow rates varied over time and whether the physical configuration of the manifold contributed to these fluctuations. The facility's existing set-up involved three manual valves to control mass flow at individual nozzles. To provide an objective analysis, the team created a high-fidelity 3D model of the existing manifold geometry, ensuring the virtual representation aligned precisely with the client's physical infrastructure.
To analyse the flow characteristics, the team employed CFD. This process involved generating a numerical mesh to fill the inner volume of the pipework. The mesh consisted of 180,880 fluid cells, creating a detailed structure where Navier-Stokes equations could be solved for each nodal point to accurately calculate flow, pressure, and temperature gradients.
The team utilised three distinct levels of mesh refinement to achieve an optimal balance between computational time and solution accuracy, with the density of the mesh adjusted dynamically for every simulated movement of the valves.
Boundary Conditions and Variable Analysis
Defining the boundary conditions was critical for model accuracy. The team established a constant mass flow of 0.006 kg/s at the pipework inlet, with each outlet set to atmospheric pressure. The simulation accounted for gravity and utilised site-specific data to model the behaviour of a proprietary material code.
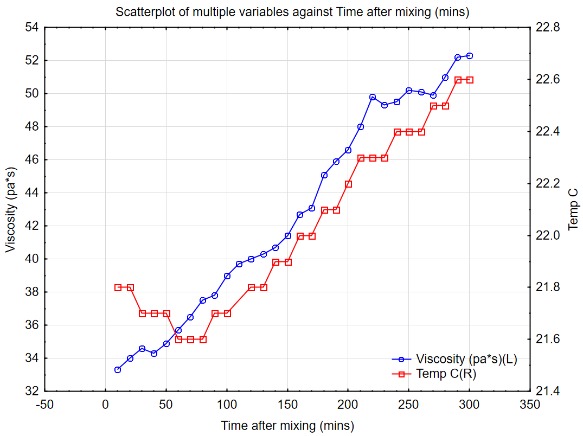
The team conducted a sensitivity analysis to determine if temperature fluctuations affected viscosity. While temperature changes had a minor influence, the statistical analysis revealed that the time elapsed after mixing had a more significant impact on material behaviour. Consequently, temperature was held constant at 20°C for all simulations to isolate the impact of manifold geometry and valve positioning.
| Component | Rate (m/min) | Mass Flow (g/min) | Mass Flow (kg/hr) | Mass Flow (kg/sec) |
|---|---|---|---|---|
| Head 1 | 3 | 361 | 21.66 | 0.0060 |
| Head 2 | 3 | 360 | 21.60 | 0.0060 |
| Head 3 | 3 | 472 | 28.32 | 0.0079 |
Findings: Flow Dynamics and Residence Time
Initial simulations were run with all three valves in the fully open position. The results confirmed the client's observations: static pressure was significantly higher at the first pipe inlet, and the velocity profile showed distinct variations across the three outlets, confirming an uneven distribution.
The team also assessed the residence time of the material by injecting particles into the simulation and tracking their trajectories. The findings showed a variance in residence time ranging from 2 to 26 minutes across the three outlets. However, the resulting change in viscosity was approximately 2 pa/s, which the team concluded was minimal enough to be considered negligible in the context of the overall flow distribution issues.
Further testing demonstrated that while increasing the material viscosity caused the pressure drop in the pipe to rise from 32 mbar to 63 mbar, the actual distribution of mass flow across the three valves remained stable. This suggested that if the client's existing pump had sufficient capacity to manage the increased pressure drop, the flow distribution would remain consistent regardless of viscosity changes.
Optimisation and Results
To correct the mass flow imbalance, the team performed an optimisation model using a DOE approach. The primary goal was to minimise the standard deviation (STDEV) of the mass flow across the three outlets by determining the optimal angle for each valve.
Through iterative simulation, the team identified the precise valve positions required to achieve uniform distribution. The recommended optimal settings were determined to be 34.5°, 17.3°, and 2.31° for valves one, two, and three, respectively.
| Metric | Fully Open | Optimised Position |
|---|---|---|
| Valve 1 Position | 0° | 34.5° |
| Valve 2 Position | 0° | 17.3° |
| Valve 3 Position | 0° | 2.31° |
| STDEV | 4.18E-04 | 5.59E-05 |
| Improvement Factor | - | 7.5x |
The implementation of these optimised valve positions resulted in a reduction of the standard deviation of mass flow by a factor of 7.5. This significant improvement demonstrates that the manifold flow could be stabilised purely through precise mechanical adjustment of existing assets.
Conclusions and Strategic Recommendations
The study concluded that while the current pipe manifold was not inherently optimal, precise control over valve positioning significantly improved uniformity. The project lead advised that to maintain this level of performance across varying operational conditions, the facility would need to adjust valve settings dynamically whenever input mass flow rates changed.
For long-term efficiency, the report recommended exploring structural modifications to the manifold. Two concepts were proposed to achieve passive uniformity across the system: a conical design with a fixed-width slot, or a straight pipe arrangement featuring a tapered slot. These design changes would eliminate the need for constant manual valve adjustments, offering a more robust and sustainable solution for the client's coating operations.

Managing Director — EnerTherm Engineering
Dr. François Pierrel is Managing Director of EnerTherm Engineering with over two decades of expertise in thermal design, heat transfer, and industrial energy optimisation. He holds a PhD in Heat Transfer from Cranfield University and a Post-Doctorate from Heriot-Watt University.
