Energy Modelling for Pharmaceutical Facilities Under GMP
HVAC and clean utilities can account for 40-60% of site energy use
Energy modelling for pharmaceutical facilities is the calibrated representation of a GMP site’s energy use, utility loads and operating conditions. It tests efficiency measures without compromising product quality or compliance.
For a sterile manufacturing plant, a minimum 10 Pa pressure difference between adjacent rooms of different grades is the EU GMP Annex 1 guidance value. That small number has major operational consequences. Any proposal to reduce supply airflow, fan speed, reheat or outside-air treatment must preserve the pressure cascade, cleanroom cleanliness and recovery performance that protect the product.
This changes the purpose of an energy model. A conventional building model may seek the lowest possible consumption. A pharmaceutical facility model identifies the lowest validated energy use within approved operating ranges. It must reflect production schedules, room states, WFI circulation, clean-steam demand, refrigeration load and the control limits defined in the site’s Pharmaceutical Quality System.
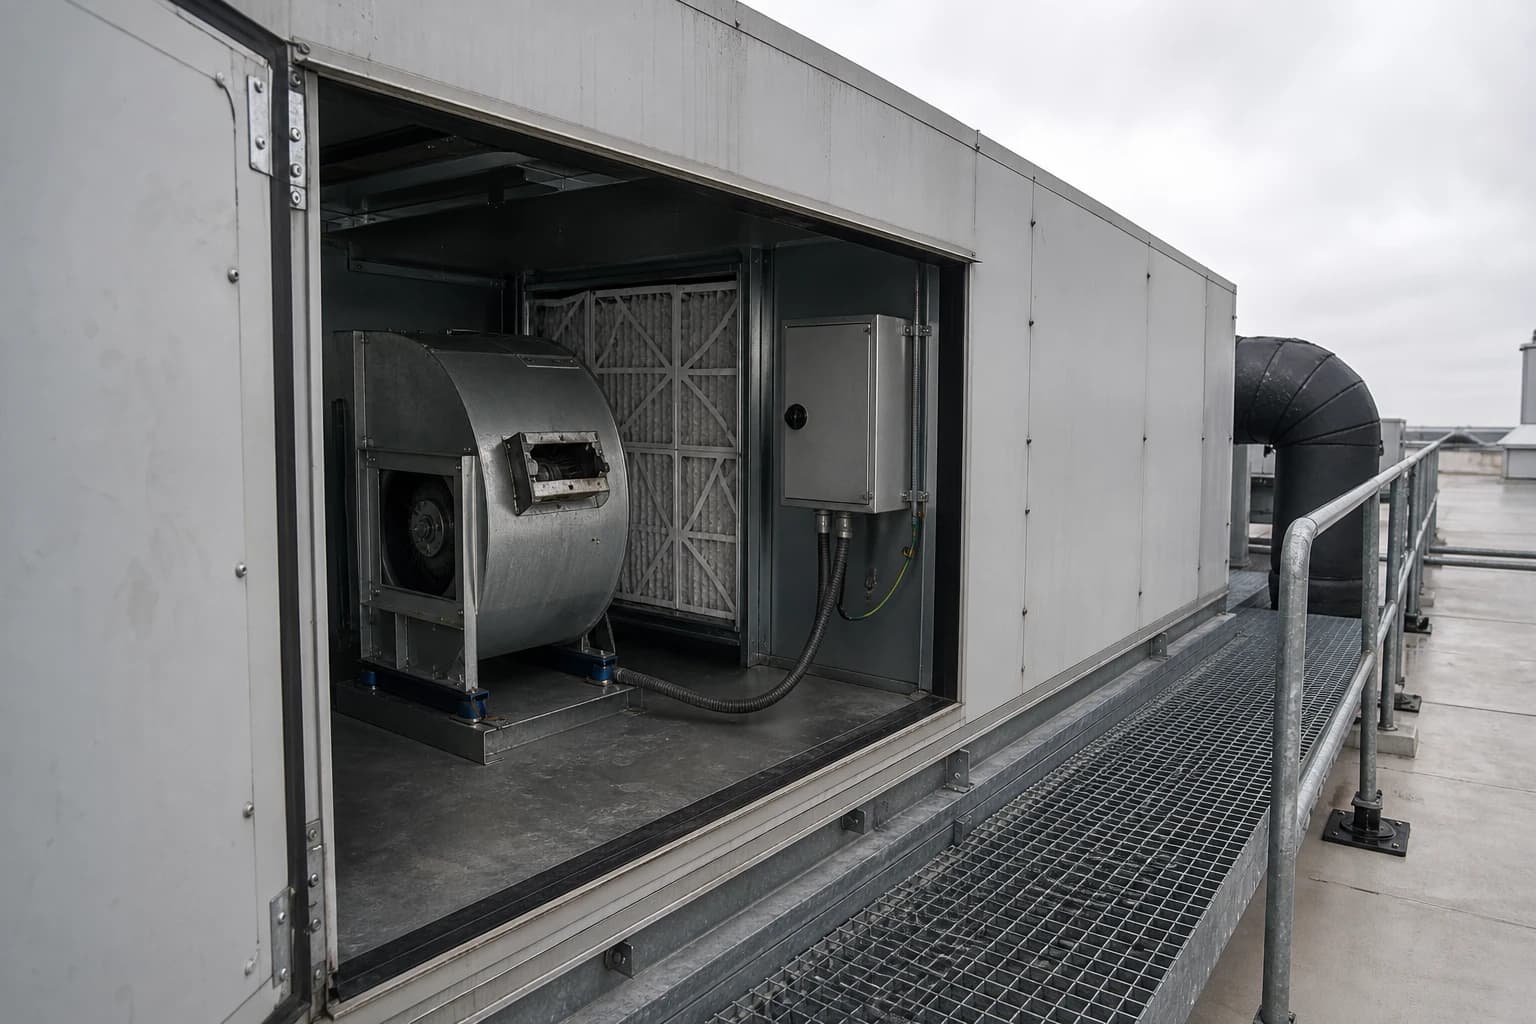
Industry cleanroom benchmarks place HVAC at roughly 36% to 67% of facility energy consumption. For many sites, this makes air systems the first priority for detailed modelling. Steam generation, purified-water and WFI systems, refrigeration, compressed air and process equipment can then be modelled as connected utility systems rather than isolated meters on an estate dashboard.
Why GMP changes the energy-modelling brief
Product protection defines the operating boundary
GMP places environmental control ahead of a simple energy target. EU GMP Annex 1 requires facilities to maintain appropriate cleanroom conditions in operation, with controls justified scientifically and linked to contamination control.
An energy model must distinguish between:
- Product-critical rooms, where airflow, pressure, temperature, humidity and filtration protect the product
- Containment areas, where directional airflow may control potent, sensitising or hazardous materials
- Support spaces, including corridors, plant rooms, warehouses and offices
- Idle, campaign-change and shutdown states, where a different validated operating envelope may apply
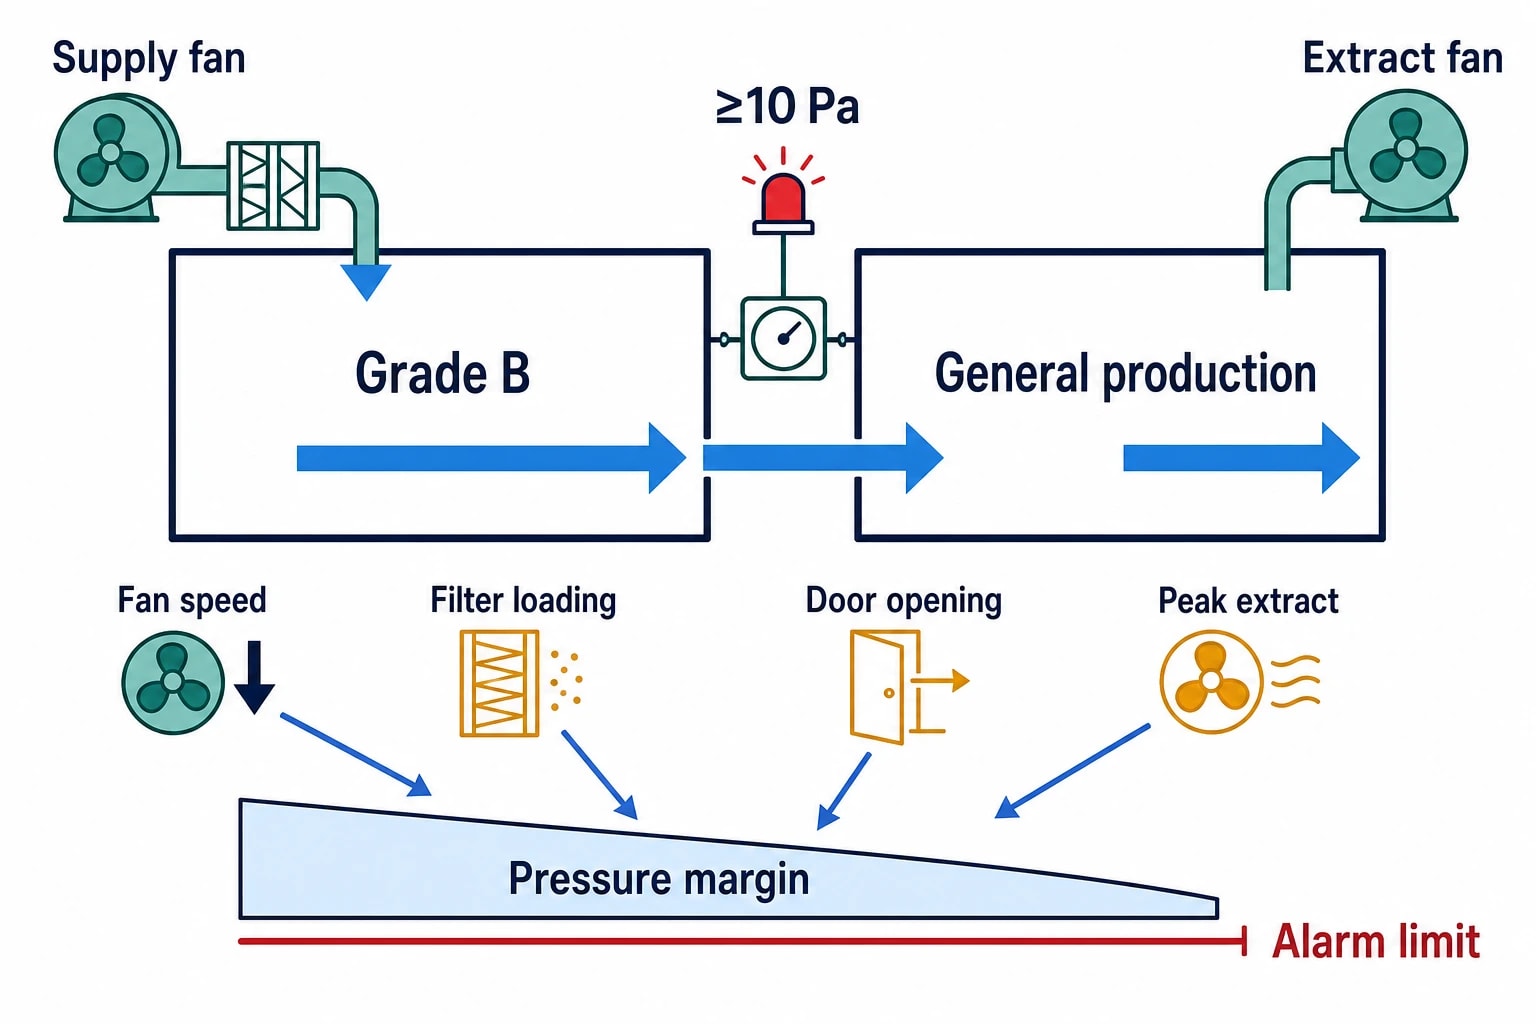
The model should represent these areas individually where their air systems, pressure relationships or schedules differ. Combining a Grade B filling background with general production space in one thermal zone hides risk and produces an unreliable savings estimate.
EU GMP Annex 1 requires critical pressure differences to be continuously monitored and recorded. The model must treat pressure set points and alarm limits as operating constraints. A proposed fan-speed reduction may look attractive in annual kWh terms but remain unsuitable if it erodes the margin needed to hold the pressure cascade through filter loading, door opening or peak extract demand.
Qualification is part of the engineering case
Annex 1 requires cleanroom and clean-air equipment qualification to include, where relevant, airflow volume and velocity, room pressure differences, airflow direction and visualisation, temperature, relative humidity, recovery and filter integrity. It also specifies requalification intervals of no more than six months for Grade A and B areas and 12 months for Grade C and D areas.
This evidence provides a strong basis for an energy model. It gives the engineering team measured airflow, pressure and environmental data that can anchor assumptions rather than relying on design values from old drawings.
The model should make the compliance consequence of each option explicit. A change to HVAC operating parameters can require change control, documented risk assessment and targeted requalification. For a classified area, the post-change plan may include airflow-volume measurement, pressure-difference verification, particle classification, smoke studies or recovery testing, according to the site’s risk assessment and approved protocol.
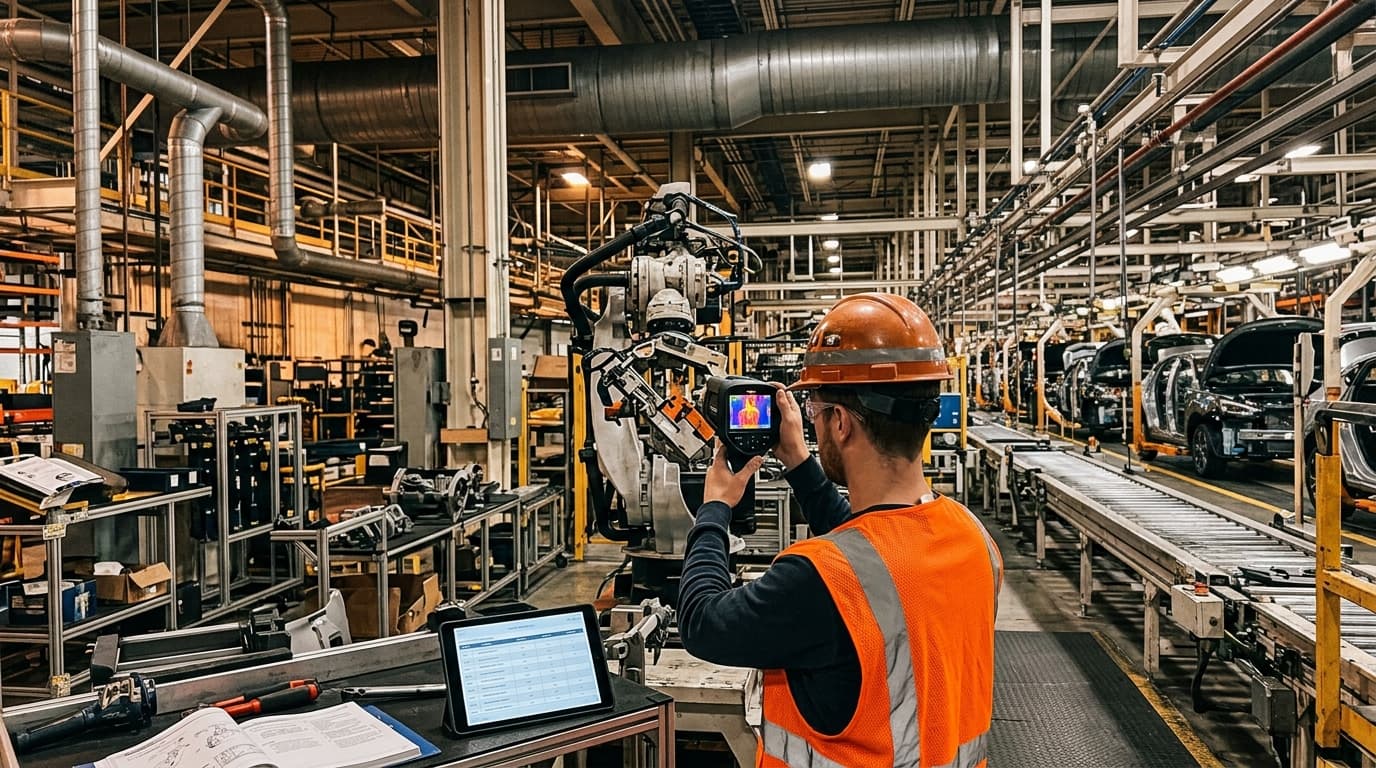
Identify where your plant is losing energy and quantify the savings potential — our audits map every heat source, sink, and waste stream in your facility.
What a calibrated pharmaceutical energy model contains
Utility data must describe production reality
Monthly electricity and gas invoices identify the scale of consumption. They cannot explain why a plant used that energy. A useful energy model brings together interval data, plant measurements and production context.
The starting data set normally includes the following.
| System | Inputs that improve the model | GMP and operational relevance |
|---|---|---|
| HVAC and cleanrooms | Supply, return and extract airflow; fan power; chilled-water and heating-coil load; room pressure; temperature and humidity | Links energy to classified-room conditions and pressure cascade |
| Steam and clean steam | Boiler fuel, steam flow, condensate return, pressure, blowdown and load profile | Separates clean-steam sterilisation demand from heating and process steam |
| WFI and purified water | Feedwater, reject flow, loop temperature, circulation rate, sanitisation cycles and distribution losses | Captures continuous circulation and water-quality operating requirements |
| Refrigeration | Compressor power, suction and condensing conditions, evaporator duty, defrost and chamber schedules | Connects stability storage and process cooling to actual ambient and product demand |
| Process equipment | Batch timings, equipment power, vessel heating or cooling duty, CIP and SIP cycles | Prevents production-volume changes being mistaken for energy savings |
| Site context | Outdoor dry-bulb temperature, humidity, production calendar and occupancy | Explains weather-sensitive and schedule-sensitive energy use |
The model also needs a clear hierarchy of measurement confidence. Revenue meters establish site totals. Submeters and temporary power analysers allocate consumption to systems. Flow, temperature and pressure measurements convert utility use into an operating picture. Maintenance records, filter-change dates and deviation reports can explain shifts that raw meter data cannot.
A model cannot credibly represent a WFI loop if it excludes its constant circulation temperature, sanitisation regime and demand pattern. Equally, a cleanroom model needs actual fan duty, not only design airflow from the original handover file.
Calibration turns a calculation into an audit tool
Calibration means adjusting only justified assumptions until the model reproduces measured energy use and key operating conditions over a defined period. The objective is traceability.
For pharmaceutical facilities, calibration should test more than annual kWh. It should compare modelled and measured results by month, day type and, where data permits, production state. A model that matches annual electricity use while missing summer dehumidification, night-setback loads or steam peaks is poorly suited to evaluating an HVAC change.
A practical calibration review asks:
- Does the model reproduce site electricity, gas and fuel totals over the chosen baseline period?
- Does it reproduce main system loads, including air-handling units, chillers, boilers and refrigeration plant?
- Does it follow documented production campaigns, cleaning cycles and shutdowns?
- Does it retain measured pressure, temperature and humidity requirements for classified areas?
- Can the team explain material gaps with evidence rather than unexplained adjustment factors?
This produces an auditable baseline for energy projects and regulatory change control.
Modelling HVAC without weakening cleanroom control
Airflow reduction requires evidence, not a rule of thumb
Fan energy rises sharply with airflow, making unnecessary air volume an obvious target. Yet air-change rates are part of the GMP control strategy. They interact with particle control, heat loads, humidity, pressure stability, containment and recovery after disruption.
The energy model should establish why each air system operates at its current supply and extract volumes. The answer may be cleanroom classification, thermal loads from process equipment, moisture removal, door-opening frequency, extract hoods, containment requirements or a historic setting with no current justification.
EU GMP Annex 1 requires a minimum 10 Pa guidance pressure difference between adjacent rooms of different grades, subject to containment needs. It also requires critical air-pressure differences to be continuously monitored and recorded. A modelled change should therefore test normal operation, maximum extract operation, filter-loading conditions, door events and relevant failure scenarios.
Potential measures include revised validated airflow set points, variable-speed fan control, pressure-reset strategies, reduced simultaneous heating and cooling, improved coil control and heat recovery from suitable exhaust streams. Each measure needs a defined scope. Recirculated, exhaust and supply air may carry different contamination and containment risks.
Humidity and reheat often hide the real load
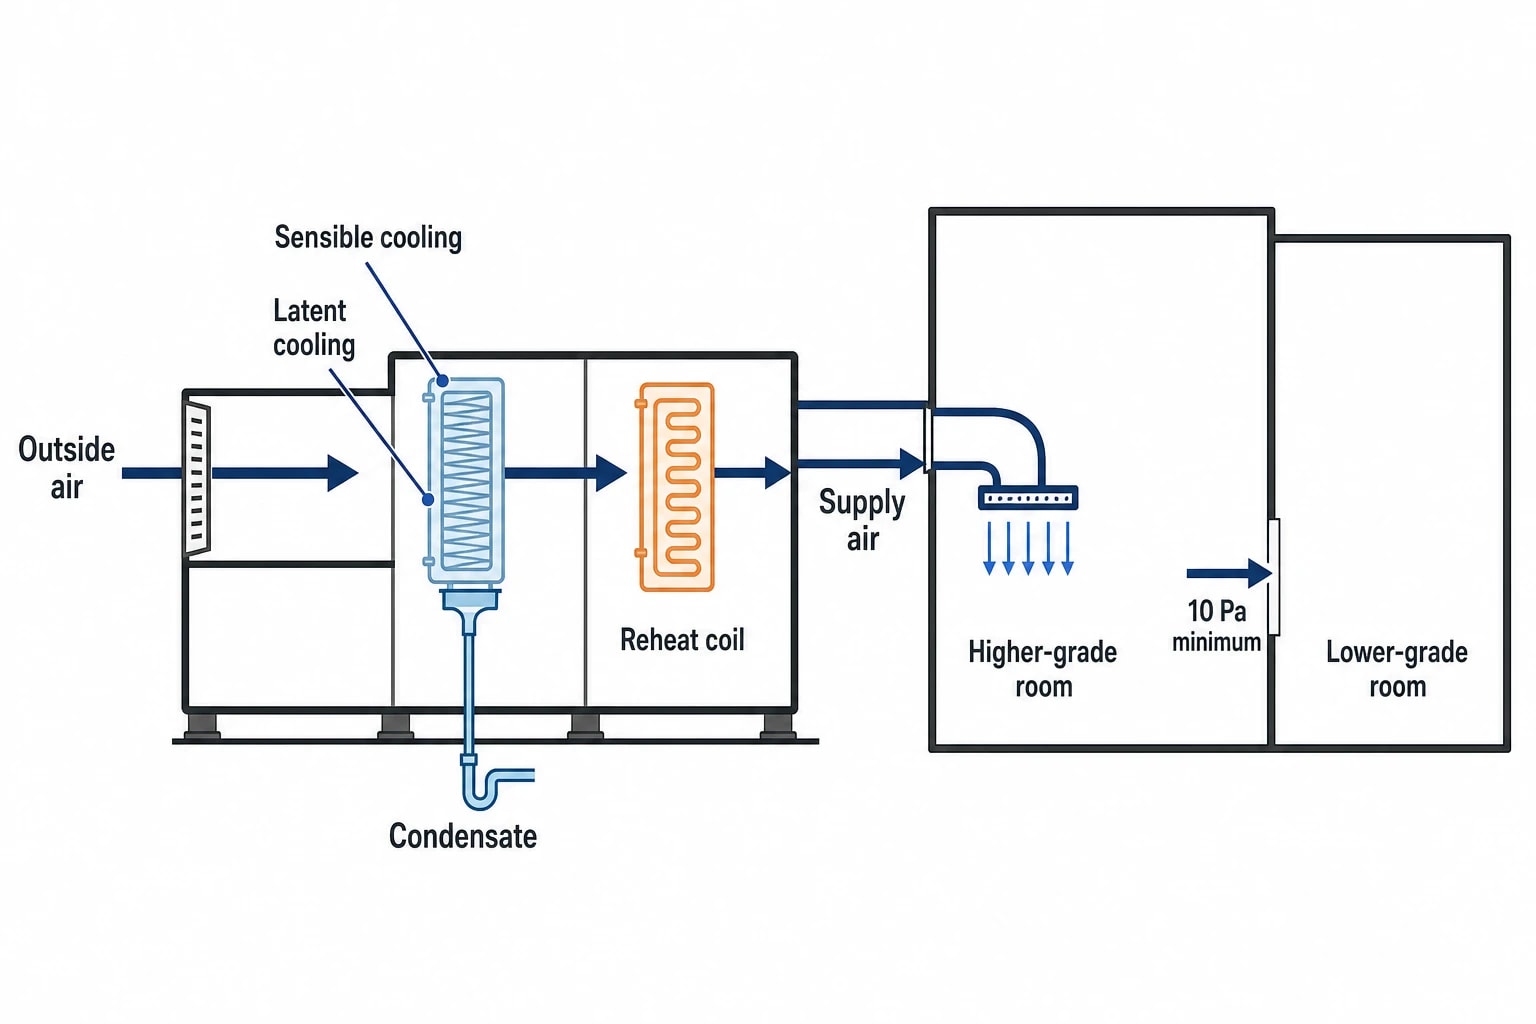
A UK pharmaceutical air-handling unit may cool outside air below its supply-air dew point to remove moisture, then reheat it to meet room temperature. This can consume chilled water and heat at the same time, often dominating the summer utility profile.
The model should separate sensible cooling, latent cooling and reheat. It should also represent external humidity, not only dry-bulb temperature. Otherwise, it will understate the value of coil-control tuning, heat recovery, supply-air reset within approved limits or changes to outside-air treatment.
The permitted outcome remains bounded by the room’s qualified environmental conditions. Annex 1 also requires airflow visualisation studies to demonstrate that air does not pass from less-clean areas towards higher-grade areas. An energy model can identify a preferred operating point, but it cannot replace that verification.

Identify where your plant is losing energy and quantify the savings potential — our audits map every heat source, sink, and waste stream in your facility.
Modelling WFI, clean steam and thermal utilities
Continuous circulation creates a permanent energy load
WFI systems can consume energy well beyond the point of generation. EU GMP Annex 1 states that WFI should be stored and distributed in a way that minimises microbial growth, giving constant circulation above 70°C as an example. The loop, storage tank, pumps, heat exchangers and insulation create a continuous thermal load that should be modelled together.
The model should identify:
- Generation method and feedwater demand
- Distribution-loop and return temperatures
- Circulation-pump electricity
- Heat losses from tanks, valves, pipework and accessible plant-room sections
- Sanitisation or regeneration cycles
- Point-of-use demand by process, washdown, laboratory or sterilisation activity
- Reject-water and cooling-water demand where applicable
Insulation repairs, condensate recovery, reduced heat loss, pump optimisation and better matching of generation to demand can offer savings. However, the engineering case must preserve the approved water-quality control strategy and routine monitoring arrangements.
Utilities require seasonal and contact-risk assessment
EU GMP Annex 15 places utility qualification in section 7. It requires the period and extent of qualification to reflect seasonal variation and intended use. It also requires a risk assessment where HVAC may directly contact product, or where indirect contact can occur through heat exchangers.
These requirements matter when the model identifies changes to boiler operation, clean-steam generation, WFI temperature control, chilled-water temperatures or heat recovery. A heat exchanger that improves plant efficiency also creates a potential failure path that must be assessed according to its process duty, separation integrity, monitoring and maintenance controls.
The site should model winter, summer and high-production conditions rather than assuming one representative week will support a qualification decision. Seasonal ambient conditions alter dehumidification, cooling-tower performance, chiller lift, steam demand and refrigeration capacity.
From modelled opportunity to IQ/OQ/PQ evidence
Put energy measures through formal change control
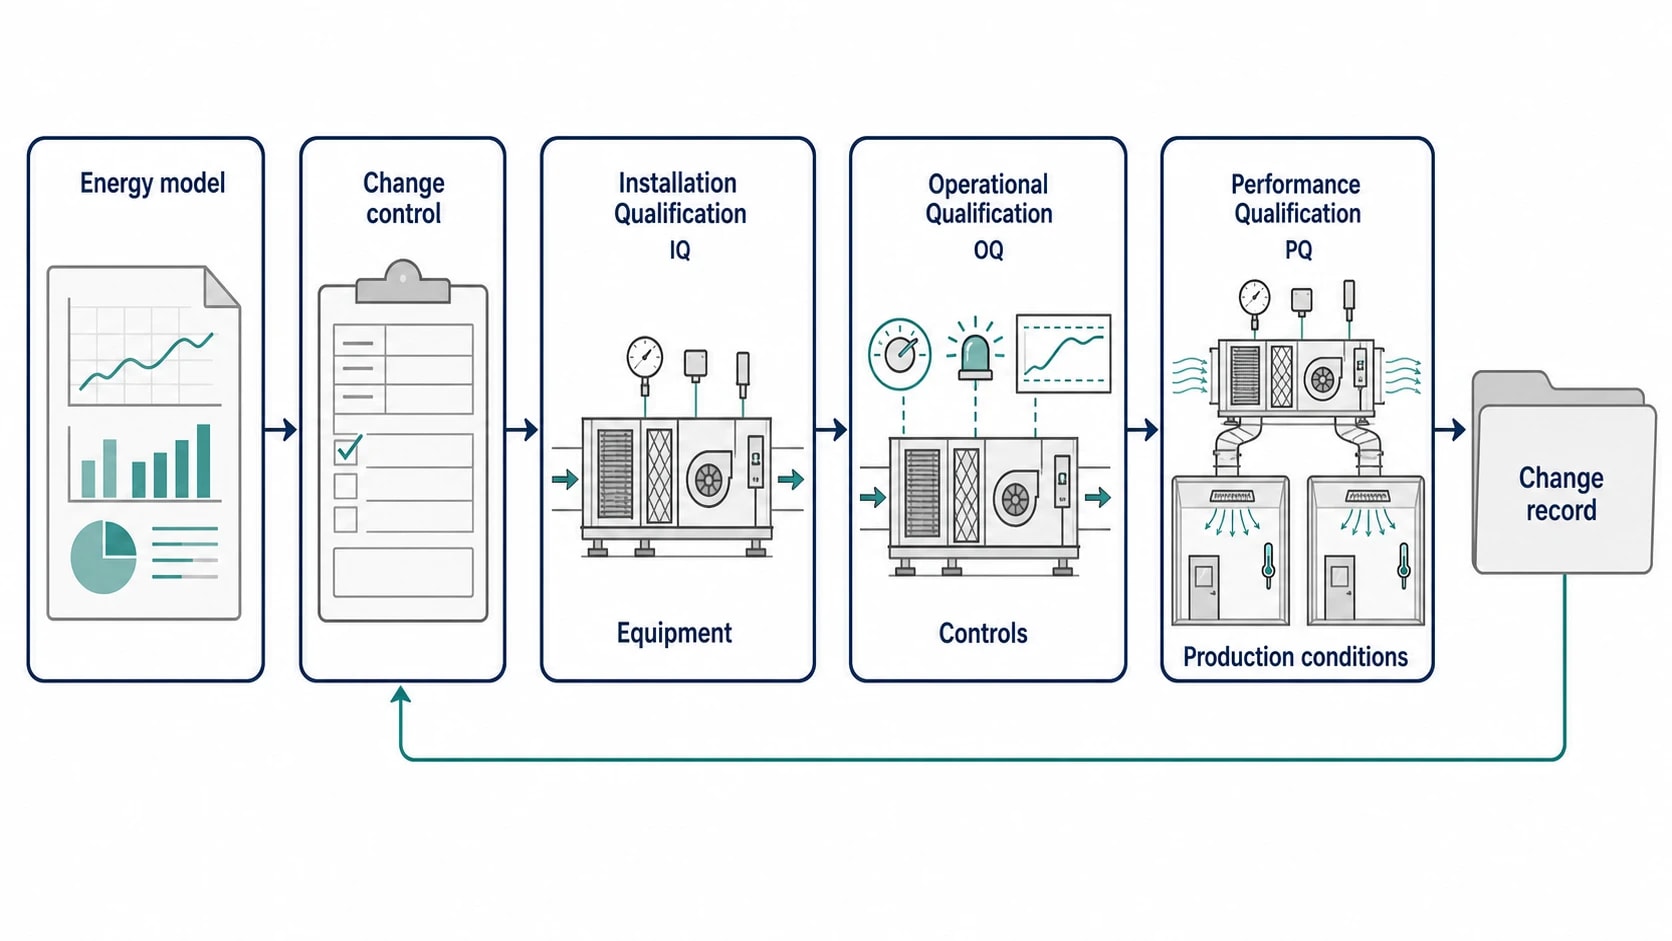
Energy-efficiency measures affecting GMP utilities should enter the same formal change-control route as other facility changes. The model provides the rationale, predicted energy effect and proposed operating conditions. Quality, engineering, operations and relevant subject-matter experts then determine the verification needed before release.
A typical package includes an approved change request, risk assessment, impact assessment against the contamination-control strategy, updated drawings and set-point records, test protocols, acceptance criteria, training records and a final report.
The language of IQ, OQ and PQ keeps the work structured:
- Installation Qualification confirms that the approved equipment, instruments, wiring, software configuration and documentation are in place.
- Operational Qualification demonstrates that controls, alarms, interlocks and operating ranges perform as intended.
- Performance Qualification demonstrates performance under representative production conditions, including environmental or utility attributes relevant to product quality.
For an air-handling change, OQ may test fan control, pressure alarms and set-point response. PQ may then assess room pressures, airflow, temperature, humidity, particle conditions and recovery under the defined operating state. The exact protocol should follow the site’s risk assessment and approved quality procedures.
Measurement and verification closes the loop
The model’s predicted savings must be separated from changes in weather, production volume, operating hours and product mix. This is where measurement and verification becomes valuable.
EnerTherm Engineering’s seven-step audit methodology begins with consultation and on-site assessment, including power analysis, ultrasonic leak detection and thermal imaging. It then uses energy modelling to analyse the evidence, identify conservation measures, prepare the report, support implementation and maintain ongoing monitoring. An IPMVP-aligned measurement and verification plan can define the baseline period, meter boundaries, adjustment factors, reporting interval and acceptance method before work begins.
For a variable-speed air-handling project, the measurement boundary might include fan power, supply and extract airflow, room pressure and associated heating or cooling energy. For a steam project, it may include boiler fuel, steam flow, condensate return and production-cycle data. The strongest projects retain the GMP and energy evidence in the same change record.
Energy modelling for ESOS and ISO 50001
A defensible baseline supports ESOS Phase 4
The UK Energy Savings Opportunity Scheme applies to qualifying organisations and covers energy used by buildings, industrial processes and transport. ESOS Phase 4 compliance is due on 5 December 2027.
A pharmaceutical-site energy model can provide the technical backbone for the industrial-process part of the assessment. It gives an assessor a traceable allocation of electricity and fuel to cleanroom HVAC, refrigeration, steam, WFI, clean steam and process equipment. It also shows the assumptions behind each opportunity rather than presenting a generic percentage reduction.
The ESOS evidence pack benefits from a documented baseline, site-visit records, metering data, calculation assumptions, opportunity register and records of implemented measures. Current government guidance confirms that ESOS assessments are undertaken every four years and must cover relevant energy uses within scope.
Use the model as a living management tool
ISO 50001:2018 provides a framework for managing energy performance. For a GMP facility, the model can support energy review, energy performance indicators, objectives and operational control without bypassing pharmaceutical quality controls.
The model should be updated after significant facility changes, new process lines, revised campaigns, major maintenance or utility upgrades. It should also be reviewed against actual consumption at planned intervals. This keeps the baseline useful when the plant changes, rather than leaving a static audit report that no longer resembles the operating site.
This article reflects the independent analysis and editorial opinion of EnerTherm Engineering. Product names, trademarks, and brands mentioned belong to their respective owners. EnerTherm Engineering is not affiliated with, endorsed by, or a licensee of any third-party software or product mentioned unless explicitly stated.

Managing Director — EnerTherm Engineering
Dr. François Pierrel is Managing Director of EnerTherm Engineering with over two decades of expertise in thermal design, heat transfer, and industrial energy optimisation. He holds a PhD in Heat Transfer from Cranfield University and a Post-Doctorate from Heriot-Watt University.
