
How Manufacturers Cut Energy Costs Per Tonne with EnPIs
ISO 50001 EnPIs link utility use to output, with typical savings of 15-25%.
The UK Government closed the Industrial Energy Transformation Fund to new applicants in April 2025, leaving manufacturers to make efficiency investment cases on the strength of their own production and utility data. For many plants, the most useful measure is energy cost per tonne of saleable output.
A factory can reduce its monthly energy use while its cost per tonne rises. Lower production volume, longer changeovers, rejected material, poor run-time or a higher proportion of difficult product grades can all push energy intensity upwards. Monthly invoices cannot separate those effects. Energy performance indicators, or EnPIs, can.
For plant managers, operations directors and energy managers, the purpose is practical. An EnPI shows how much energy and utility spend production requires under defined operating conditions. It turns avoidable consumption into a production issue with a financial value.
ISO 50001:2018 provides the management-system framework for improving energy performance. ISO 50006:2023 gives guidance on establishing, using and maintaining EnPIs and energy baselines. Together, they support a disciplined method for reducing manufacturing energy costs without confusing lower output with genuine efficiency improvement.
Why energy cost per tonne is a better manufacturing measure
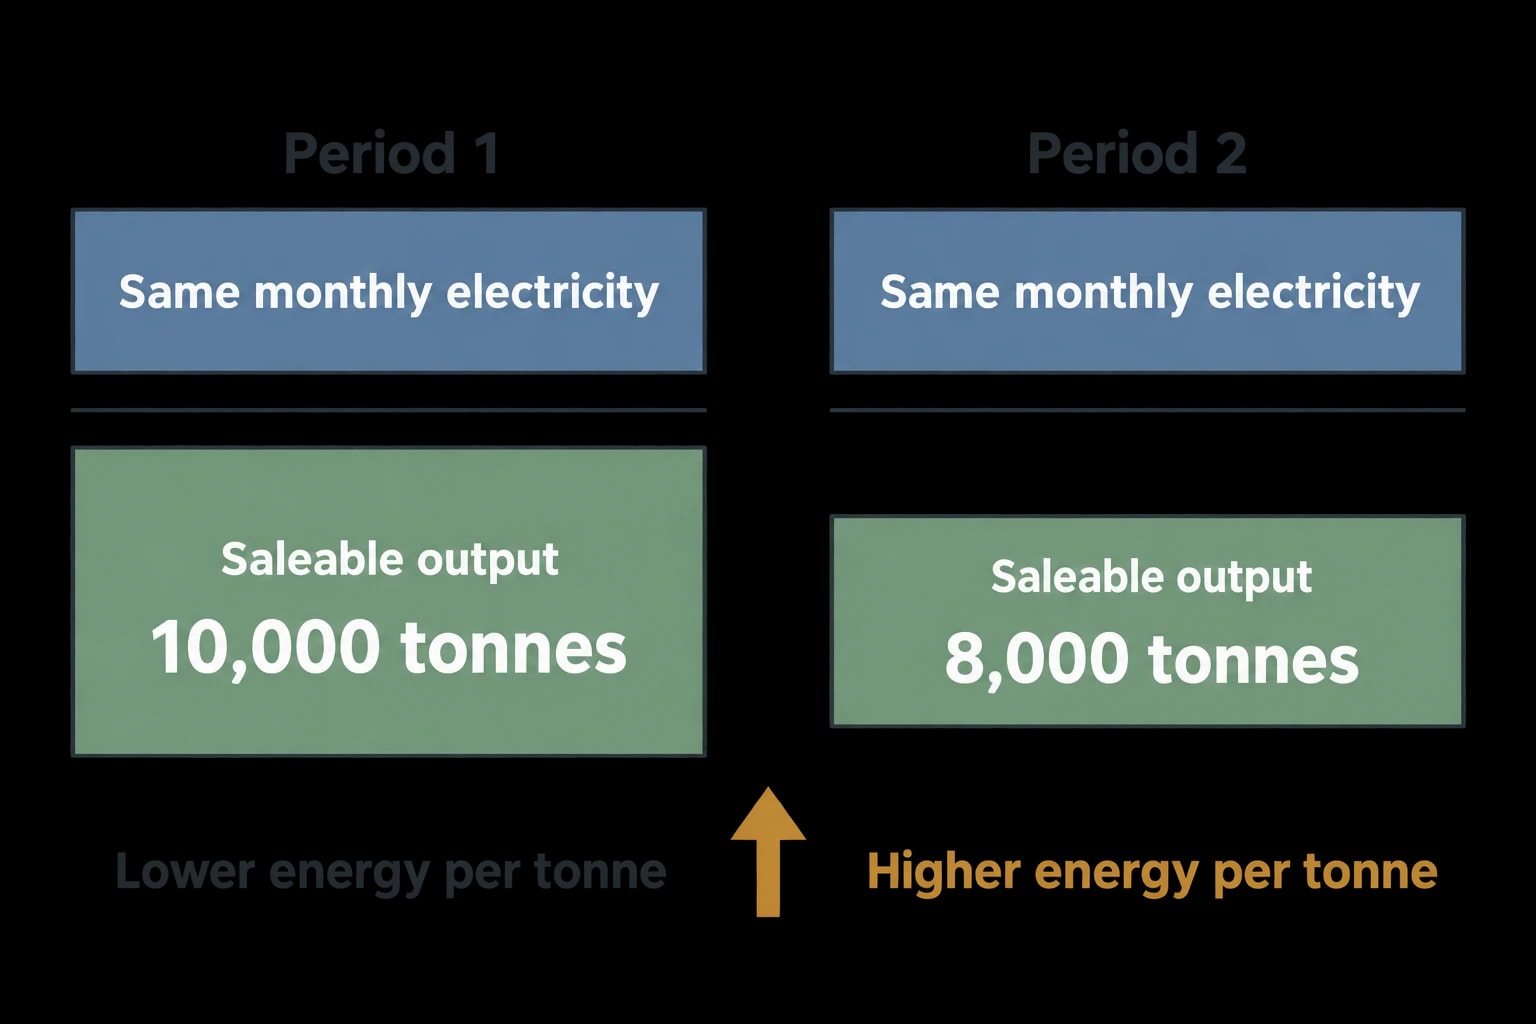
A utility invoice records expenditure. It does not identify which line, grade, shift or operating condition created it.
Consider a site that uses the same monthly electricity volume in two periods. In the first, it produces 10,000 tonnes of saleable product. In the second, it produces 8,000 tonnes after repeated short stops, heat-up cycles and additional scrap. Site consumption looks stable, yet each tonne of good output carries a larger share of energy cost.
Cost per tonne makes that deterioration visible. It connects electricity, gas, steam, compressed air, water and oil to the production denominator that pays for them.
Consumption and energy performance answer different questions
Consumption answers how much energy a site used. Energy performance answers how effectively the site used it in relation to output and the conditions affecting that output.
A useful manufacturing EnPI distinguishes between:
- Higher energy use caused by higher output.
- Higher energy intensity caused by downtime, poor control or deteriorating equipment.
- Higher cost caused by tariff timing, peak demand or fuel-price exposure.
- Legitimate changes caused by grade, moisture, batch size, ambient conditions or cleaning requirements.
A site-wide kWh-per-tonne figure gives senior management a useful headline. It rarely tells a production team what to fix. Action comes from splitting the figure by utility, process, line, product family, grade, shift and production state.
Cost allocation makes waste visible to the right team
Energy waste often sits between process operations and plant engineering. A compressor may run longer because of a leak. A furnace may consume extra fuel during extended warm-up. A rejected batch may carry the full energy burden of production but contribute no saleable output.
Cost per tonne creates a common basis for decision-making. Maintenance can quantify the cost of leakage. Production can see the energy consequence of an overlong changeover. Finance can compare a proposed investment against a measured baseline rather than a broad annual estimate.
Omni Vision delivers turnkey utility metering, CO2 tracking, and AI-powered production KPI intelligence — giving you real-time dashboards and actionable insights across your entire facility.
Build EnPIs around good output and controllable energy use
An EnPI is a measure used to quantify energy performance. It may be a straightforward ratio, a regression model or a calculation suited to the process. The appropriate form depends on the factors that drive energy demand.
For many manufacturers, total utility cost per tonne of good product is the main commercial EnPI. It should sit alongside physical EnPIs such as electricity per tonne, gas per tonne, steam per tonne and compressed-air electricity per tonne.
Select the right production denominator
The denominator needs the same governance as the meter data. Gross tonnes can conceal scrap-related waste. Tonnes despatched can distort results where finished-goods stock changes materially. A plant should use an output measure that represents the energy-consuming process and apply it consistently.
| Manufacturing activity | Suitable denominator | Data control |
|---|---|---|
| Bulk materials | Saleable tonnes produced | Record off-spec material and rework separately |
| Food and beverage | Good batches, litres or packed tonnes | Identify cleaning and product-change cycles |
| Chemicals | Tonnes of on-spec product | Segment grades and campaign production |
| Metals and minerals | Tonnes processed or cast | Record starts, planned stops and furnace holding periods |
| Converting operations | Good metres, tonnes or units | Exclude scrap from saleable output |
Where a line makes materially different products, one overall denominator can hide poor performance. A plant making thick and thin grades, for example, should hold separate EnPIs where their normal energy demand differs. Comparison then remains fair and operationally useful.
Measure physical and financial intensity separately
Physical intensity and cost intensity are related but distinct measures.
A rise in kWh per tonne points towards process performance, equipment condition or operating practice. A rise in electricity cost per tonne while kWh per tonne remains steady points towards the cost of supply, demand peaks or production timing. Each requires a different response.
A practical metric set includes:
- Electricity consumption and cost per tonne.
- Gas consumption and cost per tonne.
- Steam generated and supplied per tonne.
- Compressed-air electricity per tonne.
- Water consumption and wastewater cost per tonne where product loss increases load.
- Total utility cost per tonne of good output.
- Scrap or reject quantity alongside the energy cost assigned to that production run.
For cost allocation, plants should retain interval energy data and apply the applicable unit price, demand charges and fixed charges according to an agreed rule. Finance and engineering need the same costing method each month. Changing it without documenting the change destroys comparability.
Establish an energy baseline before promising savings
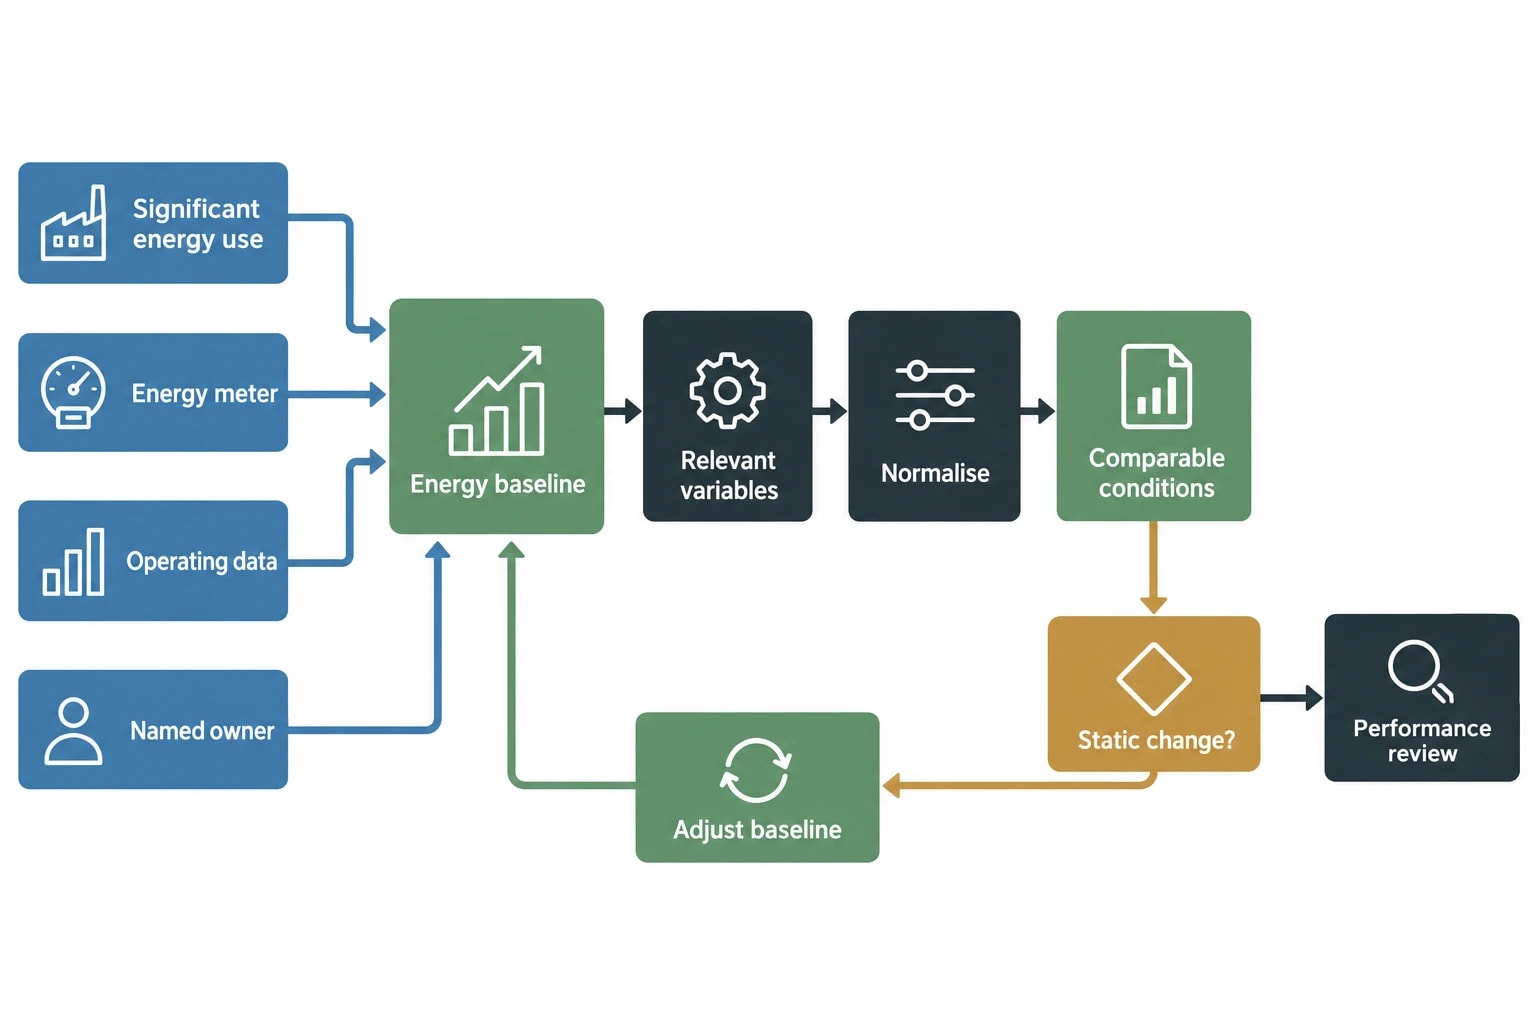
An energy baseline, or EnB, is the documented reference value used to assess performance improvement. It supports investment approval, operational review and post-project verification.
A poor baseline can make normal production variation look like a saving. It can also conceal a real gain after product mix or operating hours change.
Define the metering and process boundary
Start by mapping significant energy uses: processes, systems or equipment that consume substantial energy or offer material improvement potential.
Typical manufacturing boundaries include incoming electricity and gas, major production lines, thermal equipment, boilerhouses, compressed-air systems, refrigeration, pumping and water treatment. Each boundary needs:
- A reliable energy meter or defensible allocation method.
- A verified production or operating-state data source.
- A named owner able to investigate performance changes.
Metering should answer a decision, rather than collect data for its own sake. A sub-meter on a dryer is valuable if it can distinguish normal drying demand from excess heat, unplanned idle operation or a change in moisture content. It adds little if nobody uses the result to alter maintenance or production practice.
Account for relevant variables
Production output is usually the dominant driver of energy use, but it is seldom the only one. ISO 50006:2023 recognises that relevant variables can affect energy performance. In manufacturing, these may include product grade, incoming moisture, batch size, operating hours, ambient temperature, line speed and planned cleaning cycles.
A flat site target can penalise a team running a difficult mix. Segmented EnPIs avoid that problem. Compare one product family with its own baseline, on the same line, under comparable process conditions.
Static changes need separate treatment. A new line, major equipment replacement or permanent capacity expansion may require an adjusted baseline. Record the date, equipment affected, reason for the change and method used. Otherwise, the plant risks treating a structural change as an operational saving.
Track energy consumption, emissions, and process parameters with seamless PLC/SCADA integration via Modbus, OPC-UA, and MQTT protocols.
Use diagnostic tests to find waste behind a rising EnPI
A useful EnPI identifies a deviation. The next task is to prove the source, quantify its cost and assign action.
Test idle and low-load energy use
Measure a line’s idle demand during planned non-production periods, after the process has reached its defined safe idle state. Use consistent windows, such as 30-minute intervals after normal product output has stopped, and exclude known maintenance work or plant warm-up.
Compare that idle profile with the baseline for equivalent stopped periods. A practical site rule is to investigate when the same area exceeds its normal idle energy by more than 10% across three comparable stoppages, or when idle energy represents more than 5% of weekly energy use. These are management screening limits, not universal engineering limits. Each site should set tighter or looser limits from its historical distribution and operating risk.
Calculate the annualised cost by multiplying the excess kWh in each verified idle period by the relevant electricity cost, then by the expected number of equivalent periods in a year. Include any demand-charge effect where the extra load occurs during the charging window.
This directs teams towards specific actions: switch-off sequencing, extraction run-on times, compressor pressure control, unnecessary circulation pumps or heat-maintenance systems operating through extended stops.
Measure the cost of changeovers and failed starts
For each product family, record energy from the last good unit of the outgoing product until the first good unit of the next. Capture time, electricity, gas, steam, compressed air, water, rejected material and the stated reason for any delay.
Use the median result for comparable product transitions as the reference. Investigate any changeover that consumes more than 20% above that reference or takes materially longer without an approved process reason. A failed start deserves its own event record because its energy cost belongs to no saleable output.
The cost impact is the excess utility consumption above the comparable changeover baseline, multiplied by the applicable utility price, plus the energy embodied in scrap or off-spec product. That figure helps managers choose between process sequencing, preheat timing, operator procedure, setpoint review and equipment repair.
Detect deteriorating thermal performance early
Thermal equipment should be compared on like-for-like runs. For a dryer, compare energy per tonne within the same moisture band, product grade and throughput range. For a boilerhouse, compare fuel use per tonne of steam against comparable load and feedwater conditions. For a furnace, compare fuel or electricity per tonne against the same product and operating schedule.
Set an investigation trigger from the operating baseline. For example, three consecutive comparable batches that exceed the baseline by 10% should prompt an equipment and process review. The review should check insulation and refractory condition, steam traps, condensate return, heat-exchanger cleanliness, combustion settings, air ingress, leakage, temperature control and residence time.
Annualise the loss from the measured excess per tonne, rather than from a nameplate-efficiency assumption. If an oven uses an additional 6 kWh per tonne over its matched baseline and produces 20,000 comparable tonnes annually, the plant can value 120,000 kWh of avoidable annual consumption at its actual electricity cost. This produces a clearer maintenance priority than a generic statement about thermal losses.
Turn EnPI evidence into a cost-benefit decision
An energy project deserves approval when its business case reflects production conditions, installation risk and confidence in the savings estimate. Capital price alone is a poor ranking tool.
The Industrial Energy Transformation Fund supported energy-efficiency and decarbonisation projects where applicants could identify site-level benefits. Although the fund has closed to new applicants, its investment discipline remains useful. A sound proposal identifies the incremental improvement delivered by a defined equipment or process change.
Rank opportunities by value, confidence and disruption
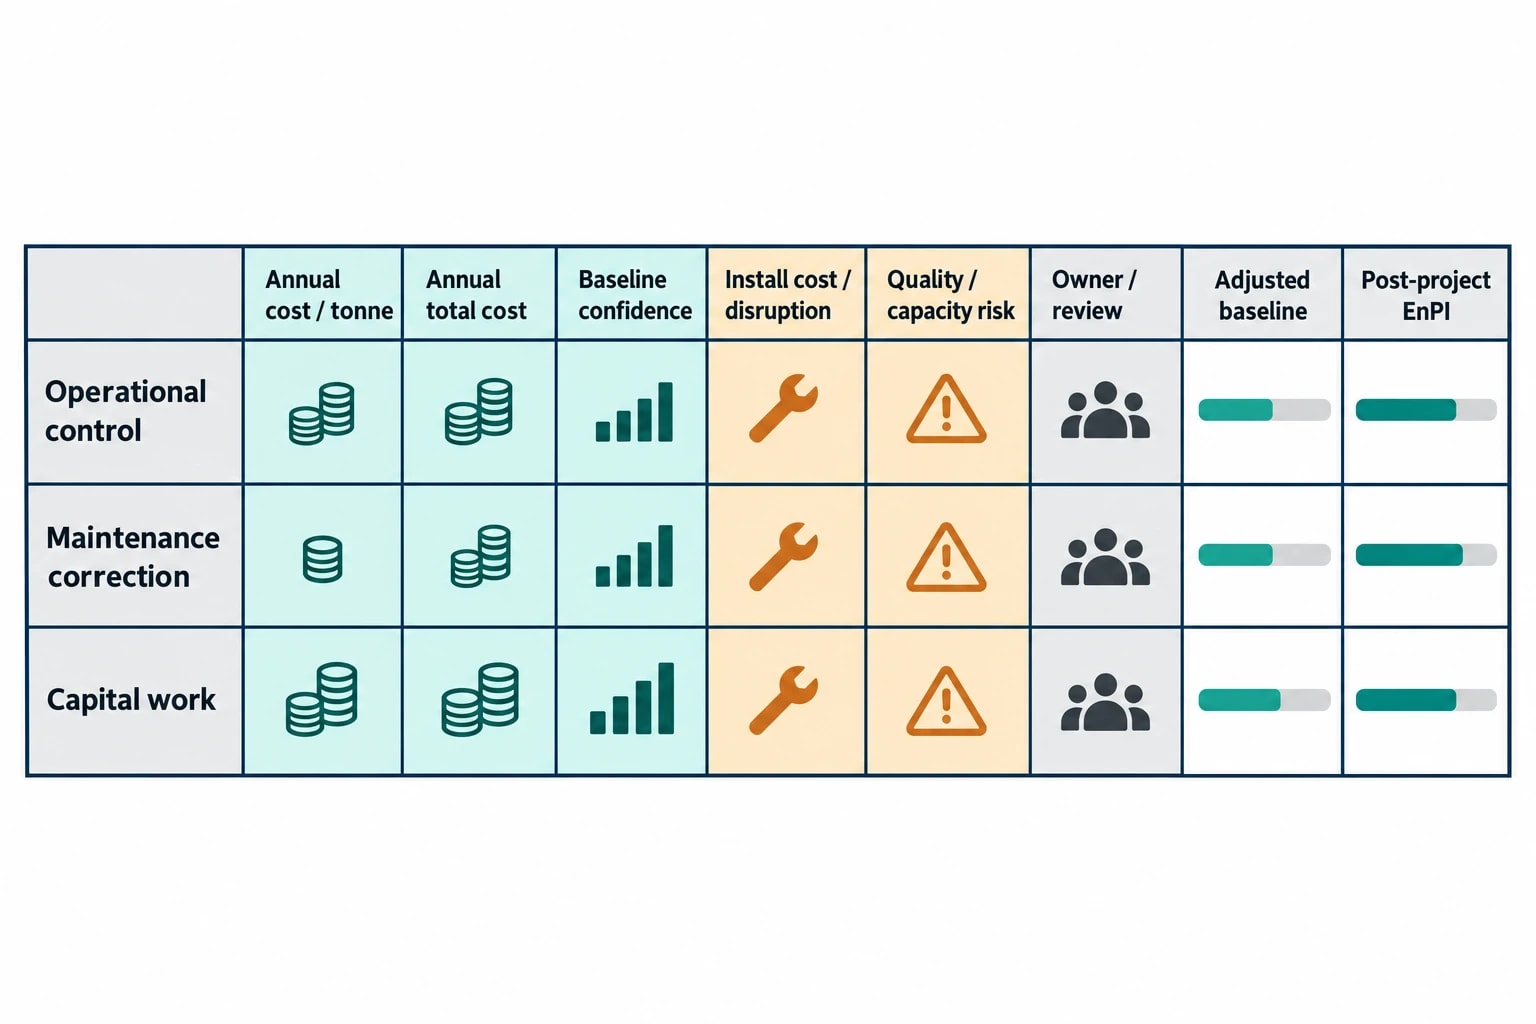
A project register should distinguish between operational controls, maintenance corrections and capital work.
Operational controls may require little capital but depend on sustained discipline. Maintenance corrections can remove a clear performance loss, such as failed steam traps or poor compressor control. Capital projects can deliver a durable reduction where existing equipment cannot meet the required energy intensity or reliability.
Rank each opportunity using:
- Expected annual reduction in utility cost per tonne.
- Expected annual reduction in total utility cost.
- Confidence in the measured baseline and forecast.
- Installation cost and planned production disruption.
- Product-quality or capacity risk.
- Responsible owner and verification date.
This avoids a common mistake: approving a large theoretical saving while leaving a smaller, well-proven loss unaddressed. A modest repair with a verified cost impact may offer greater certainty than a complex plant replacement based on broad assumptions.
Verify savings after commissioning
Commissioning does not prove savings. The plant should compare the post-project EnPI with the adjusted baseline under equivalent production conditions. It should also retain the data period, meter boundary, relevant variables, production denominator and evidence that product quality remained within specification.
This review protects the original return and identifies savings drift. Compressor-control improvements can erode when leaks return, loads are added or pressure setpoints rise. Thermal savings can disappear after process settings change. Regular EnPI review catches the movement while corrective action remains small.
Make energy cost per tonne part of daily production control
Manufacturers reduce energy costs when energy data reaches the people who can change process conditions, maintenance priorities and production scheduling.
A regular operating cycle is effective:
- Capture interval utility data and verified good-output data.
- Calculate EnPIs by line, shift, product family and process state.
- Compare results with matched baselines.
- Investigate defined deviations promptly.
- Assign a corrective action with an owner and due date.
- Verify the physical and financial result after the change.
This article reflects the independent analysis and editorial opinion of EnerTherm Engineering. Product names, trademarks, and brands mentioned belong to their respective owners. EnerTherm Engineering is not affiliated with, endorsed by, or a licensee of any third-party software or product mentioned unless explicitly stated.

Technical Manager — EnerTherm Engineering
John Naranjo is Technical Manager at EnerTherm Engineering, bringing specialist expertise in chemical and environmental engineering. He recently led the implementation of Omni Vision, EnerTherm's real-time energy and utility monitoring platform. He holds an MSc in Environmental Engineering from the University of Huelva and a BSc in Chemical Engineering, with memberships in both the Energy Institute and IChemE.
