
How to Calculate Cost per Tonne in Manufacturing
Match utility costs to accepted tonnes in one period for a reliable £/t KPI.
Cost per tonne in manufacturing is the total traceable utility cost assigned to a defined production boundary during a reporting period, divided by the accepted or released tonnes produced within that identical boundary and period.
The calculation is simple. A credible result depends on disciplined data rules. Electricity, gas, steam and compressed-air costs must relate to the same line, process area or site as the production tonnage. They must also cover the same hours, days or month.
A monthly site energy bill divided by total site output provides a high-level commercial figure. It does not explain which line, product family or operating condition created the cost. A stronger cost-per-tonne KPI gives plant managers, production engineers and finance teams a shared measure of energy cost against saleable output.
The cost-per-tonne formula for manufacturing
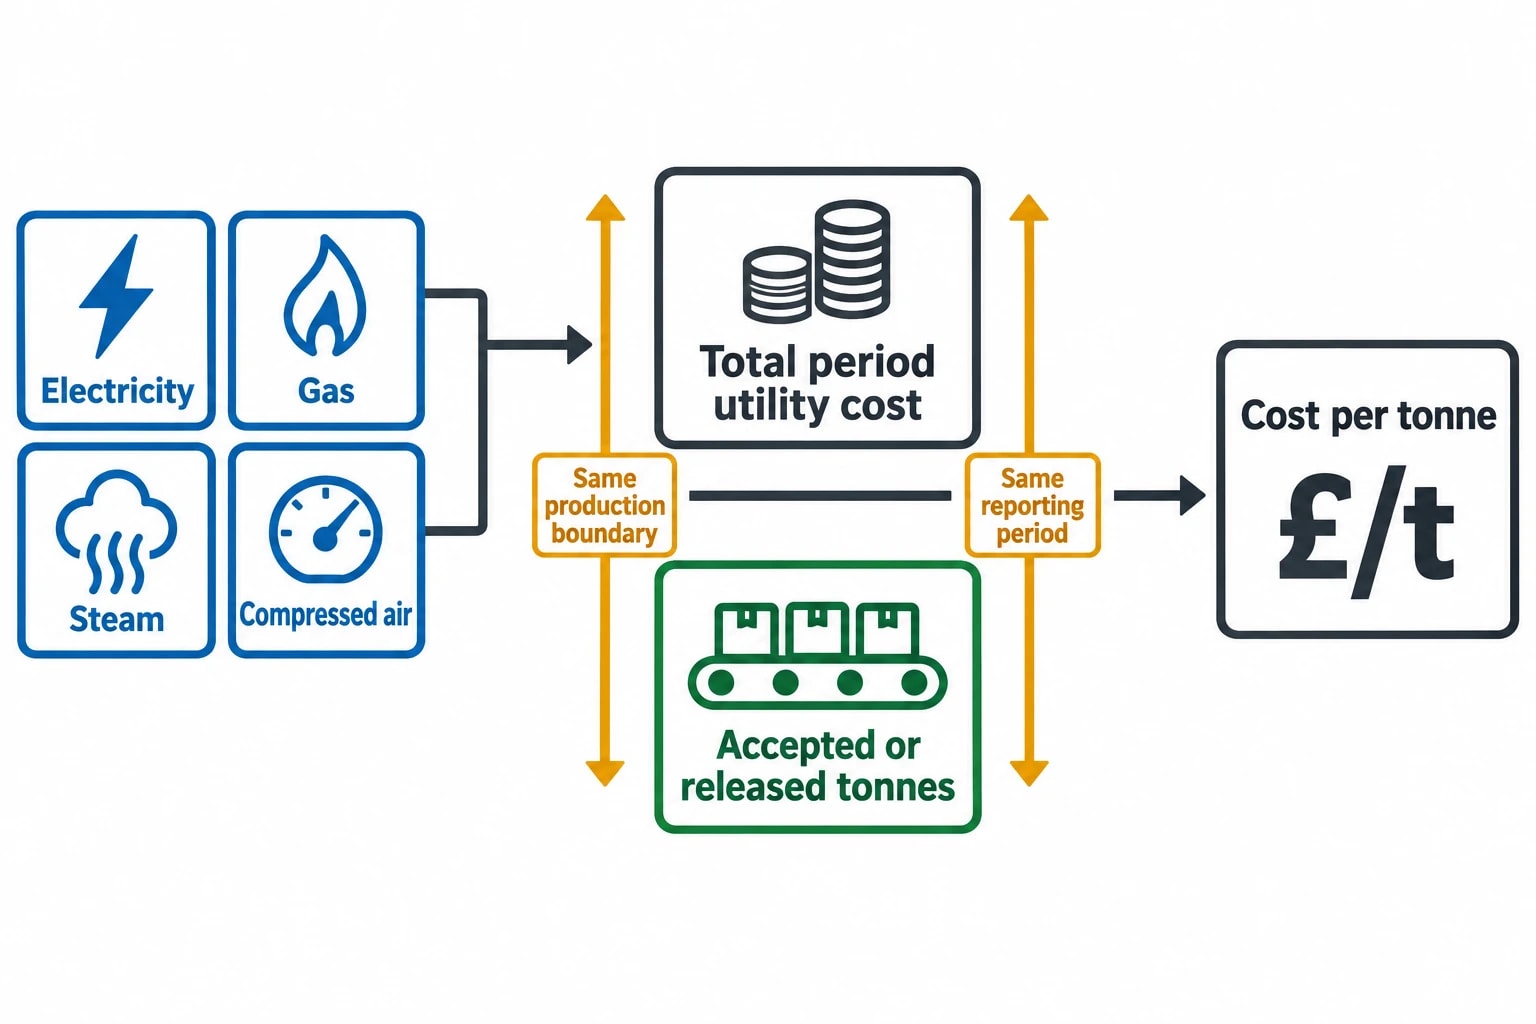
The standard calculation is:
Cost per tonne=Accepted or released tonnes producedTotal period utility costTotal period utility cost is the agreed cost of electricity, gas, steam and compressed air within the chosen production boundary. Accepted or released tonnes are the saleable tonnes that meet the site’s stated production and quality rule during the same period.
The result is expressed as £/t.
A useful KPI definition might read:
Energy cost per tonne, Line 2, released product, 1 to 31 March, including metered electricity, gas and allocated steam cost.
That statement identifies the production boundary, quality status of output, reporting period and utility costs included.
Why matching the numerator and denominator matters
The numerator and denominator must answer the same question. If a calculation includes electricity and gas for a single extrusion line over seven days, the tonnage must cover released product from that line over those seven days.
Several common errors distort the figure:
- Dividing whole-site utility cost by the output of one line.
- Including line energy but using total site tonnes.
- Using invoiced energy cost for a month and output from a four-week production period.
- Using gross production tonnes one month and released tonnes the next.
- Including compressor electricity and a separate full compressed-air charge for the same process.
A £/t result can look precise to two decimal places while relying on mismatched data. The operational decision behind the number then becomes unreliable.

Omni Vision delivers turnkey utility metering, CO2 tracking, and AI-powered production KPI intelligence — giving you real-time dashboards and actionable insights across your entire facility.
Define the production boundary before collecting costs
The production boundary decides which assets, utility meters, costs and tonnes belong in the calculation. It should be agreed before teams begin assigning costs.
Choose the right level for the question
Manufacturers can calculate cost per tonne at several levels.
| KPI level | Best use |
|---|---|
| Site | Budgeting, monthly finance reporting and broad energy review |
| Process area | Comparing major process stages such as melting, drying, baking or mixing |
| Production line | Identifying line-specific utility losses and operating variation |
| Batch or campaign | Understanding the cost effect of recipe, grade, specification or campaign length |
| Product family | Comparing energy cost between products with different process demands |
A whole-site KPI can show whether energy spend is moving against output. A line-level KPI can identify a recurring shift issue, an inefficient product sequence or a shared-utility allocation problem.
The reporting level should fit the available metering and production records. A line-level £/t figure needs credible line output and a direct meter, or a documented allocation method, for the utilities serving that line.
Set the output rule
Most plants use accepted or released tonnes as the denominator. This measures the utility cost required to create saleable product and makes lost yield visible.
A line can consume the same energy during two periods but release fewer tonnes during the second period because of scrap, rework or off-spec production. Cost per tonne rises, reflecting the commercial impact of lost output.
The output definition should state how the site handles:
- Finished product released by quality.
- Rework and scrap.
- Work in progress at period-end.
- Internal transfers between process stages.
- Wet tonnes, dry tonnes or another standardised mass basis.
- Packaged product versus bulk product.
Moisture-sensitive processes require particular care. A drying, minerals, chemicals or food plant may show lower energy per wet tonne after processing wetter material, despite a deterioration in underlying energy performance. A dry-tonne basis can provide a more comparable KPI where moisture materially changes the mass sold or transferred.
Build total utility cost without double counting
The numerator should reconcile to utility invoices, approved internal transfer prices, or a combination of both. A single blended rate may be sufficient for a simple monthly site KPI. It becomes weaker when a plant has time-varying electricity prices, several fuels or shared energy assets.
Include the applicable electricity cost
Electricity cost should reflect the components included in the KPI definition. Depending on the supply arrangement, this can include consumption charges, capacity-related charges, network charges, standing charges and agreed supplier fees.
The treatment of fixed charges needs consistency. A site may allocate them across all tonnes produced, retain them in a site overhead measure, or assign them to lines through an agreed driver. The chosen method should remain stable long enough to support comparison.
Many UK businesses have half-hourly electricity data. Where a supply contract includes prices or charges that vary by time, using one monthly average price for every line can hide the real cost of production timing. A line may have stable kWh/t while its £/t rises because it runs more often during expensive settlement periods.
Cost gas, steam and compressed air carefully
Gas should use the cost basis associated with the metered energy consumed in the reporting period. Invoice timing can differ from consumption timing, so finance teams may need an accrual where a bill crosses the reporting cut-off.
Steam needs a defined internal cost method where a boiler house supplies several users. A complete steam cost can include boiler fuel, feedwater treatment, electricity, losses, maintenance and agreed operating costs. Some sites use a transfer price per tonne of steam. Others calculate boiler-house cost and allocate it by metered steam flow.
Compressed air creates a frequent counting problem. The compressor electricity should appear once within a process cost calculation. Plants generally use one of two approaches:
-
Include compressor electricity in the electricity cost, then allocate it to users through compressed-air meters or an agreed demand basis.
-
Apply an internal compressed-air transfer price to the user and exclude the corresponding compressor electricity from the downstream process calculation.
Water and oil can be added where they are material to production. In that case, call the measure total utility cost per tonne rather than energy cost per tonne.
Document shared-utility allocations
Shared assets often supply several production areas. Typical examples include boiler houses, refrigeration plant, compressed-air stations, central vacuum systems and effluent treatment equipment.
Direct metering provides the clearest allocation basis. Where direct metering is unavailable, a plant needs a documented driver, such as:
- Measured steam or compressed-air flow.
- Operating hours.
- Rated load, supported by utilisation evidence.
- Throughput.
- Refrigeration duty or process cooling flow.
A cost-allocation register should record the supplying asset, receiving process, utility meter or invoice source, allocation driver, accountable owner and effective date. Review it after changes to product routing, utility infrastructure or production capacity.
Match cost and production data to the same reporting clock
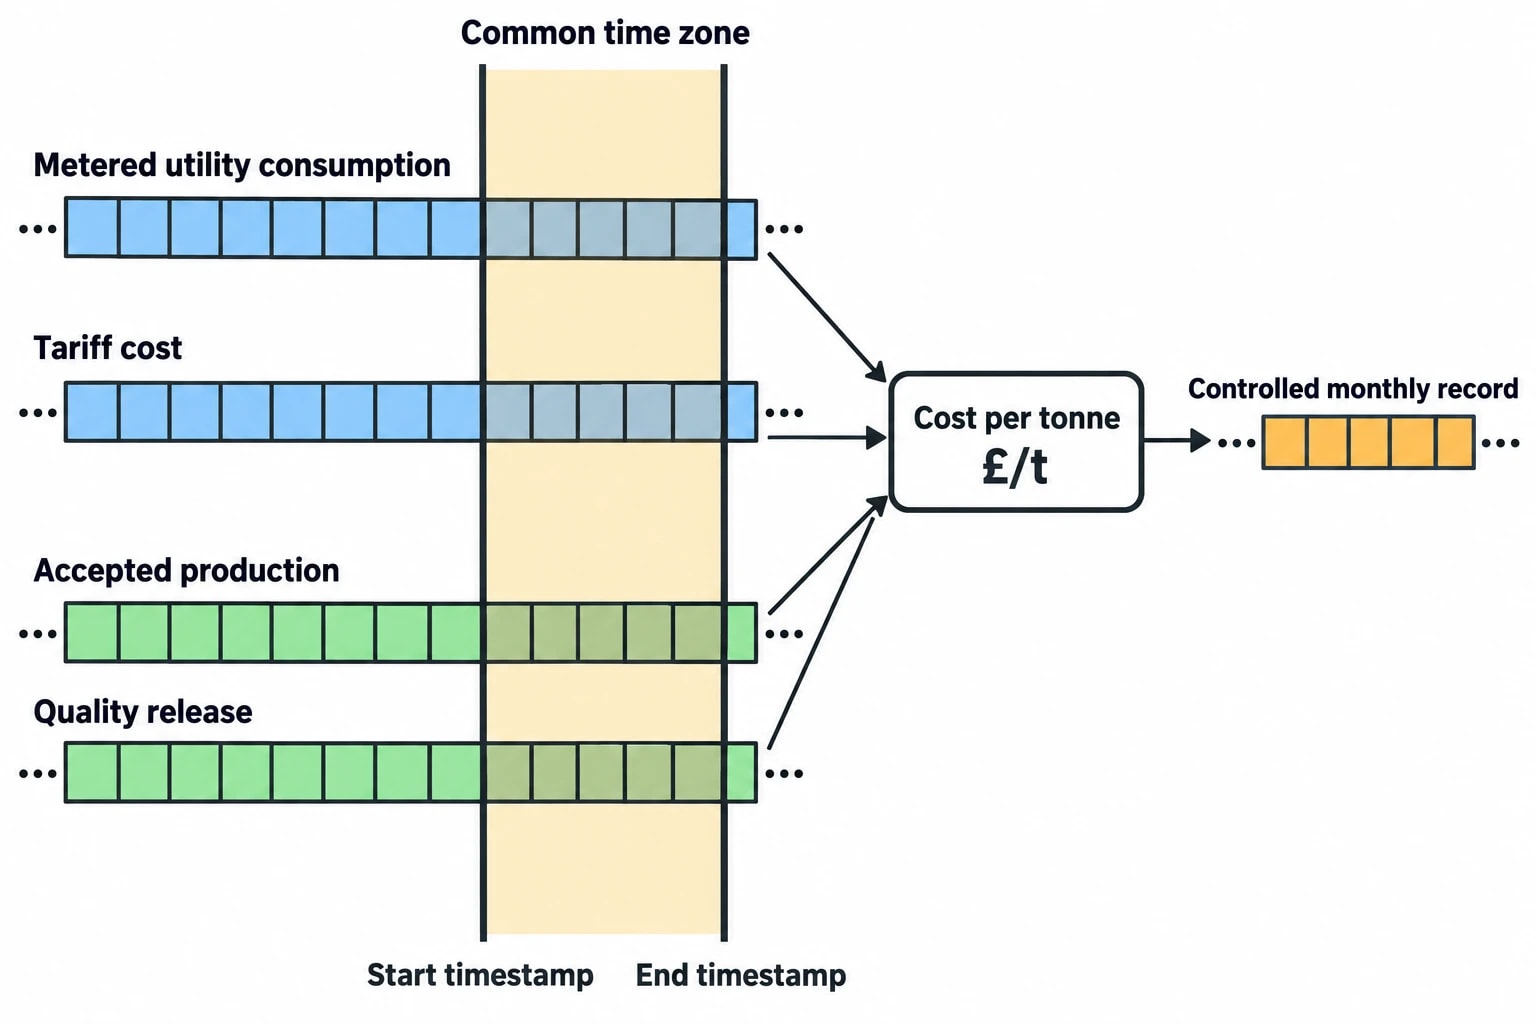
Time alignment has as much influence on accuracy as the arithmetic. Utility data and production output should begin and end at the same timestamp.
Select a practical reporting period
Monthly reporting suits invoice reconciliation, budgeting and management accounts. Weekly, daily and shift-level reporting helps operations teams investigate changes sooner.
The reporting period must be consistent across:
- Metered utility consumption.
- Tariff and cost records.
- Production order or batch records.
- Quality release status.
- Allocation rules for shared services.
Invoice receipt date is not the energy-consumption date. A bill received in April can cover March usage. The cost-per-tonne calculation should use the consumption period, with accrued cost or interval-based costing where required.
Overnight shifts also need a clear rule. A production run beginning before midnight and ending after midnight can otherwise place energy in one reporting day and output in another. Use a common time zone, a defined shift cut-off and a documented approach for batches crossing the boundary.
Validate data before publishing the KPI
A monthly control routine improves confidence in the result and makes missing data visible.
-
Confirm that all costed meters sit inside the selected production boundary.
-
Confirm that the tonnage meets the agreed accepted or released-product rule.
-
Check that utility and production records share the same start and end timestamps.
-
Reconcile total calculated utility cost against invoices or approved internal cost records.
-
Identify estimated, substituted or missing meter values.
-
Record changes to tariffs, meters, production routing and allocation rules.
-
Obtain agreement from production and finance before locking the monthly result.
Operational dashboards can display provisional £/t during the month. The month-end KPI should become the controlled financial record after reconciliation.

Track energy consumption, emissions, and process parameters with seamless PLC/SCADA integration via Modbus, OPC-UA, and MQTT protocols.
Worked example: calculating energy cost per tonne
An EnerTherm Engineering worked example uses verified electricity, gas and steam cost of £18,600 and 620 tonnes of released product in the same reporting period.
| Input | Period value |
|---|---|
| Verified electricity cost | £8,700 |
| Verified gas cost | £6,900 |
| Verified steam cost | £3,000 |
| Total utility cost | £18,600 |
| Released product | 620 t |
| Energy cost per tonne | £30/t |
The calculation is £18,600 divided by 620 tonnes, giving £30/t.
This result is only meaningful if the £8,700 electricity cost, £6,900 gas cost and £3,000 steam cost belong to the process that released the 620 tonnes. If the steam charge includes another line or the production figure includes output from an uncosted line, the result loses value.
Use the result to investigate variance
A monthly figure should trigger focused questions when it changes materially.
Higher £/t may result from:
- Lower throughput spreading base-load energy across fewer tonnes.
- Reduced accepted yield.
- Longer heat-up, cleaning, changeover or idle periods.
- A more energy-intensive product mix.
- Higher electricity prices during production hours.
- Increased steam demand, compressor load or process losses.
- A metering, tariff or production-data error.
The first response should establish whether the change is physical, commercial or administrative. A tariff-driven increase requires a different action from a process-energy increase. A missing production release record requires a data correction rather than an engineering intervention.
Track kWh/t alongside £/t
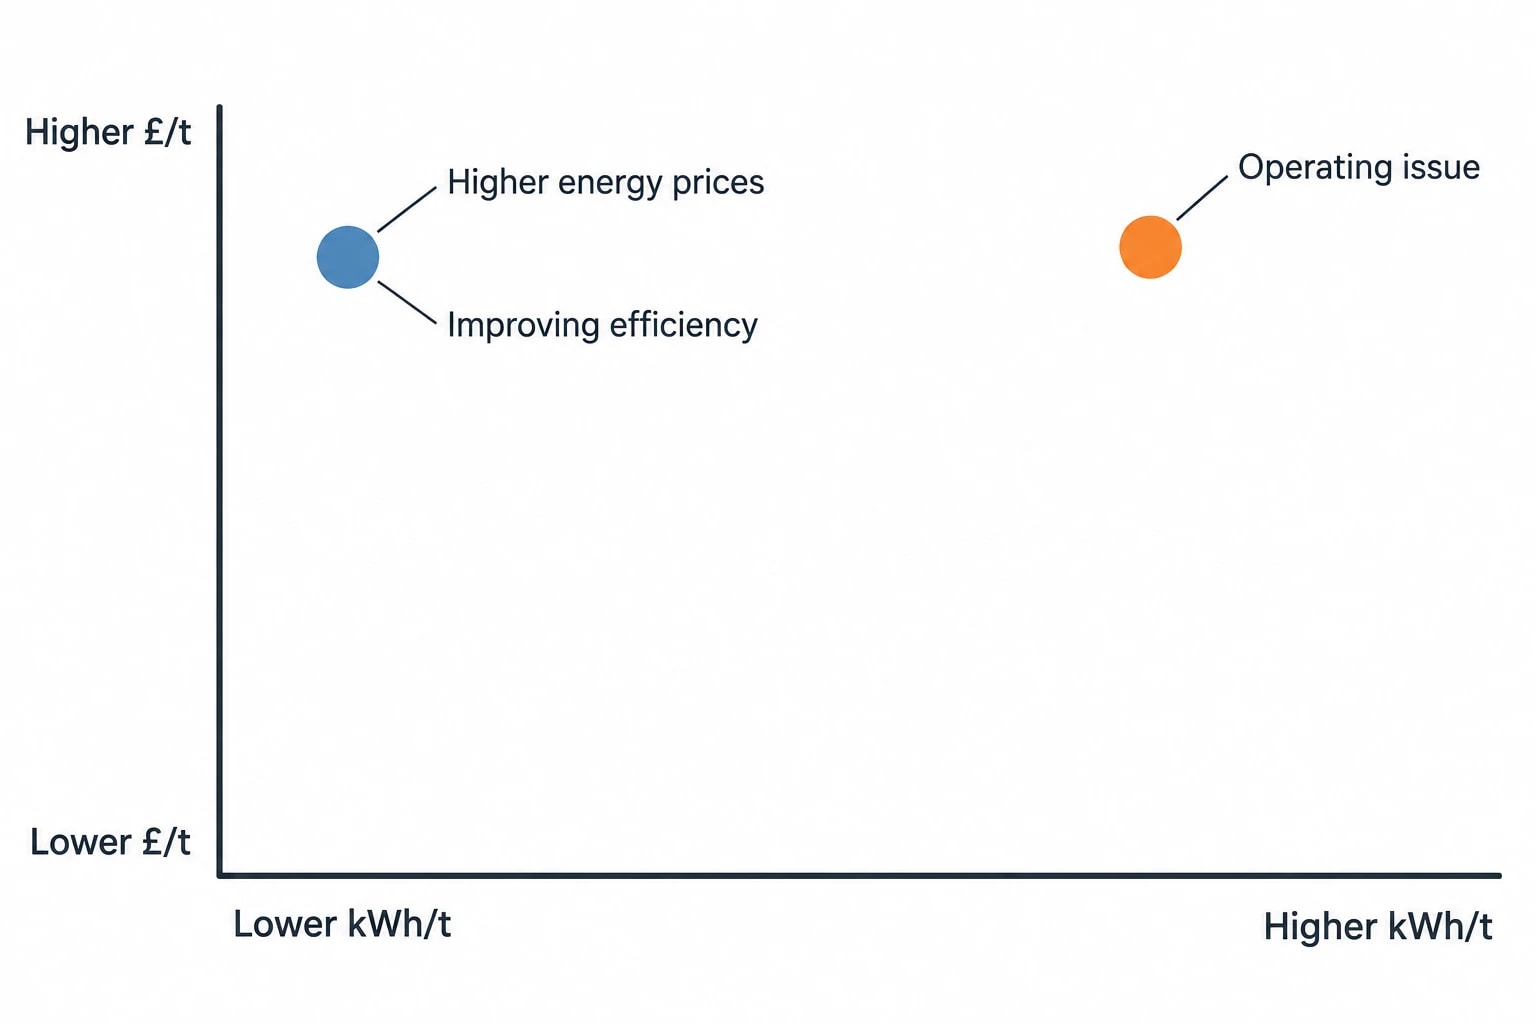
Cost per tonne measures the financial consequence of energy use. It does not isolate physical energy performance because tariffs change.
A paired KPI set provides a clearer view:
| KPI | What it shows |
|---|---|
| kWh/t | Physical energy intensity and process efficiency |
| £/t | Financial energy cost against saleable output |
| kgCO₂e/t | Emissions intensity when calculated with a defined emissions-factor method |
A fall in kWh/t with a rise in £/t can indicate improving process efficiency during a period of higher energy prices. A rise in both kWh/t and £/t points more strongly towards an operating, equipment or production issue.
ISO 50001:2018/Amd 1:2024 provides the energy-management framework for measuring and improving energy performance. ISO 50006:2023 gives guidance on energy performance indicators and energy baselines. ISO 50006:2014 is withdrawn, so internal KPI procedures should use the current designation.
Normalise for relevant variables
Raw £/t remains commercially important because it shows the actual cost of producing a tonne. A normalised view helps engineers distinguish operational efficiency from changes in production conditions.
Relevant variables may include:
- Product mix, grade, recipe or packaging format.
- Operating hours and line utilisation.
- Batch size and campaign length.
- Ambient temperature for heating, cooling and refrigeration.
- Feedstock moisture or inlet temperature.
- Planned shutdowns and start-up conditions.
A food manufacturer running shorter batches may have higher £/t because cleaning and heat-up energy are spread across fewer tonnes. An aggregates plant can see higher energy intensity when moisture changes. A metals producer may experience different furnace demand by alloy grade and yield.
Teams should compare like with like where possible. A product-family benchmark, standardised dry-tonne basis or normalised baseline can prevent a change in mix from being misread as a deterioration in energy performance.
Use cost per tonne as an operating control
The KPI becomes valuable when teams can move quickly from a monthly result to the asset, production condition or event behind it.
Segment the KPI before acting
Break the measure down by line, shift, product family, batch or operating state. A site average can conceal recurring losses.
Examples include a higher night-shift £/t caused by extended idle running, a product-specific rise linked to extra drying duty, or a higher cost during short campaigns caused by frequent heat-up cycles. Each requires evidence from matched utility and production records.
A focused investigation should consider:
- Throughput against plan.
- Accepted yield.
- Process running time.
- Electricity cost during the production window.
- Boiler fuel, steam flow and condensate return.
- Compressor loading and unloaded running.
- Maintenance events, faults and changeovers.
Assign an owner and verification period
A useful cost-per-tonne review ends with an action, an accountable owner and a verification period.
Actions may include repairing a steam leak, reducing compressed-air leakage, changing a production sequence to reduce heat-up cycles, improving boiler blowdown control or rescheduling a flexible load away from expensive electricity periods.
Measure the result using the same boundary, allocation rule and output definition as the original KPI. If product mix or production volume changes, compare the raw £/t outcome with the relevant normalised and kWh/t measures.
Maintain a comparable manufacturing cost-per-tonne KPI
Cost per tonne earns trust through consistency. Maintain a written KPI definition, an agreed production boundary, a utility-cost register, allocation rules and matched reporting periods. Update the documentation when the plant changes, rather than quietly changing the calculation.
This article reflects the independent analysis and editorial opinion of EnerTherm Engineering. Product names, trademarks, and brands mentioned belong to their respective owners. EnerTherm Engineering is not affiliated with, endorsed by, or a licensee of any third-party software or product mentioned unless explicitly stated.

Senior Process Engineer — EnerTherm Engineering
Masab Javed is a Senior Process Engineer at EnerTherm Engineering with extensive expertise in chemical process design, decarbonisation, and sustainable industrial solutions. He holds an MSc from TUM School of Management and a BEng in Chemical Engineering from NUST, with experience spanning ammonia production, CO2 capture, and semiconductor manufacturing optimisation.
