Smart Factory Energy Management Platform Maps Six Utilities
Read-only PLC data links six utility streams, supporting 15-25% energy cost reductions.
A smart factory energy management platform collects, contextualises and analyses utility consumption against production activity. It converts electricity, gas, water, steam, compressed air and oil data into evidence for operational decisions.
Food and beverage plants generate large volumes of operational data. PLCs control packaging lines, refrigeration panels protect chilled stock, boilers supply heat, and flow meters record selected utilities. Yet many sites still lack one accountable view of how those systems consume energy through a shift, batch, clean-in-place cycle or overnight shutdown.
Electricity invoices arrive weeks after consumption. Gas use is reviewed at site level. Water losses are spotted after a bill rises. Engineers export readings into spreadsheets, then reconcile different timestamps, naming conventions and production records.
EnerTherm Engineering’s Omni Vision Energy Intelligence Platform combines utility metering, read-only connectivity to existing plant data and EPSA cloud analytics. It maps the six core utility streams against production conditions, informing decisions on cost, carbon, energy intensity and abnormal consumption.
Why six-utility monitoring matters in food and beverage manufacturing
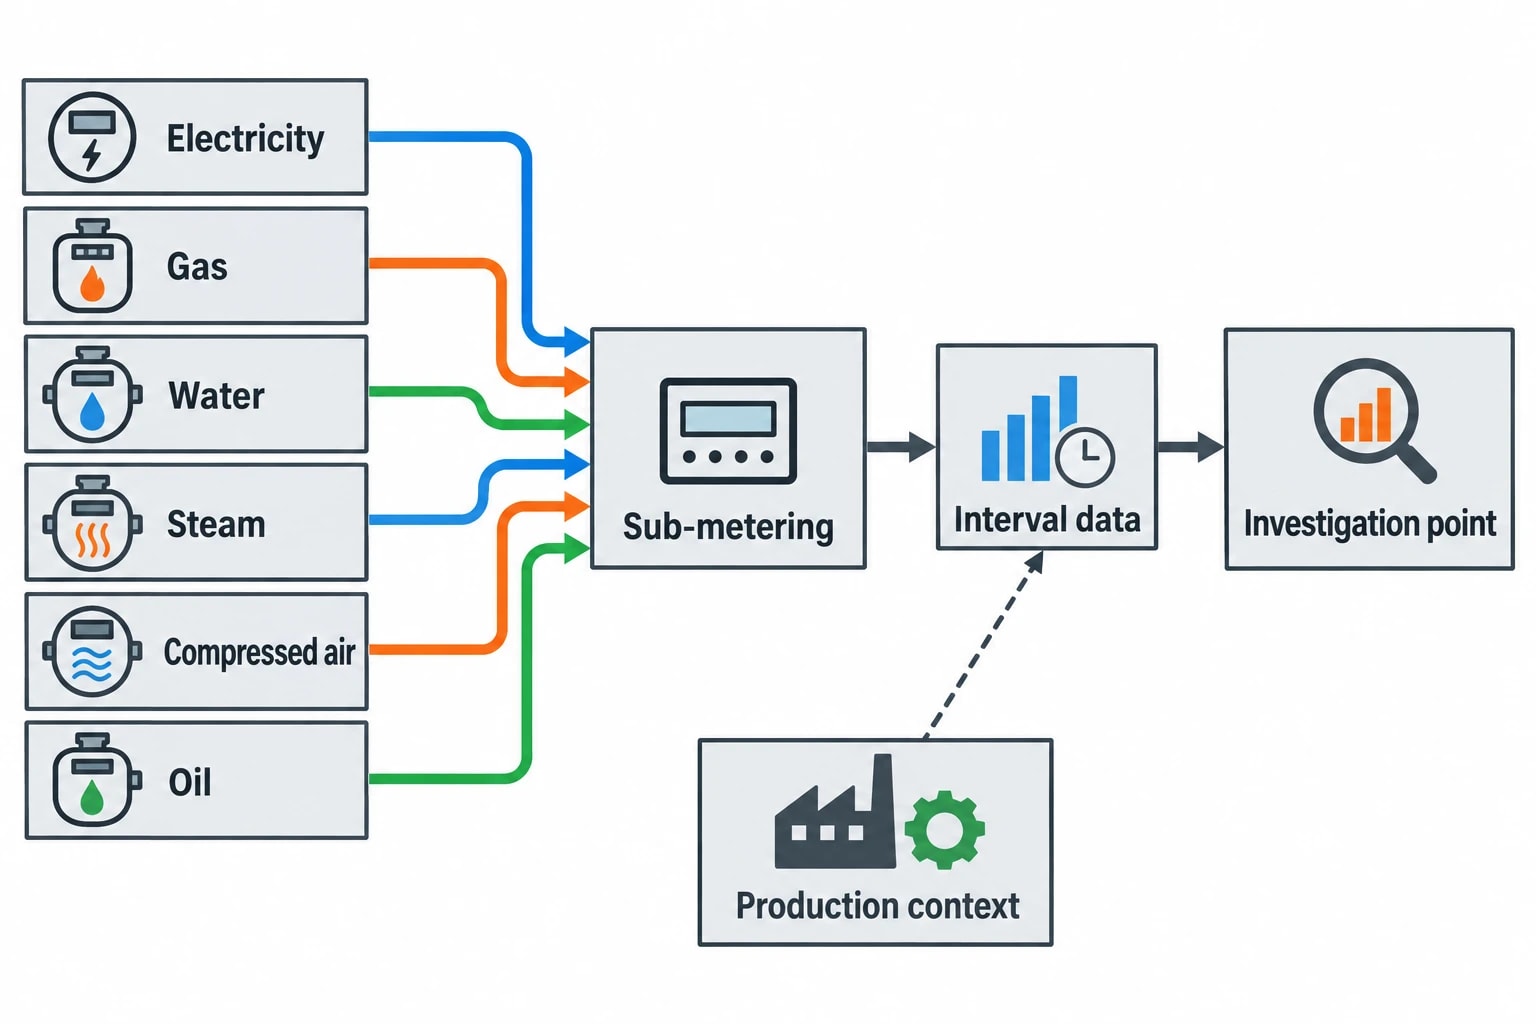
Electricity is often the first utility to receive attention. It is widely metered, visible on invoices and affected by demand charges. However, an electrical meter at the site boundary cannot explain whether rising consumption came from refrigeration, compressed-air generation, a heat process, packaging equipment or an out-of-hours load.
Food and beverage operations depend on several utilities with different loss mechanisms, operating costs and emissions consequences. A plant can reduce electricity consumption while increasing boiler fuel use, water demand or compressed-air losses. Performance requires a whole-utility view.
Electricity exposes demand, refrigeration and motor loads
Electricity monitoring can show the profile of refrigeration compressors, evaporator fans, pumps, conveyors, mixers, drives and packaging lines. Granular interval data helps engineers distinguish normal production load from avoidable baseload.
For a cold store, electrical demand should be interpreted alongside ambient conditions, stock movements, door openings, defrost activity and temperature-control requirements. A rise in compressor demand may indicate higher cooling duty. It may also point to condenser fouling, an altered setpoint, a refrigeration fault or a plant schedule that no longer reflects production.
Sub-metering provides the necessary distinction. A refrigeration plant meter gives maintenance and operations teams a defined system to investigate, rather than an unexplained change in the site total.
Gas, steam and oil reveal thermal performance
Natural gas and fuel oil commonly serve boilers, ovens, dryers, thermal-fluid heaters and standby generation. Their consumption becomes more useful when read alongside steam output, burner runtime, production volume and operating state.
Steam monitoring adds operational detail. A steam flow meter may identify rising demand during a sterilisation process, a prolonged warm-up period or an overnight load that differs from the expected standby condition. Meter location matters. Steam generated at the boiler house, delivered to a process area and returned as condensate answer different questions.
Oil belongs in the same utility view where sites operate oil-fired equipment or standby generators. Treating it separately from gas and electricity weakens fuel-use analysis and Scope 1 reporting.
Water exposes losses and process variation
Water is a production input, cleaning medium and energy cost. Each cubic metre may require pumping, heating, treatment and discharge. Continuous flow outside scheduled production or cleaning periods can indicate a leak, open valve, failed level-control arrangement or incomplete cleaning sequence.
Production-linked water data lets managers compare cleaning cycles, product runs and lines. A site total does not show whether a change came from higher production volume or an abnormal process condition.
Compressed air makes hidden baseload visible
Compressed air serves actuators, valves, packaging machinery and other equipment across many food and beverage facilities. Leakage, excessive pressure and unnecessary compressor operation create a background load that can persist through shutdown periods.
Stable compressed-air flow while production lines are stopped provides a clear maintenance investigation point. The platform does not diagnose the leak itself. It identifies where and when abnormal demand occurred, allowing engineers to focus their inspection.

Omni Vision delivers turnkey utility metering, CO2 tracking, and AI-powered production KPI intelligence — giving you real-time dashboards and actionable insights across your entire facility.
Building the meter hierarchy for a smart factory energy management platform
The quality of an energy intelligence project depends on its measurement plan. Installing meters wherever access is easy can create dashboards with large data volumes but little operational meaning.
Each meter should have a defined purpose. It may support a site balance, allocate consumption to an area, assess an asset, calculate an intensity metric or provide reporting evidence.
Start at the site boundary, then work towards assets
A useful meter hierarchy normally has three levels.
-
Site-boundary meters establish purchased electricity, gas and water, alongside recorded use of on-site fuels.
-
Major-area meters separate high-consumption functions such as refrigeration, boiler houses, compressed-air generation, processing and packaging.
-
Asset and line meters support targeted analysis of compressor banks, ovens, pasteurisers, cold-store evaporator groups and individual production lines.
This hierarchy allows energy teams to reconcile area and asset readings with the site total. Small differences can arise from meter accuracy, timing boundaries or unmetered loads. Persistent or material gaps need investigation before managers use the data to judge performance.
Define the meaning of each point
A meter reading needs a location, engineering unit and operating context. A tag named FLOW_12 has limited value in a production review. “Line 2 compressed-air flow, Nm³/h” identifies the utility, location and measurement.
The commissioning record should capture:
- Meter location and the loads it serves
- Measurement type and engineering unit
- Sampling interval and time zone
- Expected operating range
- Associated area, line, asset and production code
- Meter calibration or verification record
- Responsible engineer for any data-model change
This information protects data integrity. It also prevents apparent savings caused by a changed scaling factor, renamed tag or production line reassigned to another area in the reporting model.
Preserve plant control boundaries
Legacy PLC infrastructure remains central to process safety and plant availability. An energy monitoring system should collect agreed signals without writing commands, setpoints or logic changes back to the control system.
Omni Vision uses non-invasive PLC connectivity and one-way encrypted data flow to maintain zero-write access to plant systems. Depending on the equipment and integration design, it can collect read-only values through established industrial protocols including Modbus, OPC-UA, BACnet and MQTT.
The PLC remains responsible for control. The energy platform reads selected measurements, timestamps them and combines them with utility-meter data and production information. That separation supports digitisation without interfering with the plant logic that runs the process.
Mapping six utilities to batches, tonnes and operating states
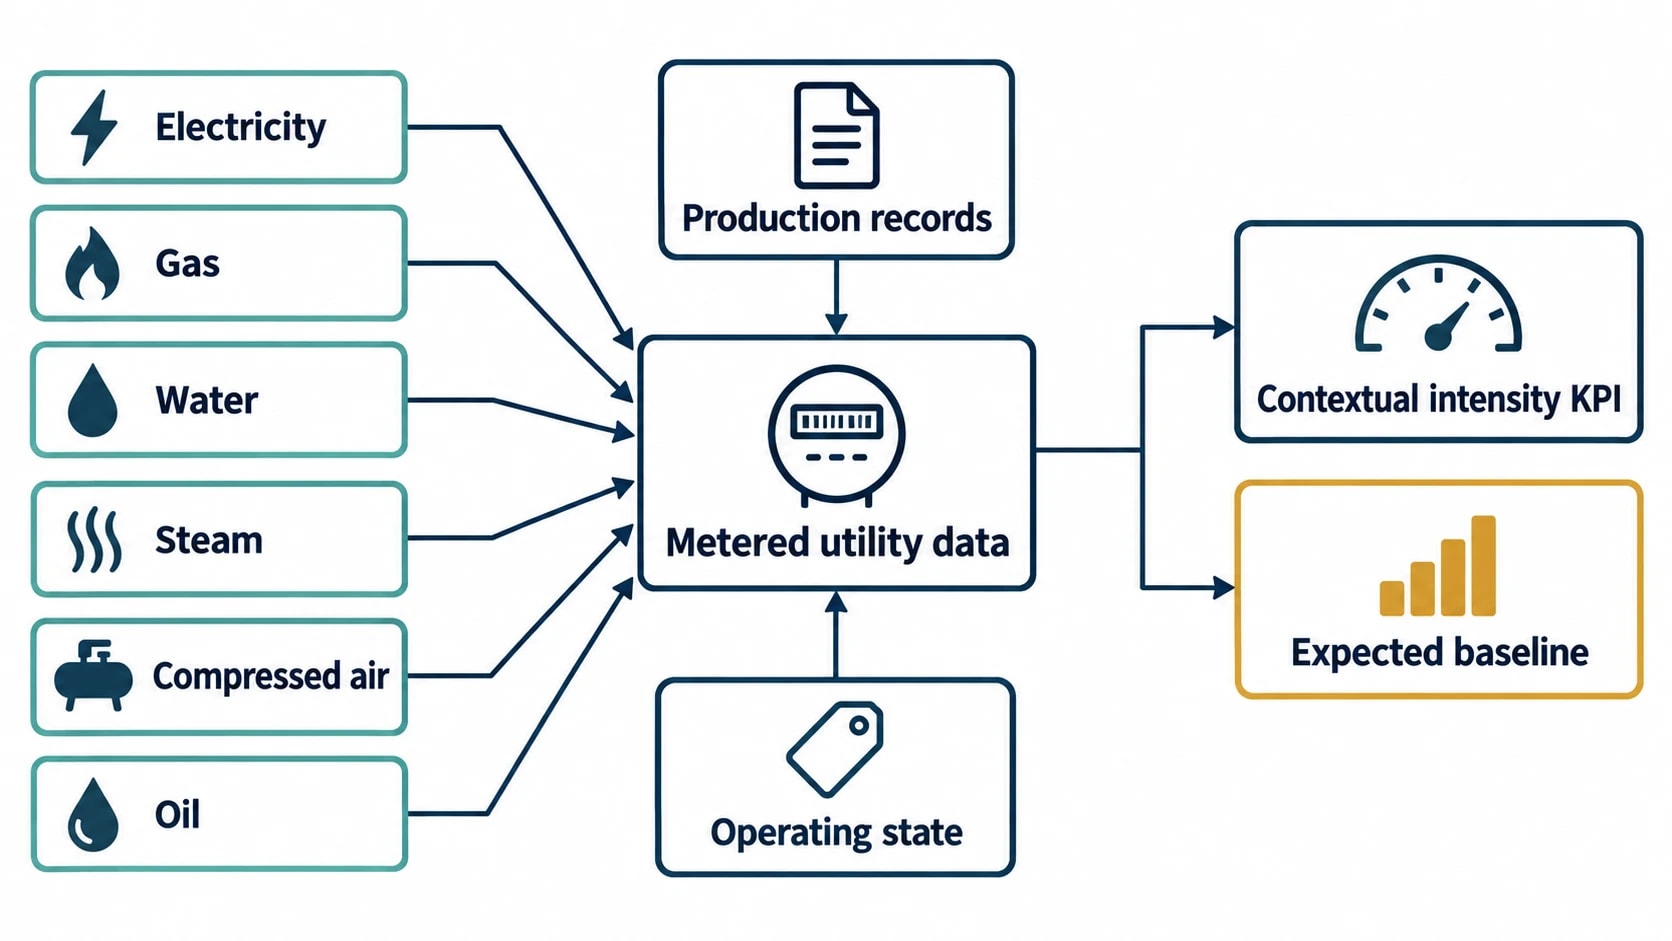
A site total in kWh helps with procurement and high-level reporting. It does not show whether a production line operated efficiently. Food and beverage facilities need intensity measures that reflect what they made, how they made it and the operating conditions at the time.
Production context converts consumption into an energy KPI
A smart factory energy management platform can associate utility time series with production schedules, batch records, line status and finished output. This supports measures such as electricity per tonne, gas per batch, steam per cleaning cycle, water per litre filled and compressed air per 1,000 packs.
The denominator must fit the process. A bakery may use tonnes of finished product. A beverage line may use litres filled or cases packed. A dairy site may require separate baselines for product families with materially different thermal demands.
A single plant-wide energy-per-tonne measure can obscure the cause of change. The figure may improve because a low-energy product mix dominated production. It may worsen because an efficient line ran below its normal rate. Product, line and operating-state context should remain visible alongside the KPI.
| Utility | Operational context | Example intensity measure |
|---|---|---|
| Electricity | Refrigeration during storage | kWh per tonne stored |
| Gas | Oven or boiler operation | kWh per tonne of product |
| Water | Clean-in-place cycle | m³ per cleaning event |
| Steam | Pasteurisation or cooking | kg of steam per batch |
| Compressed air | Packaging line in production | Nm³ per 1,000 packs |
| Oil | Thermal process or generator test | litres per operating hour |
Compare equivalent operating periods
A useful benchmark compares like with like. A cold store on a warm summer weekend has different cooling conditions from one in winter. A steam process may include substantial start-up, changeover and shutdown loads that should not be confused with steady production.
Plant teams can define operating-state baselines for production, idle, washdown, warm-up and shutdown. These classifications make anomaly detection more relevant because the platform evaluates a load against an expected condition rather than a generic site average.

Track energy consumption, emissions, and process parameters with seamless PLC/SCADA integration via Modbus, OPC-UA, and MQTT protocols.
Predictive anomaly detection finds waste before the next invoice
A high utility reading is not automatically an anomaly. Production may be above plan, a cold store may have received stock, or a thermal process may be running an extended batch. An actionable anomaly is a material departure from the expected utility profile for the relevant operating conditions.
Identify the pattern, then investigate the physical system
For refrigeration, an anomaly might be electrical demand that remains elevated after an expected defrost period. For steam, it could be overnight flow above the established warm-standby profile. For compressed air, it may be a higher minimum flow during a known production stop.
EPSA’s cloud-based AI analytics engine analyses utility and production data for trend changes, forecast variance and unexpected patterns. The useful output is an investigation prompt with the affected meter, time range, expected profile and measured departure.
Maintenance engineers can then inspect the equipment. Causes may include air leaks, fouled condensers, failed valves, altered schedules, sensor drift, deteriorated insulation or changed operating practice. Analytics prioritise the investigation. Competent engineering diagnosis identifies the corrective action.
Build alert rules around plant behaviour
Early deployments benefit from a small number of alerts that teams understand and own. Generic alarm floods encourage operators to ignore the platform.
Suitable starting conditions include:
- Compressed-air demand above the agreed shutdown baseline
- Water flow when neither production nor cleaning is scheduled
- Refrigeration load that fails to fall after a line stoppage
- Steam demand outside the expected start-up or production window
- Boiler fuel use increasing for a comparable output period
- Site electricity demand approaching a defined operational threshold
Each alert needs a named recipient, response expectation and closure record. That converts energy intelligence from passive reporting into a repeatable operating routine.
ISO 50001, ESOS Phase 4 and carbon reporting
Utility intelligence supports compliance evidence. It does not replace management review, documented methods, competent assessment or accountable decision-making.
ISO 50001:2018 provides the management framework
ISO 50001:2018, amended by ISO 50001:2018/Amd 1:2024, provides a framework for establishing, implementing, maintaining and improving an energy management system. The standard focuses on systematic improvement in energy performance, including energy efficiency, energy use and consumption.
For manufacturers, reliable sub-metered data supports energy review, energy performance indicators, objectives, operational control and internal audit activity. The platform can retain the history behind an energy performance indicator and show when an improvement measure was implemented.
The energy team still needs to define the baseline, account for relevant variables and determine whether an observed reduction represents sustained improvement rather than a change in production mix or operating conditions.
ESOS Phase 4 requires verifiable consumption evidence
For ESOS Phase 4, an organisation qualifies if it meets the definition of a large undertaking on 31 December 2026. The deadline for notification of compliance is 5 December 2027.
Significant energy consumption must account for at least 95% of total energy consumption. Phase 4 requires energy intensity ratios for each organisational purpose across buildings, transport, industrial processes and other energy uses. The indicators must be quantifiable, associated with the relevant assets or activities, and based on verifiable data where reasonably practicable.
A maintained utility dataset can support audit preparation by showing actual consumption, allocation methods and priority areas for investigation. It cannot substitute for the required ESOS assessment, evidence pack, board-level sign-off or lead-assessor involvement where the scheme requires it.
Maintain activity data separately from emissions factors
Natural gas and fuel oil burned on site normally contribute to Scope 1 emissions. Purchased electricity, heat, steam and cooling fall within Scope 2 reporting boundaries.
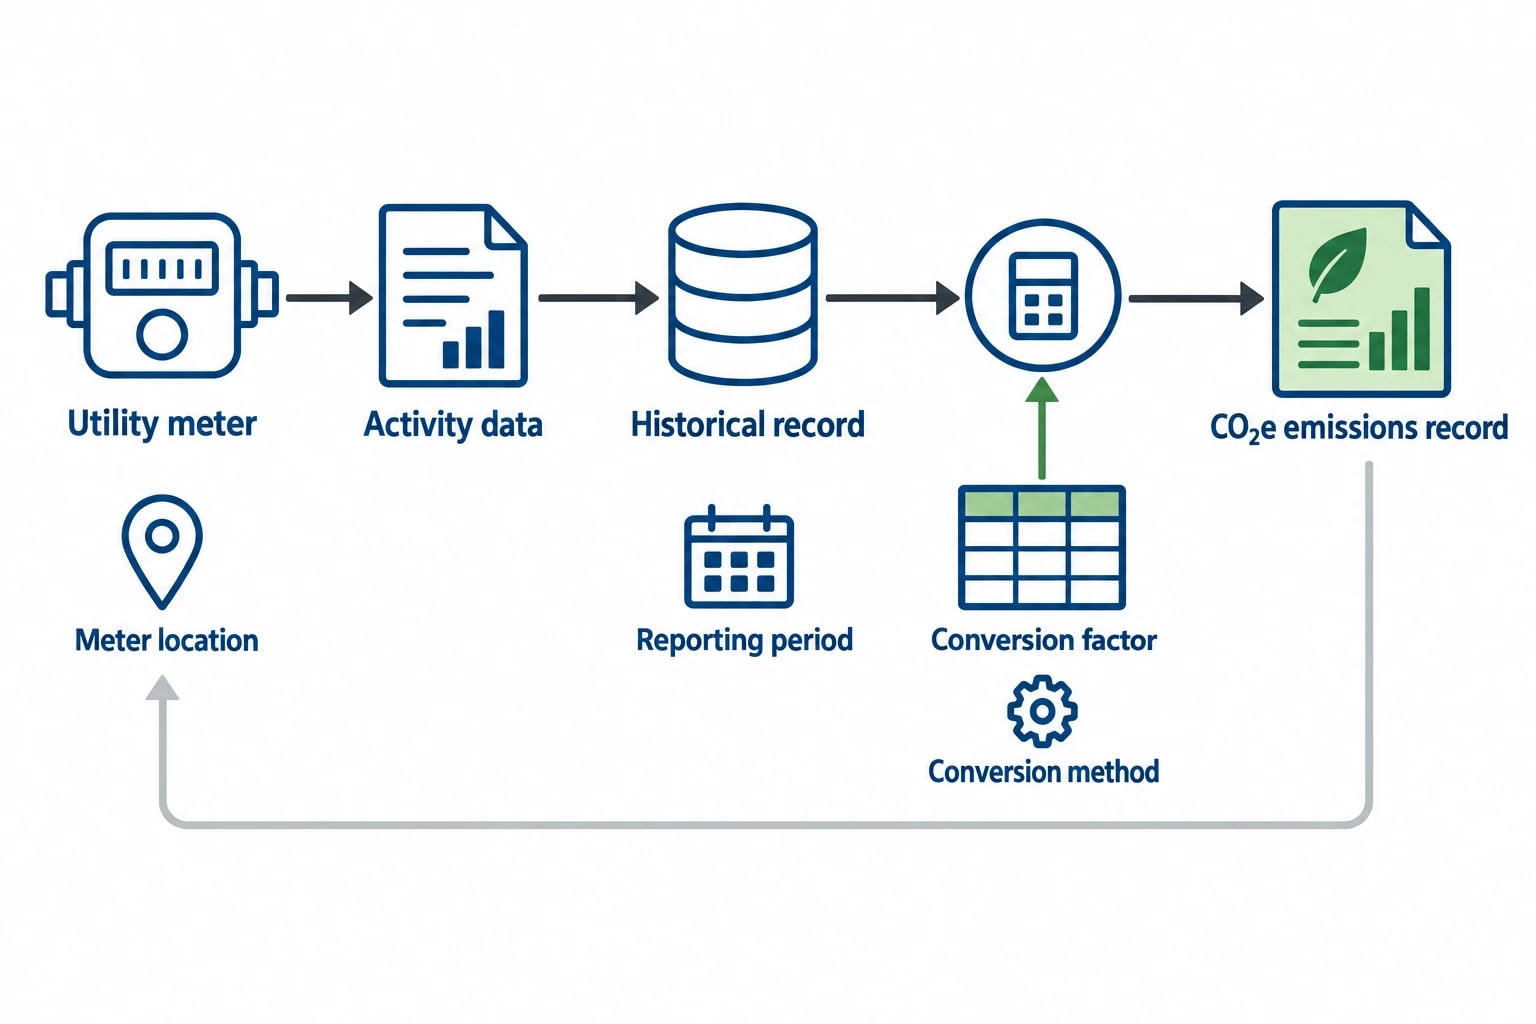
The Department for Energy Security and Net Zero publishes annual greenhouse-gas conversion factors for UK company reporting. A well-designed platform retains activity data separately from the emissions factors used to convert it into CO₂e. This allows reporting teams to update factors without altering original meter records.
It also gives an auditor a clear route from an emissions figure to the relevant consumption record, meter location, reporting period and conversion method.
PAS 2060 has been succeeded by ISO 14068:2026
PAS 2060:2014 was the earlier publicly available specification for carbon-neutrality claims. ISO 14068:2026, Climate change management — Carbon neutrality, has replaced ISO 14068-1:2023, which superseded PAS 2060:2014.
The standard provides principles, requirements and guidance for achieving and demonstrating carbon neutrality. Its hierarchy prioritises greenhouse-gas reduction and removals within the value chain before offsetting. Automated Scope 1 and 2 activity data provides an important input, but carbon-neutrality claims also require defined boundaries, credible quantification, reduction planning and appropriate substantiation.
Making utility intelligence part of daily plant management
Energy intelligence becomes valuable when production, engineering and energy teams review the same evidence and assign actions.
A daily review can focus on the previous shift, active anomalies and abnormal baseload. A weekly meeting can examine line-level intensity, refrigeration performance, compressed-air shutdown demand and unresolved alerts. A monthly review can assess savings measures, update action plans and prepare reporting evidence.
This article reflects the independent analysis and editorial opinion of EnerTherm Engineering. Product names, trademarks, and brands mentioned belong to their respective owners. EnerTherm Engineering is not affiliated with, endorsed by, or a licensee of any third-party software or product mentioned unless explicitly stated.

Technical Manager — EnerTherm Engineering
John Naranjo is Technical Manager at EnerTherm Engineering, bringing specialist expertise in chemical and environmental engineering. He recently led the implementation of Omni Vision, EnerTherm's real-time energy and utility monitoring platform. He holds an MSc in Environmental Engineering from the University of Huelva and a BSc in Chemical Engineering, with memberships in both the Energy Institute and IChemE.
