Energy Intelligence Platform Cuts Food Plant Costs 15-25%
How read-only OPC-UA links six utility streams to ESOS and ISO 50001 reporting.
An energy intelligence platform for manufacturing collects, contextualises and analyses plant utility data so managers can reduce energy consumption and cost without compromising production or food safety.
At a chilled-food factory, a refrigeration issue can increase electricity demand for hours before a monthly invoice or manual spreadsheet identifies the change. The excess cost has already been absorbed into the batch. A utility total may confirm that spend rose, but it cannot show whether the cause was extended defrosting, a cold-store door issue, higher compressor runtime, altered production volumes or a change to cleaning activity.
Food and beverage plants need more than a monthly energy total. They need timely, validated evidence that connects electricity, gas, water, steam, compressed air and oil with production conditions. That is the practical purpose of an energy intelligence platform for manufacturing.
The Omni Vision Energy Intelligence Platform combines EnerTherm Engineering’s precision instrumentation and plant-data integration with EPSA cloud-based analytics. Its food and beverage configuration centralises utility data, production-linked KPIs and anomaly detection. EnerTherm Engineering states that suitable sites can target 15-25% energy cost reductions and a sub-12-month return on investment, depending on starting performance, site conditions and the improvement actions implemented.
Why food plant energy costs remain difficult to control
A utility bill cannot identify the process loss
Utility invoices show consumption and cost across a billing period. They rarely identify the affected asset, shift, production run or process condition. This creates a familiar gap between finance, maintenance and operations.
A plant manager may see a higher electricity bill. The refrigeration team may have no equipment alarm. Production may have met its output target. Yet a compressor pack may have run longer than expected, or a cold store may have carried an abnormal load outside planned operating hours.
Manual spreadsheet reporting extends that delay. Staff must collect readings, resolve missing data, align invoices with production records and calculate comparisons across periods with different product mix, weather and operating hours. The result can support annual budgeting, but it does not provide a same-shift view of avoidable consumption.
Food manufacturers also need to distinguish total consumption from energy intensity. Higher output commonly increases total energy use. It should not automatically increase energy per tonne, energy per batch or steam use per cooking cycle.
Production-linked KPIs make utility data useful
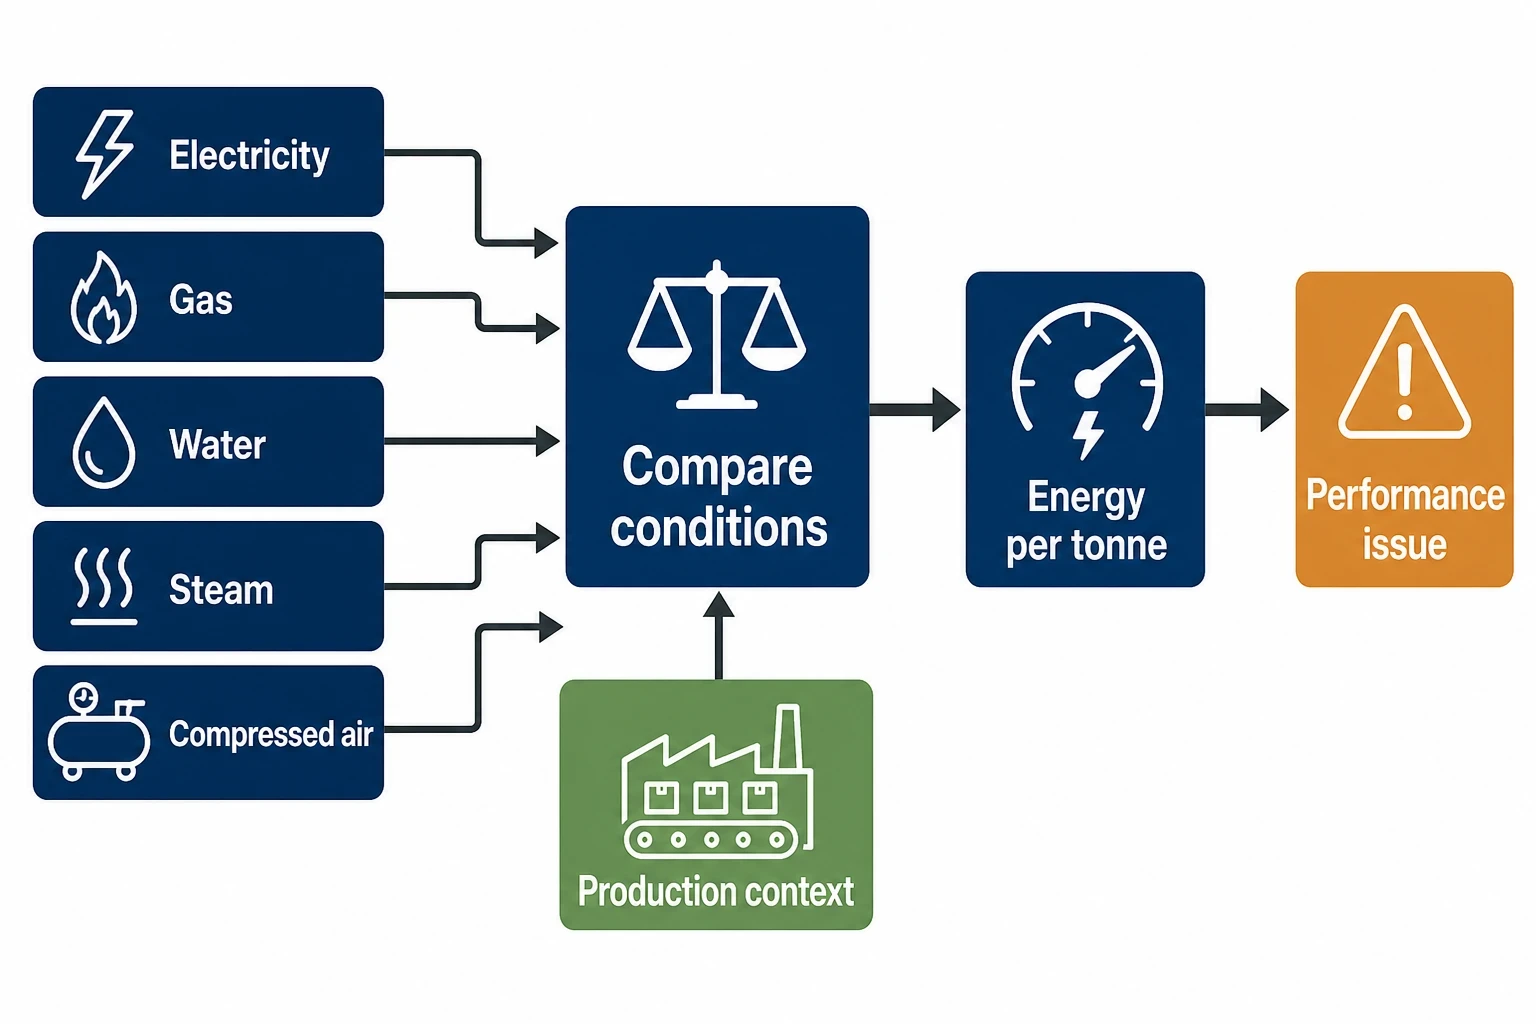
An energy intelligence platform for manufacturing should compare utilities with the activity that drives them. The relevant KPI depends on the plant and product family.
Useful measures include:
- Electricity per tonne of finished product
- Gas per batch or cooking cycle
- Steam per tonne of product
- Water per clean-in-place cycle
- Compressed-air use during non-production hours
- Refrigeration electricity per cold-store temperature zone
- Utility cost per production run
These measures make changes measurable in operating terms. If a plant produces the same product volume under comparable conditions but energy per tonne rises, managers have a defined performance issue to investigate.
A lower site energy total can also conceal poor performance. Downtime may reduce absolute electricity demand while increasing energy per tonne because fixed refrigeration, compressed-air or boiler loads continue. The platform must retain production context so teams do not mistake lower throughput for an efficiency gain.

Omni Vision delivers turnkey utility metering, CO2 tracking, and AI-powered production KPI intelligence — giving you real-time dashboards and actionable insights across your entire facility.
What an energy intelligence platform monitors in food manufacturing
Metering should follow the utility path
Effective monitoring starts with a utility map. The map should identify incoming supplies, major consuming areas, relevant equipment and the production data needed to interpret consumption.
Main incoming meters establish site totals. Sub-metering provides actionable detail. A meter at the incomer cannot explain whether a refrigeration pack, boiler house, compressed-air system, process line or cold store caused the rise in consumption.
| Utility stream | Typical measurements | Operating question |
|---|---|---|
| Electricity | kWh, demand, power factor, load profile | Has refrigeration demand increased outside production needs? |
| Gas | Consumption, boiler runtime, firing pattern | Is thermal demand rising for comparable output? |
| Water | Flow, consumption by area, CIP use | Has water use increased per cycle or batch? |
| Steam | Flow, pressure, use by process area | Is steam aligned with cooking, sterilisation or heating demand? |
| Compressed air | Flow, pressure, compressor runtime | Does air demand persist during planned downtime? |
| Oil | Fuel consumption and operating hours | Is fuel use consistent with output? |
The six streams should not be treated as separate cost lines. A food plant operates as a connected process. Higher boiler gas use may coincide with a longer cleaning cycle. Increased refrigeration electricity may follow an altered production schedule, elevated ambient conditions or prolonged cold-store access. Matching time-stamped utility data with production records gives teams a way to investigate the source rather than speculate.
Cold stores, boilers and compressed air require focused coverage
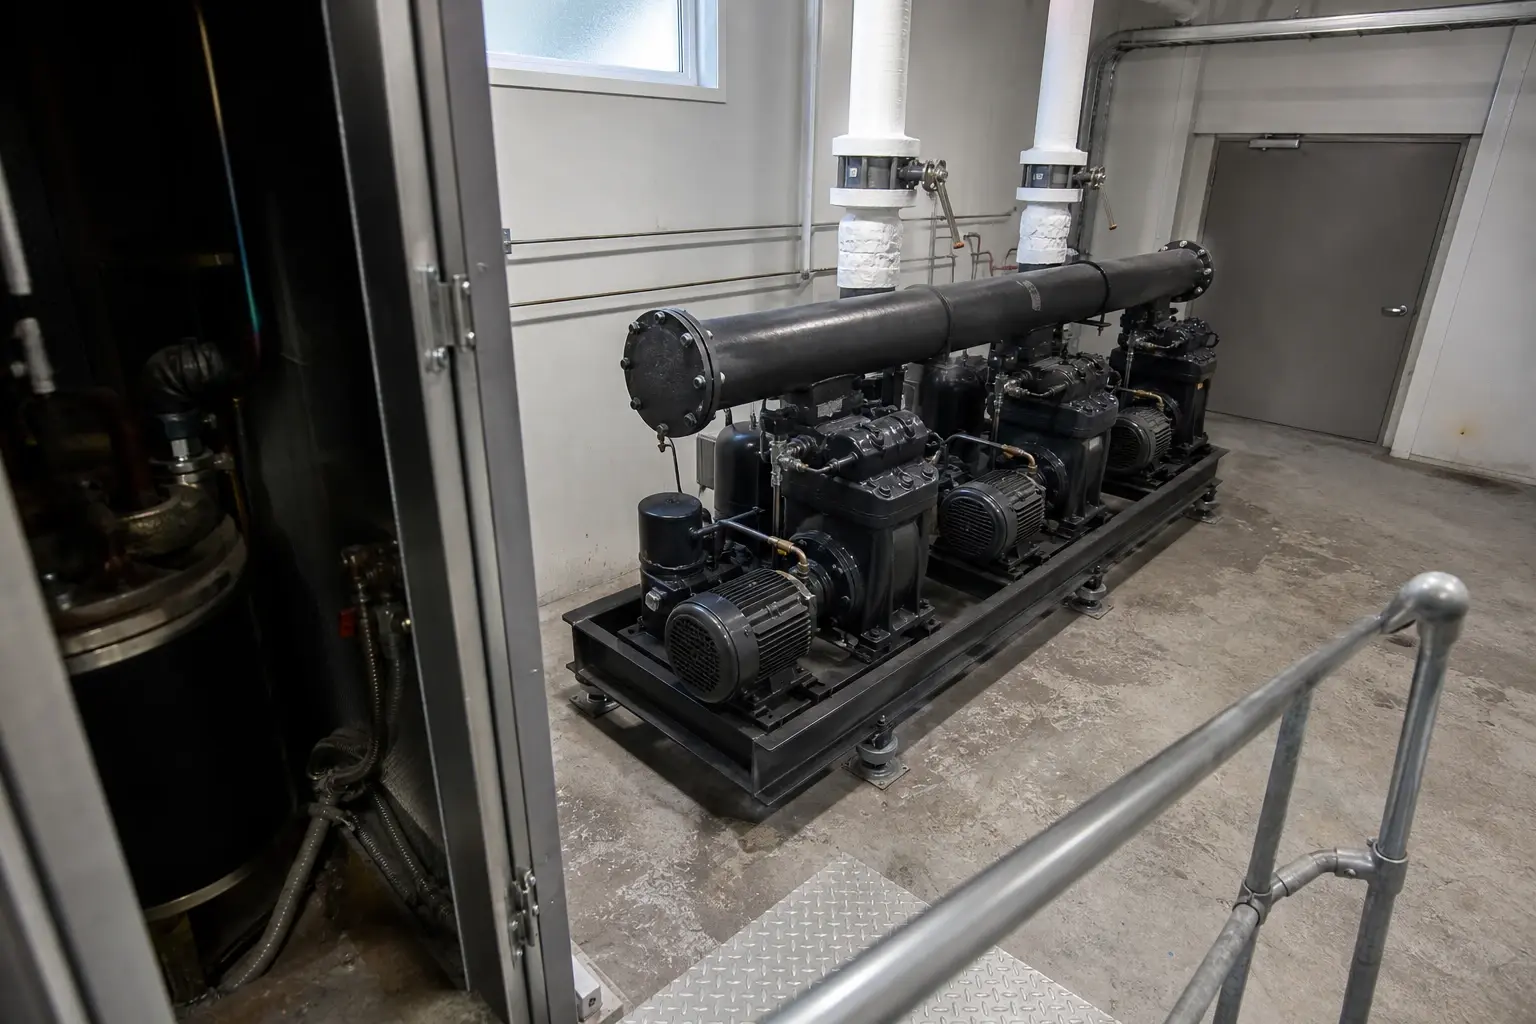
Refrigeration is a major electrical load in many food operations, particularly where chilled or frozen storage runs continuously. Monitoring should separate refrigeration demand from unrelated site consumption and retain enough resolution to identify deviations by equipment area, shift and operating period.
Boiler and steam systems need similar treatment. A steam total matters, but steam per batch, per tonne or per cooking cycle has greater diagnostic value. It allows the team to compare thermal demand against production, recipe changes and cleaning activity.
Compressed air also deserves direct measurement. A substantial overnight or weekend air baseload can indicate leakage, inappropriate standby behaviour or equipment operating outside normal production requirements. The meter identifies the pattern; engineering investigation identifies the cause.
How predictive analytics finds food-plant energy waste earlier
Anomalies are prompts for investigation
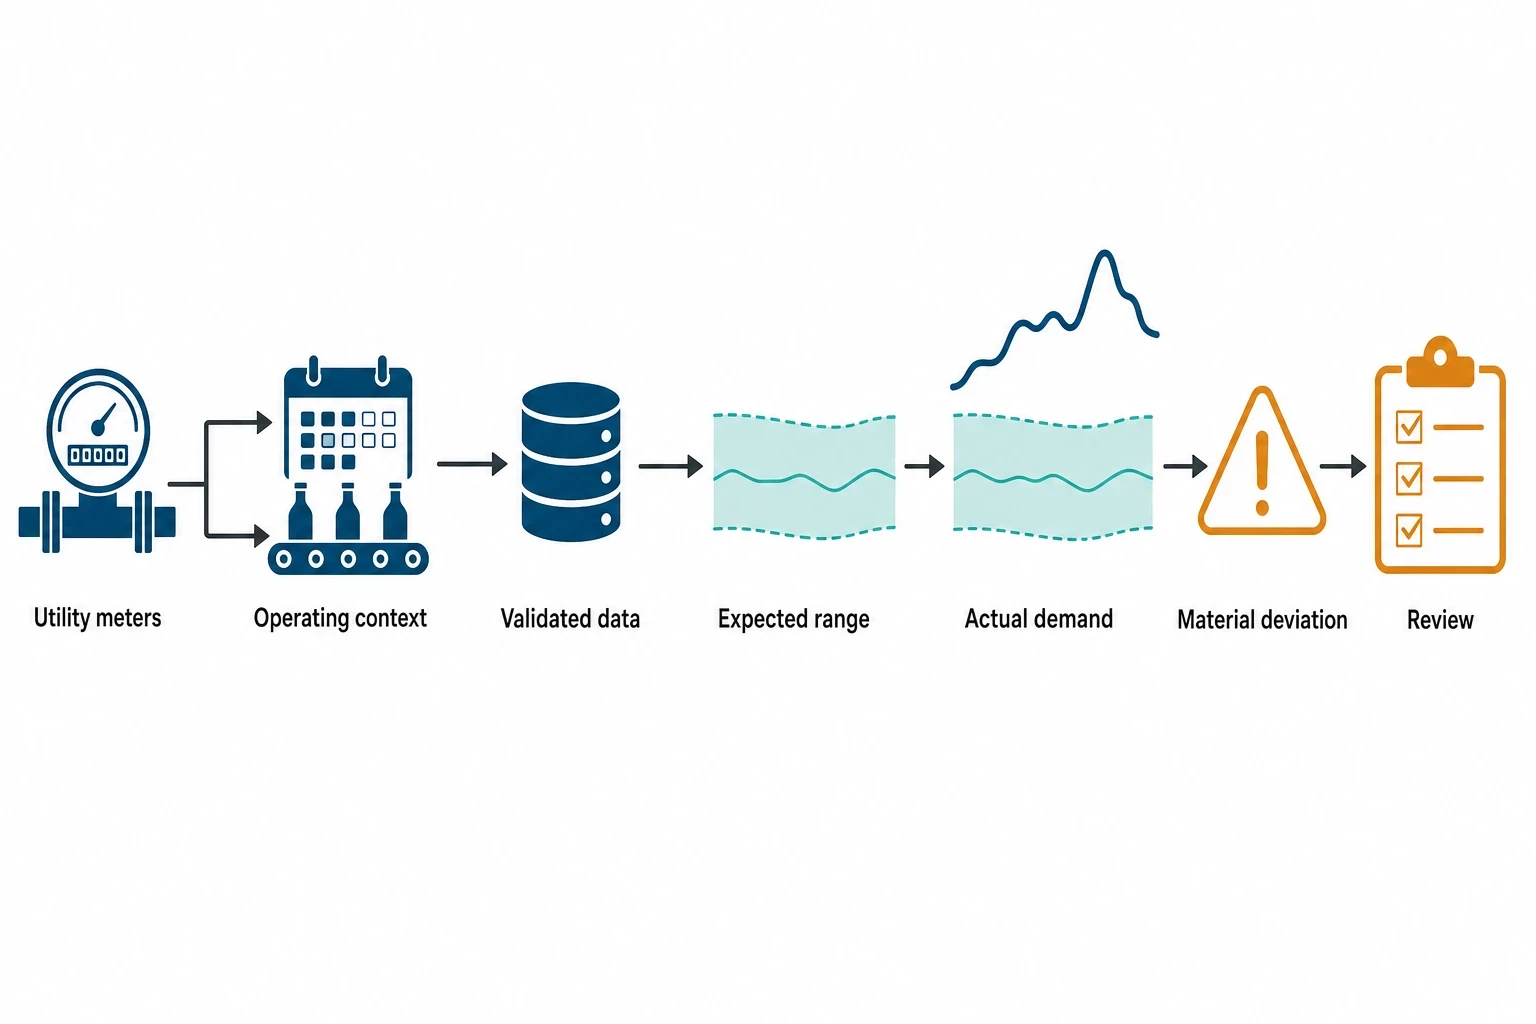
Food plants generate recurring patterns. Refrigeration responds to weather, stock loading and door activity. Steam responds to cooking and cleaning. Compressed air follows line operation. Analytics can establish an expected operating range from historical data and flag a material deviation for review.
An anomaly does not provide a maintenance diagnosis. It identifies a change that merits attention while the evidence remains current.
Examples include:
- Refrigeration electricity rising while temperature targets and stock levels remain broadly comparable.
- Boiler gas consumption increasing for similar production volumes.
- Compressed-air demand continuing through a planned shutdown.
- Water consumption increasing during a fixed CIP programme.
- Electrical demand peaks occurring when several major loads begin together.
This approach can identify costly behaviour that remains within a machine’s normal alarm limits. A compressor may continue to operate without fault indication, yet run inefficiently for long enough to affect energy intensity. A boiler may still meet steam demand while using more gas than comparable batches require.
Forecasting supports better operating decisions
Forecasting applies the expected demand profile to upcoming production schedules. It can help plant teams judge whether anticipated consumption reflects volume, product mix and operating conditions before a billing period closes.
For refrigeration, a sustained difference between forecast and actual demand can prompt review before it becomes a large cost or product-integrity issue. For thermal processes, the forecast can distinguish a legitimate increase in energy resulting from product mix from an avoidable increase caused by process drift.
Data quality determines whether these insights are trusted. Each meter or source should have a defined unit, timestamp, location, expected range and accountable owner. Commissioning should also confirm meter scaling, missing-data handling and the relationship between production records and utility readings. A dashboard built on poorly labelled data produces misleading KPIs.

Track energy consumption, emissions, and process parameters with seamless PLC/SCADA integration via Modbus, OPC-UA, and MQTT protocols.
Read-only utility monitoring protects food-plant operations
Monitoring should not become a process-control change
Facilities producing high-care foods protect established process controls, hygiene procedures and food safety disciplines. An energy intelligence platform should therefore gather authorised readings without issuing operating commands to plant equipment.
A site survey should identify existing meters and available data, then target gaps that obstruct energy decisions. This usually means assessing the main incomer alongside large loads and areas such as refrigeration packs, cold stores, boiler houses, compressed-air systems, production lines and CIP activity.
The survey should also identify the production context required for meaningful analysis. Batch completions, tonnes produced, operating hours, product family, shift pattern and cleaning cycles can each explain an energy change. The correct mix depends on the process.
Validation turns installation into a usable system
A meter installation alone does not create energy intelligence. Teams need to validate the data before it informs operational decisions or sustainability reporting.
Commissioning should check:
- Meter accuracy, scaling and units.
- Time alignment across utility and production data.
- Data completeness during production, shutdown and cleaning periods.
- The hierarchy between incoming supply, sub-meter, process area and asset.
- KPI calculations against known operating events.
- Alert thresholds against realistic plant conditions.
This work prevents common errors. A reversed meter direction, incorrect pulse scaling or incomplete batch record can create a false efficiency loss. Conversely, a well-validated dataset lets a maintenance manager trace a detected deviation from site total to the relevant area and operating period.
ISO 50001 and ESOS Phase 4 make evidence more valuable
ISO 50001:2018 provides the operating framework
ISO 50001:2018 remains the current edition of the international energy management systems standard. It provides a framework for organisations to establish, implement, maintain and improve an energy management system.
For food manufacturers, its value lies in disciplined energy management rather than any particular technology. The standard uses energy baselines and energy performance indicators to support continual improvement. A digital energy intelligence platform can provide metered evidence, while management retains responsibility for objectives, resources, corrective action and review.
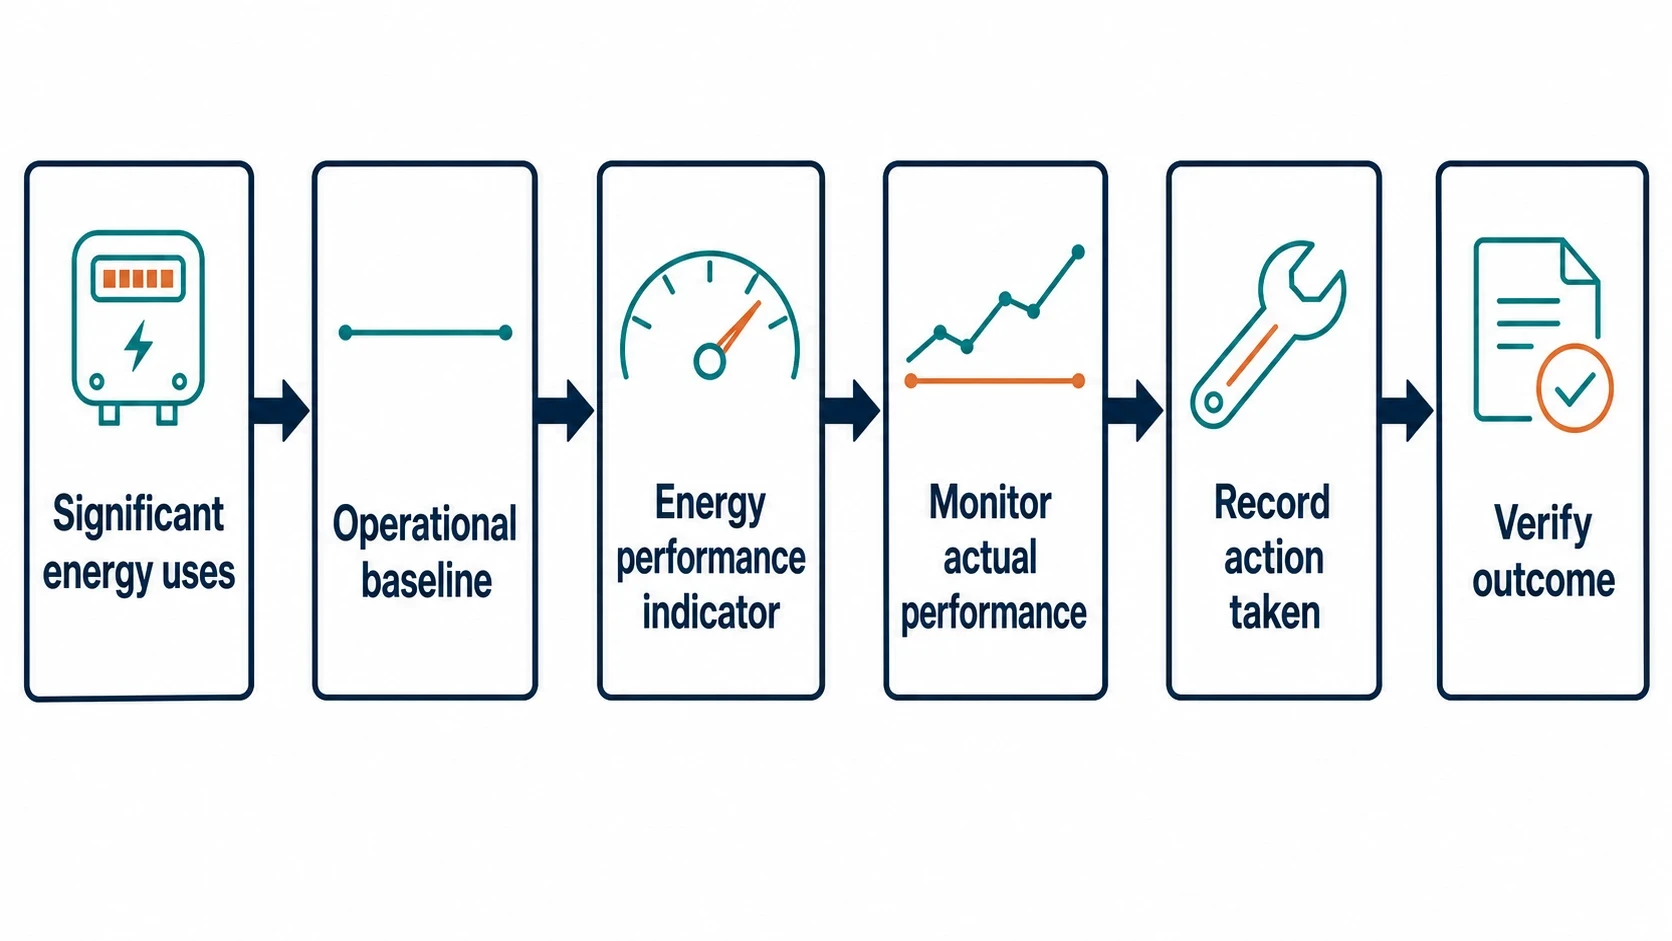
A practical workflow is straightforward:
- Identify significant energy uses, such as refrigeration, steam generation and compressed air.
- Set energy baselines that reflect relevant operational conditions.
- Define energy performance indicators, such as cost per tonne or steam per batch.
- Monitor actual performance against expected performance.
- Record the maintenance, operating or process action taken.
- Verify that the change reduced consumption without affecting quality, safety or output.
This creates an auditable connection between a detected loss, the action taken and the result.
ESOS Phase 4 requires stronger records of action
The Environment Agency published full ESOS Phase 4 guidance in July 2026. The Phase 4 compliance deadline is 5 December 2027.
The scheme requires qualifying organisations to determine total energy consumption and identify areas of significant energy consumption. Organisations can apply a de minimis approach, but assessments must cover at least 95% of total energy consumption.
Phase 4 also increases the importance of verified evidence. The ESOS report and notification of compliance must include savings achieved during the compliance period, the implemented measures that generated those savings and the relevant savings category. Participants must also review action-plan commitments and explain measures that were proposed but not implemented.
An energy intelligence platform for manufacturing supports that work by retaining time-stamped utility records, production-linked intensity data and a history of investigated deviations. It does not replace formal ESOS compliance responsibilities, but it can reduce the effort required to assemble credible evidence.
The ISO 50001 certification route has particular relevance. Where ISO 50001 certification covers total or significant energy consumption, as applicable, ESOS Phase 4 guidance reduces certain obligations. Participants using that route do not need to produce an ESOS report or appoint a lead assessor.
Building the case for energy efficiency investment
IETF has closed, but measurement still underpins projects
The UK Government’s Industrial Energy Transformation Fund supported investment in efficient energy use and lower-carbon technologies for businesses that use high levels of energy in England, Wales and Northern Ireland. The Government closed the IETF in July 2025 and states that no successor fund is planned, although projects awarded through existing competition windows remain funded.
The closure changes the funding context. It does not alter the need for a defensible investment case.
Plant teams still need to show where energy is consumed, what causes the loss, which measure will address it and how savings will be verified. Utility data linked to production makes that case more credible than an estimate based solely on annual invoices.
From alert to verified saving
The platform creates value when the plant acts on the information. A useful operating rhythm assigns material alerts to people who can investigate, records the finding and reviews the result after the action.
Daily reviews can focus on significant deviations. Weekly discussions can address recurring losses. Monthly management reviews can track energy intensity, costs, completed actions and whether expected savings have appeared in the data.
This article reflects the independent analysis and editorial opinion of EnerTherm Engineering. Product names, trademarks, and brands mentioned belong to their respective owners. EnerTherm Engineering is not affiliated with, endorsed by, or a licensee of any third-party software or product mentioned unless explicitly stated.

Technical Manager — EnerTherm Engineering
John Naranjo is Technical Manager at EnerTherm Engineering, bringing specialist expertise in chemical and environmental engineering. He recently led the implementation of Omni Vision, EnerTherm's real-time energy and utility monitoring platform. He holds an MSc in Environmental Engineering from the University of Huelva and a BSc in Chemical Engineering, with memberships in both the Energy Institute and IChemE.
