Why Food Plants Lose 20-30% of Compressed Air
Automated leak monitoring targets 20-30% system losses under ISO 11011:2024.
Poorly maintained compressed-air systems can lose 20–30% of compressor output through leakage, according to US Department of Energy guidance. That figure describes lost air capacity, not an automatic 20–30% reduction in electricity use. The financial result depends on how each compressor loads, unloads, modulates or stages alongside other machines.
That distinction matters in food and beverage factories. Compressed air supports packaging machinery, pneumatic actuators, valves, conveyors, blow moulding, instrumentation and other production duties. It is also routinely present during changeovers, cleaning periods and idle hours. Electricity meters may show a steady compressor load even when production has stopped.
The UK Energy Technology List states that compressed-air systems consume around 10% of industrial electrical consumption. Food plants therefore need more than a periodic leak survey. They need evidence showing when air demand occurs, which lines create it, and whether lower demand translates into lower compressor kWh.
Continuous monitoring turns a familiar maintenance problem into a measured investment decision.
Why compressed air waste persists in food plants
Compressed air reaches almost every part of a production site. That broad use makes waste difficult to isolate through utility bills alone.
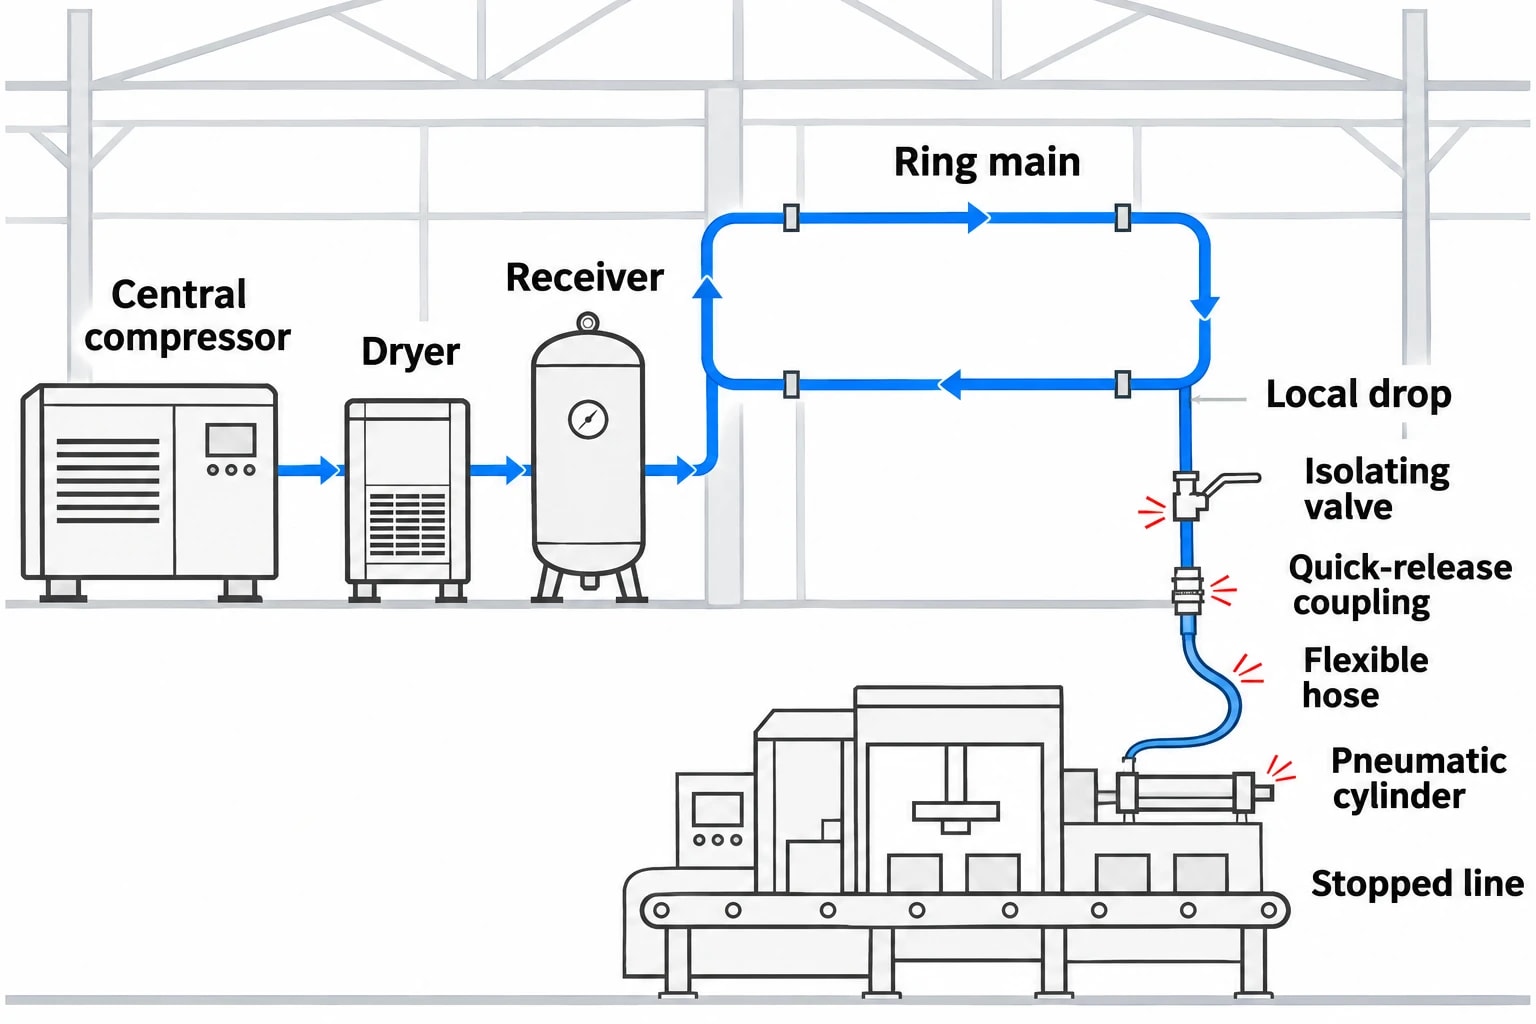
A factory may operate central compressors, dryers, receivers, ring mains and local drops serving several packaging halls. Changes accumulate over time. Engineers add a branch for a new line, retain old pipework after an upgrade, or install temporary hose connections during a production issue. Each alteration can introduce leakage, pressure drop or air use that no longer serves a process requirement.
The resulting cost is often hidden in the main electricity bill.
Leakage is continuous demand
Leaks consume air whenever the network remains pressurised. Common sources include:
- Quick-release couplings and flexible hoses
- Threaded joints, fittings and valves
- Filter, regulator and lubricator assemblies
- Condensate drains
- Damaged pneumatic cylinders
- Isolating valves that do not close fully
- Pipework added during line modifications
US Department of Energy guidance says proactive leak detection and repair can reduce leakage to less than 10% of compressor output. A repair campaign can produce a worthwhile initial result, but food sites need a continuing programme. Hoses age, washdown affects fittings, and production changes create new connections.
Off-production demand provides the clearest starting point. If all production lines are stopped but the compressor continues cycling, the plant is supplying leakage, control air, unisolated equipment and inappropriate end uses. Site inspection identifies the individual causes, while flow and power trends establish the scale and timing of the problem.
Food operations create irregular demand patterns
A food factory does not run as a single steady process. Demand changes with batch schedules, shift patterns, line clearance, allergen changeovers, cleaning and seasonal production peaks. A monthly electricity figure cannot distinguish productive compressed-air use from air drawn during a stopped line.
Production-normalised analysis is therefore essential. Air flow per tonne, kWh per batch or compressor kWh per thousand packs can show whether a higher utility cost followed higher output or deteriorating performance.
Food safety also affects end-use decisions. The Food Standards Agency’s review of allergen-cleaning guidance reports that compressed-air use is discouraged in many guidance documents because it can spread allergenic proteins and recontaminate adjacent equipment or clean areas. Where a factory uses compressed air for cleaning or blowing product debris, the process team should assess the duty within its HACCP controls. Reducing inappropriate air use can lower energy demand while strengthening hygiene controls.
Omni Vision delivers turnkey utility metering, CO2 tracking, and AI-powered production KPI intelligence — giving you real-time dashboards and actionable insights across your entire facility.
The four causes of compressed-air energy loss
Leaks draw attention because operators can hear them. The larger savings opportunity often combines leakage reduction with pressure, control and demand-side changes.
Leakage and artificial demand
A leak does more than waste air. It can lower local pressure, encourage longer compressor run time and prompt operators to raise the central pressure setpoint. That response can turn a local maintenance defect into a factory-wide energy penalty.
Air use that does not contribute to production is often described as artificial demand. Leaks are one form. Open blowing, unnecessary purging and permanently connected idle equipment are others. A site should identify each significant demand source before assuming that all additional flow is a production need.
Excess pressure and distribution losses
A packaging machine at the far end of a ring main may suffer from a blocked filter, undersized pipework, restrictive hose or poorly selected regulator. Raising compressor discharge pressure may restore operation at that machine, but it also raises demand across the rest of the system.
US Department of Energy guidance gives a useful rule of thumb for systems around 7 bar: a 0.14 bar increase in discharge pressure can increase energy use by about 1% at full output flow. The effect can be higher where leakage and other unregulated uses form a material share of demand.
Plant teams should measure pressure at the critical point of use as well as at the compressor discharge. The pressure profile shows whether the site needs a higher setpoint or a local repair.
Poor compressor control and sequencing
A compressor can consume significant power while unloaded. Carbon Trust guidance states that idling compressors can consume 20–70% of full-load power, depending on compressor type and control arrangement.
This issue arises where multiple compressors operate without a control strategy matched to actual demand. One compressor may provide a base load while another trims variable demand, but production changes can leave both operating inefficiently. A repaired leak may also fail to cut electricity use if the control logic keeps compressors running unloaded.
Electricity savings occur when reduced air demand changes compressor operating behaviour. Continuous power and flow data verifies whether that happened.
Inappropriate end uses
Compressed air is convenient, responsive and widely available. It is also an expensive energy carrier. Open blowing, spot cooling, product movement and drying should be reviewed against the process requirement.
The review should record:
- The required duty and air quality
- Pressure and flow at the point of use
- Operating hours and production dependency
- Food-safety and contamination controls
- Feasible alternatives, such as fans, blowers, mechanical devices or vacuum equipment
Some applications require compressed air. Others persist because the air line was already present. Separating those cases prevents maintenance teams from treating every demand problem as a leak problem.
How to measure a credible compressed-air baseline
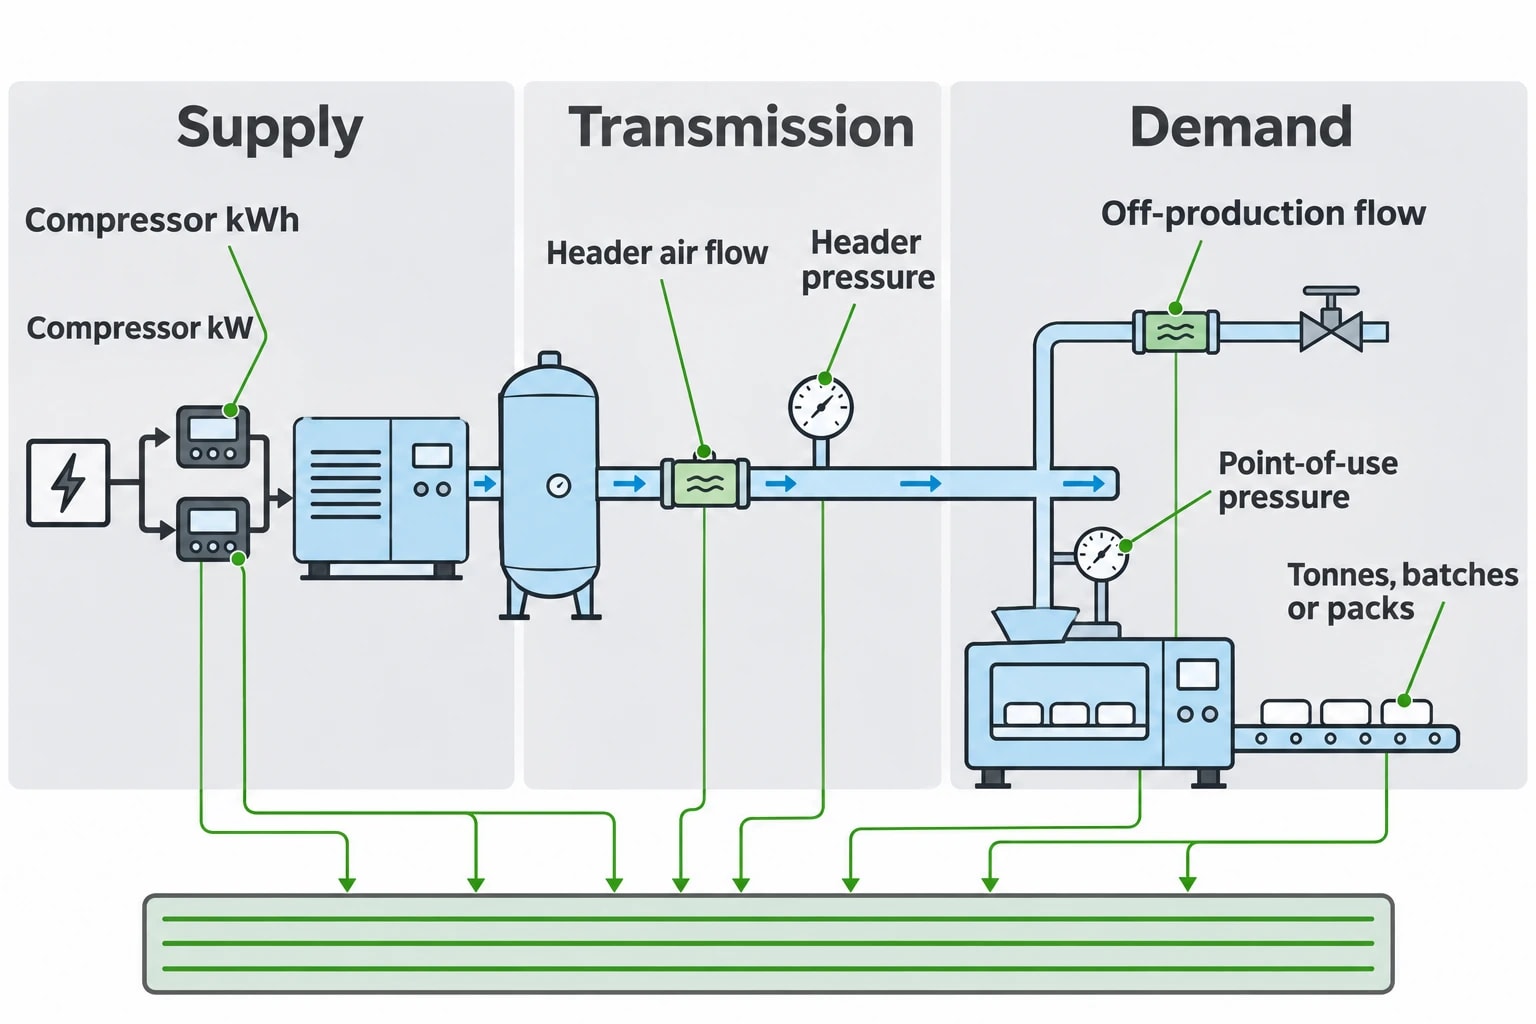
ISO 11011:2013 provides the framework for assessing compressed-air energy efficiency across supply, transmission and demand. ISO confirms that the published edition considers the system from energy input through to useful work, including productive end uses and compressed-air waste.
That whole-system approach matters. A new compressor alone may not solve a distribution restriction. A leak repair alone may not reduce electricity consumption if controls do not respond. A baseline needs to show the relationship between air demand and electrical input.
Measure power, flow, pressure and production together
A useful monitoring plan includes the following measures.
| Measure | What it shows | Decision supported |
|---|---|---|
| Compressor kWh | Total electricity used to generate air | Cost baseline and verified savings |
| Compressor kW | Loading, unloading and idle operation | Control and sequencing changes |
| Header air flow | Total system demand | Leakage and unproductive demand |
| Header pressure | Central supply stability | Setpoint management |
| Point-of-use pressure | Local restrictions and pressure drop | Distribution repairs |
| Off-production flow | Standing demand when lines are stopped | Leak and isolation priorities |
| Tonnes, batches or packs | Productive output | Energy-intensity analysis |
The monitoring period must include normal production, low-output shifts, changeovers, cleaning and scheduled shutdowns. A short survey can identify a leak, but it cannot reliably represent a system whose demand changes through the week.
Establish a meaningful off-production test
A controlled off-production test can provide an early screening result. Once the plant has safely stopped production equipment, the team should record air flow, header pressure and compressor power over a defined period. The test must account for essential control air, refrigeration interfaces and equipment that must remain live.
The result is not automatically a leak rate. It is standing air demand. Site teams should then isolate sections progressively, inspect known high-risk areas and use ultrasonic detection to find physical faults.
This gives maintenance teams a measured priority list rather than a general instruction to find leaks.
Building the cost-benefit case without overstating savings
The 20–30% leakage figure is useful as a warning sign. It should not be multiplied directly by annual compressor electricity consumption unless measurements prove that relationship for the site.
Fixed-speed load-unload compressors, variable-speed compressors and multi-compressor installations respond differently to lower air demand. In one plant, a leak repair may prevent a compressor from loading overnight. In another, the same reduction may leave an unloaded compressor consuming almost the same power until controls are changed.
Use measured before-and-after power
A business case should calculate energy savings from recorded electrical behaviour under comparable operating conditions.
For example, consider a hypothetical site where monitoring finds that compressors draw an average of 55 kW through 48 non-production hours each week. After isolating idle equipment, repairing leaks and adjusting compressor control, comparable non-production demand falls to 20 kW.
The measured electrical reduction is 35 kW. Over 52 weeks, that equals 87,360 kWh. At an assumed electricity cost of £0.15 per kWh, the annual saving is £13,104.
That calculation relies on a measured reduction in kW, not on the proportion of air output attributed to leakage. The same method can be applied to changeovers, line stoppages and production-normalised performance.
Separate measures to avoid double counting
A sound project appraisal records each measure separately:
- Leak repairs and isolation improvements.
- Pressure-drop repairs and setpoint reduction.
- Compressor sequencing or control changes.
- Removal or replacement of inappropriate compressed-air uses.
- Metering, monitoring and verification costs.
The site should then verify electricity savings after each phase. A single kWh reduction cannot be claimed twice as both a leak-repair saving and a compressor-control saving.
Maintenance savings may also be material. Reduced run hours can defer servicing and lessen compressor wear, but those benefits should be assessed separately from electricity savings unless maintenance records establish the cost reduction.
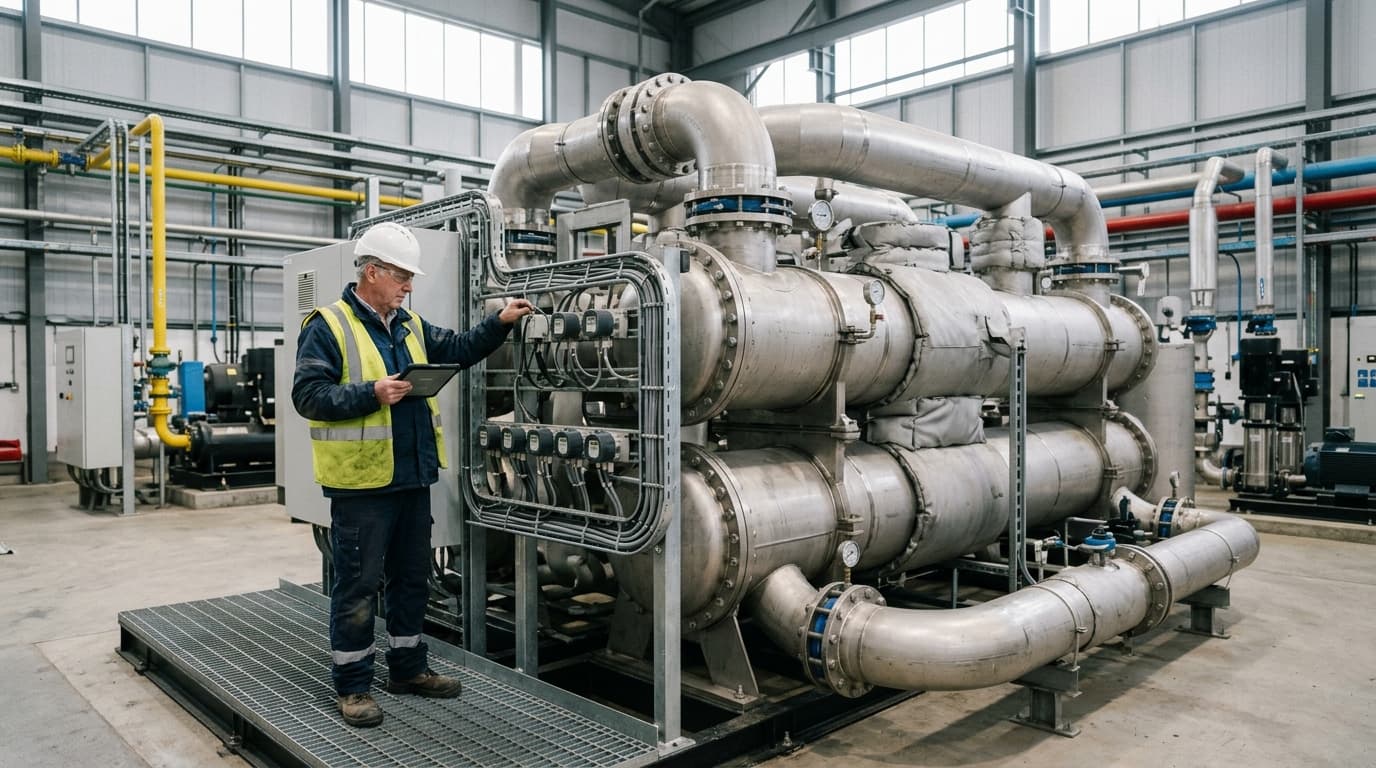
Track energy consumption, emissions, and process parameters with seamless PLC/SCADA integration via Modbus, OPC-UA, and MQTT protocols.
Continuous monitoring changes the maintenance cycle
Periodic ultrasonic surveys remain valuable because they locate leaks. Continuous monitoring adds operating context that a survey cannot provide.
A rise in overnight air flow can identify a new standing-load problem. A widening pressure difference across a treatment section can indicate a restriction. A compressor power trend can expose unloading through weekends. Production-linked data can show whether air consumption per tonne rose after a packaging-line change.
From alarm to verified repair
Monitoring works best when it supports a defined response process:
- Set a baseline for flow, pressure, compressor power and production output.
- Define acceptable off-production flow and pressure bands.
- Investigate sustained deviations and confirm the cause on site.
- Assign corrective work to a named owner and completion date.
- Verify the result using flow and power data after repair.
- Review control settings so reduced air demand becomes reduced electricity consumption.
A leak repair has limited value if the compressor continues to idle at its previous power level.
Installation points that support useful decisions
Metering should begin at compressor electrical supply and the main air header. Larger plants may then add branch meters for packaging halls, process areas or other high-demand zones. Pressure sensors should include the main header and at least one critical end use where low pressure has historically affected performance.
The aim is not to meter every pneumatic device. It is to create enough visibility to separate supply inefficiency, distribution loss and demand-side waste.
Compressed air data for ESOS and energy management
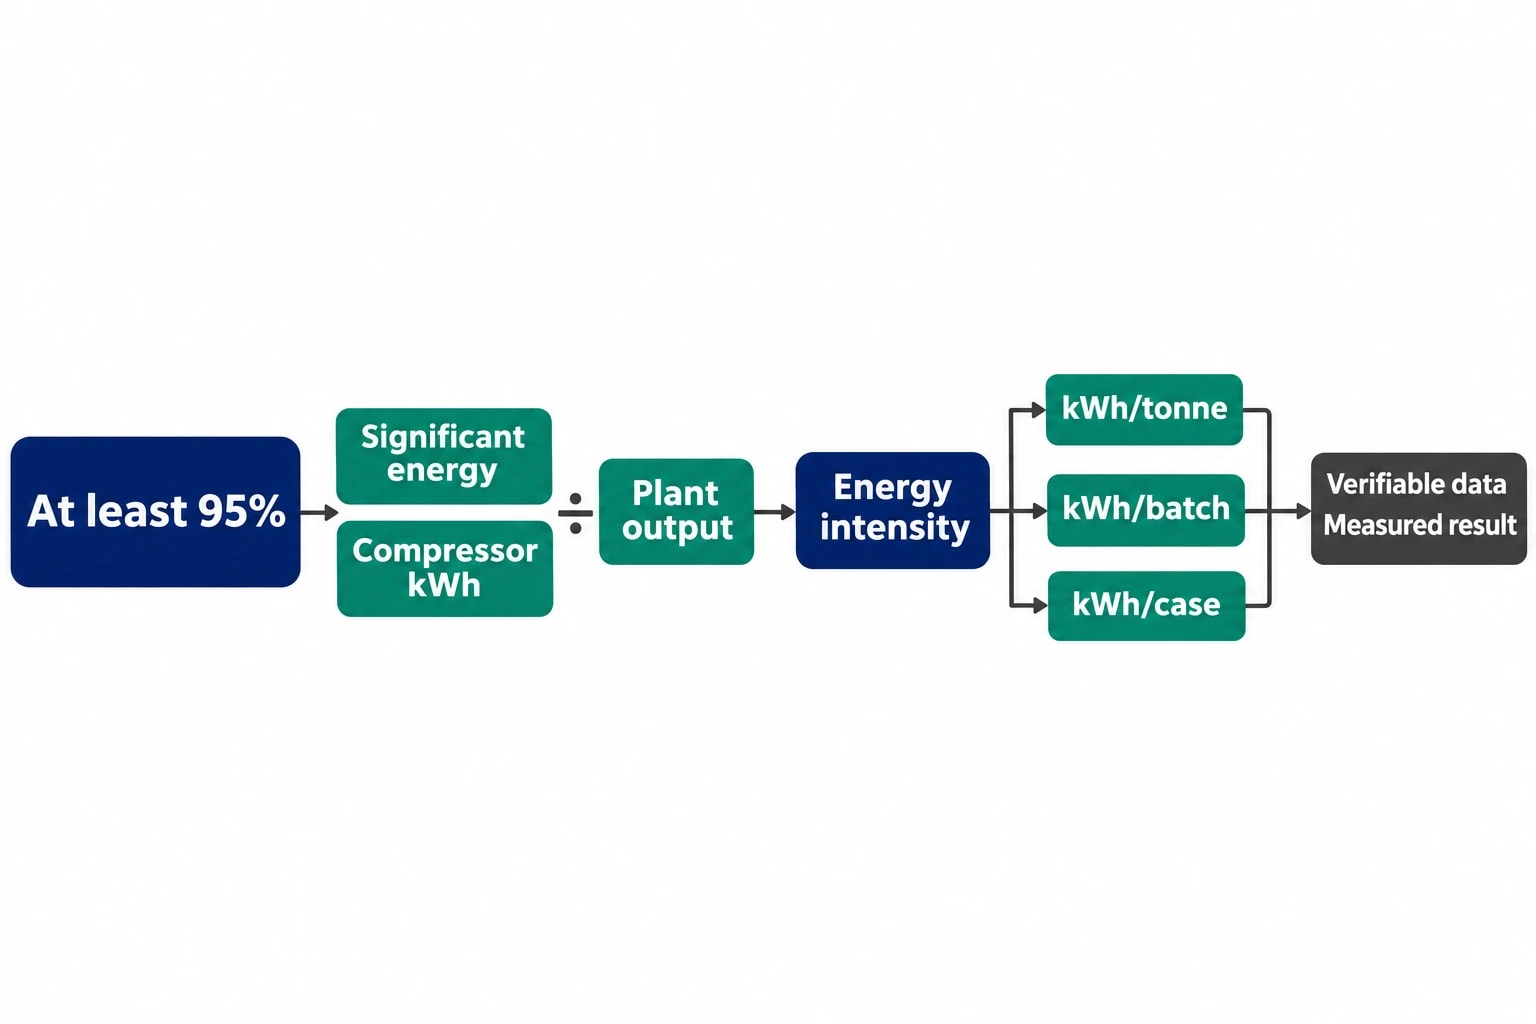
For qualifying UK organisations, compressed-air monitoring can strengthen the evidence behind an Energy Savings Opportunity Scheme assessment. ESOS Phase 4 requires significant energy consumption to account for at least 95% of total energy consumption. Participants must calculate energy-intensity ratios for industrial processes using verifiable data where reasonably practicable.
Compressor kWh per tonne, batch or case can support that industrial-process analysis where compressed air is a material energy use. The metric should match the plant’s actual output and remain consistent between reporting periods.
Monitoring does not replace an ESOS assessment, site visit or lead-assessor review. It gives the assessor stronger evidence of when compressed air is consumed, where opportunities sit and whether previous actions delivered a measured result.
Where food plants should start
The first project should focus on the point where avoidable demand and production risk meet. For one factory, that may be persistent overnight flow in a packaging hall. For another, it may be a pressure problem at a single line that has raised the entire factory setpoint. A third may find compressors idling through predictable changeovers.
Plant managers should be able to answer five questions:
- How much compressor electricity is consumed per shift and per unit of output?
- What air flow and electrical load remain when production stops?
- Where does the largest pressure drop occur between supply and critical end use?
- Which air uses have a defined process and food-safety requirement?
- Does compressor kW fall after repairs and changes to demand?
Those answers create a defensible investment case and prevent a food plant from treating compressed air as an unavoidable overhead when much of the cost can be measured, assigned and reduced.
This article reflects the independent analysis and editorial opinion of EnerTherm Engineering. Product names, trademarks, and brands mentioned belong to their respective owners. EnerTherm Engineering is not affiliated with, endorsed by, or a licensee of any third-party software or product mentioned unless explicitly stated.

Technical Manager — EnerTherm Engineering
John Naranjo is Technical Manager at EnerTherm Engineering, bringing specialist expertise in chemical and environmental engineering. He recently led the implementation of Omni Vision, EnerTherm's real-time energy and utility monitoring platform. He holds an MSc in Environmental Engineering from the University of Huelva and a BSc in Chemical Engineering, with memberships in both the Energy Institute and IChemE.
