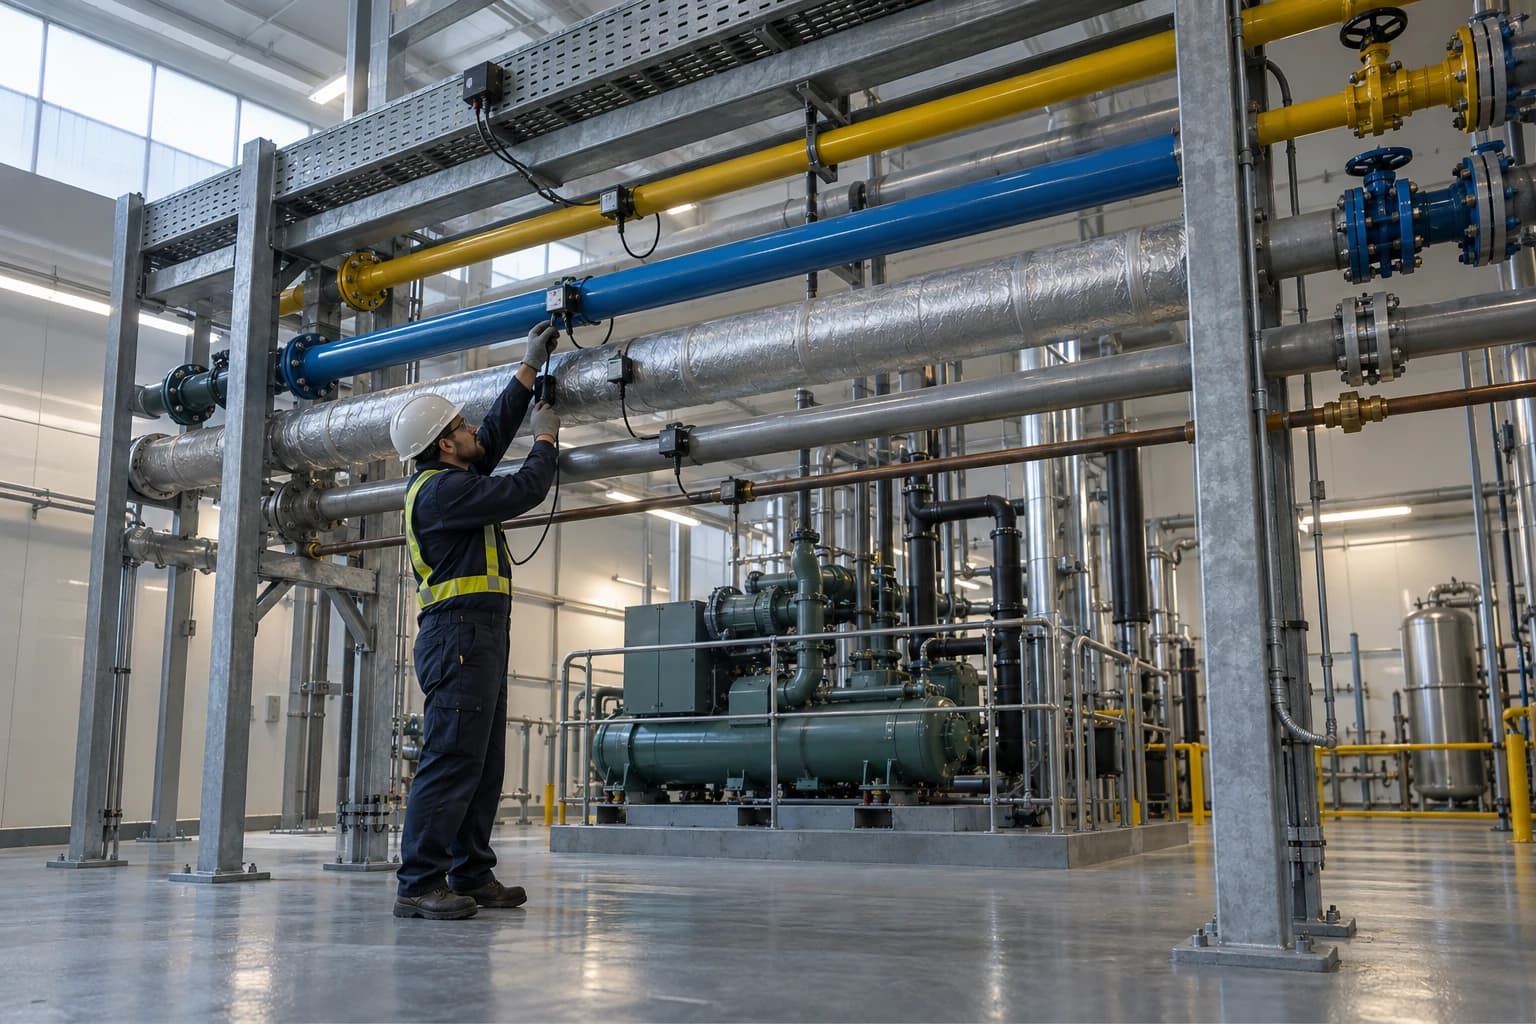
Why Food Plants Monitor Six Utilities with Omni Vision
HACCP-compliant read-only metering supports ISO 50001:2018 audits and 15-25% savings.
An energy management system for the food and beverage industry measures and analyses the electricity, gas, water, steam, compressed air and oil required to make, preserve and package food.
A cold store can draw substantial electricity through a weekend with no despatches. A boiler can consume more gas when condensate return deteriorates. A compressed-air leak can continue through every break and shift change without appearing clearly on a monthly supplier invoice. These are operational issues, yet invoice data arrives too late and at too broad a level to locate them.
The Food and Drink Federation’s Net Zero Handbook sets out practical decarbonisation guidance for UK manufacturers. Reliable utility data is an essential starting point. A factory cannot set a credible baseline, target its largest sources of consumption or verify an improvement without knowing how utilities move through the process.
Omni Vision brings six core utility streams into a central energy intelligence platform. EnerTherm Engineering combines field instrumentation and non-invasive PLC connectivity with EPSA cloud-based analytics, giving food and beverage teams a real-time view of utility demand alongside production activity. The aim is practical: identify abnormal use early, assign an owner and measure whether corrective work improved performance.
Why an energy management system for the food and beverage industry monitors six utilities

Electricity is highly visible because it appears on every supplier bill. The other five utilities can carry equally material costs and often influence electricity use, product quality or plant availability.
Food and beverage factories rely on interdependent utility systems. Refrigeration demand affects electricity consumption. Boiler performance affects gas use and steam availability. Water losses can increase water, heating and effluent costs together. Compressed-air demand can increase compressor electricity use even when production has stopped.
Monitoring six utilities provides the context needed to investigate a change rather than merely record it.
| Utility | Typical food and beverage uses | What monitoring can show |
|---|---|---|
| Electricity | Refrigeration, motors, pumps, packaging, HVAC | Base load, peak demand, cold-store use, idle equipment |
| Gas | Boilers, ovens, dryers and direct-fired processes | Fuel intensity, abnormal firing patterns, out-of-hours consumption |
| Water | Cleaning-in-place, rinsing, ingredients and cooling | Continuous flow, excessive cleaning use, unexplained night demand |
| Steam | Cooking, sterilisation, heating and cleaning | Demand variation, distribution losses, condensate-return issues |
| Compressed air | Pneumatics, packaging machinery, valves and instruments | Leakage, unsuitable pressure settings and non-production demand |
| Oil | Thermal-oil systems, heating oil and site-specific heat duties | Fuel intensity, burner run-time and heat-use trends |
A site meter may show that total electricity consumption increased. It cannot establish whether the cause lies in refrigeration, a packaging line, a cleaning programme or an ancillary service. Sub-metering creates that distinction.
For example, electricity demand that rises alongside cold-store activity but stable production tonnage directs investigation towards refrigeration plant operation. Higher gas, steam and water consumption during cleaning periods may point to cleaning-in-place activity, water temperature, boiler operation or programme sequencing. The evidence narrows the engineering question.

Omni Vision delivers turnkey utility metering, CO2 tracking, and AI-powered production KPI intelligence — giving you real-time dashboards and actionable insights across your entire facility.
Metering six utilities around the food-production process
Main incomers establish the total, sub-meters explain it
Incoming utility meters establish a site baseline. They do not explain which departments, assets or operating periods created the demand.
A food-plant metering strategy should follow the process map and existing utility distribution. Common measurement boundaries include refrigeration distribution, cold stores, boiler houses, compressed-air generation, cleaning-in-place systems, cooking equipment, ovens, dryers, production lines and packing halls.
The right boundaries differ by factory:
- A dairy may need refrigeration, cleaning-in-place and steam data linked to batches.
- A bakery may focus on oven gas use, proofing conditions and packaging-line electricity.
- A beverage producer may need water, compressed air and refrigeration mapped against filling activity.
- A chilled prepared-food facility may prioritise cold-store electricity, cooking steam and cleaning demand.
This structure allows plant teams to compare equivalent operating periods. Relevant measures include electricity per tonne of finished product, gas per batch, steam per cleaning cycle, water per line and compressed-air use during non-production hours.
Production-linked KPIs prevent misleading conclusions
A lower daily electricity total does not prove improved energy performance if the factory produced less. Production-linked KPIs place utility demand against output, operating hours, product mix and planned cleaning activity.
Useful indicators include:
- Electricity per tonne of finished product
- Gas per batch or production hour
- Water per cleaning cycle
- Steam per tonne of product
- Compressed-air baseload outside production
- Utility cost per tonne by department or product family
The purpose is to give production, engineering and sustainability teams a shared measure that reflects the work performed by the factory.
How Omni Vision connects utility data without changing process control

Read-only data collection protects production integrity
Energy monitoring must not introduce a control path into food production equipment. The production PLC remains responsible for recipes, temperatures, interlocks, sequencing and machine operation.
Omni Vision uses read-only connectivity through established industrial protocols including Modbus, OPC-UA, BACnet and MQTT. Its architecture uses a one-way encrypted data flow, maintaining zero-write access to plant systems. The platform receives the information needed to analyse utility demand without issuing commands to the operational control system.
That separation allows sites to add utility visibility while preserving established production controls and validation arrangements.
A common data set replaces fragmented records
Many plants collect energy information from utility invoices, local meter displays, manual reads, BMS screens and spreadsheets. Each source may use a different interval, location reference or naming convention. Finding the reason for an abnormal week can then involve several departments and versions of the same data.
Omni Vision centralises metered utility data and relevant production information for live views, historical trends, alerts and production-linked reporting. A consistent time series makes it easier to compare departments, identify recurring operating patterns and review the effect of completed maintenance work.
Data quality remains important. A commissioning plan should confirm meter location, utility type, engineering units, time synchronisation, scaling and comparison with known loads or reference readings. A meter upstream of several departments cannot support a departmental KPI, regardless of dashboard quality.
Real-time energy analytics for refrigeration, steam and compressed air
Refrigeration trends reveal the shape of demand
Refrigeration can be a major electricity user in chilled and frozen food operations. A monthly bill cannot distinguish normal cold-store demand from a sustained increase linked to site activity or equipment behaviour.
Interval data allows teams to compare similar shifts, production days and operating periods. A higher electricity profile may prompt checks of door management, defrost schedules, condenser condition, evaporator performance, suction-pressure control or abnormal heat gains from adjacent areas.
The monitoring platform does not establish root cause alone. It identifies the time, area and scale of a deviation so engineers can investigate with a defined evidence trail.
Gas and steam data should be reviewed together
Gas metering at the boiler house shows fuel input. Steam metering shows steam supplied to the process. Reviewing both alongside production and cleaning schedules reduces the risk of assigning a problem to the wrong system.
An increase in gas per tonne may result from reduced throughput, boiler short cycling, a changed cleaning schedule, distribution losses or reduced condensate return. Steam and production data help teams distinguish these possibilities before committing maintenance time or capital.
This matters in cooking, blanching, sterilisation and cleaning, where steam demand can vary significantly with product schedule and batch activity.
Compressed-air profiles expose non-production consumption
Compressed air is frequently investigated after a pressure problem affects a line. Leakage and unnecessary demand can persist without causing an immediate production interruption.
A monitored profile establishes normal demand during production, breaks and shutdown. A stable overnight load can indicate leakage, equipment left connected or an isolation issue. After a repair campaign or pressure-setpoint review, the same profile can verify whether consumption has changed.

Track energy consumption, emissions, and process parameters with seamless PLC/SCADA integration via Modbus, OPC-UA, and MQTT protocols.
HACCP-compliant installation of monitoring equipment
The HACCP plan should shape the project scope
HACCP, Hazard Analysis and Critical Control Point, principles require food businesses to identify hazards, determine critical control points and critical limits, monitor them, take corrective action, verify arrangements and maintain records. Installation work for energy monitoring can affect food safety even though meters, panels and communications equipment are not food-contact items.
Work near open product, high-care zones, hygienic surfaces, service voids and cleaning areas requires assessment through the site’s food safety management system. Quality, engineering and production teams should identify risks before installation begins.
Potential hazards include contractor movement, drilling dust, loose materials, damage to hygienic finishes, water ingress, disrupted cleaning routines and access near exposed product. The required controls depend on the area, process and planned activity.
Installation controls protect food safety and future access
A suitable project plan commonly includes:
- A site survey involving engineering, quality and production representatives
- Hygienic-zone classification and agreed contractor access routes
- Installation windows that avoid sensitive production or cleaning activities where necessary
- Controls for drilling, containment, debris removal and clean-down
- Appropriate enclosures and cable routes for wet or washdown locations
- Inspection and documented release before the affected area returns to normal use
- Meter commissioning against known loads, historic readings or reference measurements
Installation decisions also affect the usefulness of the resulting data. A poorly located meter may include unrelated loads, while an inaccessible enclosure can create a maintenance difficulty in a high-care area. Early agreement on meter boundaries, cable routes and maintenance access avoids these defects.
Energy data supports investigation, not food-safety control
Utility data can provide helpful operational context. An unusual steam trend may support investigation of a process disruption. Water use can help review the timing and consistency of a cleaning programme. Electricity data may show when refrigeration demand changed.
These records do not replace monitoring at critical control points or established HACCP documentation. The plant’s food safety management system remains responsible for food-safety controls, corrective action and verification.
ISO 50001:2018 and energy-performance evidence

ISO 50001:2018 specifies requirements, with guidance for use, for organisations establishing and improving an energy management system. The standard uses data to support energy decisions, measure results, review performance and drive continual improvement.
For food and beverage manufacturers, six-utility monitoring can support core elements of this discipline:
- Establishing a reliable energy baseline
- Identifying significant energy uses, such as refrigeration, steam generation and compressed air
- Defining energy performance indicators that account for output and operating conditions
- Investigating deviations from expected consumption
- Verifying whether improvement actions changed energy performance
- Retaining traceable records for management review and audit
A dashboard alone does not constitute an energy management system. Teams still need to establish objectives, allocate responsibility, investigate exceptions and review completed actions. Data becomes valuable when it supports those decisions consistently.
Omni Vision can reduce the effort required to assemble a shared utility record across operations, engineering and sustainability functions. Automated collection also supports Scope 1 and 2 emissions reporting by providing a clearer account of site fuel and electricity consumption.
Turning alerts into engineering action
Anomaly detection needs production context
An alert should identify a deviation that merits review. Routine variation should not create repeated alarms that staff learn to ignore.
EPSA cloud-based analytics can compare current utility behaviour with historic patterns, operating periods and production schedules. The platform may identify elevated refrigeration consumption outside expected activity, unusual boiler fuel demand or compressed-air use after a line has stopped.
The plant team must still establish the cause. Production activity, cleaning, maintenance work, weather conditions and meter performance can each affect the profile. Effective monitoring supports the investigation; it does not replace engineering judgement.
A disciplined response closes the loop
A practical response sequence keeps utility monitoring connected to action:
- Confirm the reading and identify the affected utility, area and period.
- Check production, cleaning and maintenance records for the same interval.
- Assign an engineering or operations owner to investigate.
- Record the action taken and any operating change.
- Compare post-action performance with the relevant baseline.
This approach creates a repeatable process for refrigeration faults, steam losses, water anomalies and compressed-air waste. It also gives management a stronger basis for prioritising maintenance and capital work.
EnerTherm Engineering delivers Omni Vision as a turnkey programme from site survey to dashboard commissioning. The scope can include utility mapping, meter selection, panel construction, installation planning, data integration, dashboard configuration, KPI definition and user handover. For food plants, the value lies in making six utilities visible as measurable process inputs while preserving HACCP requirements and existing process-control integrity.
This article reflects the independent analysis and editorial opinion of EnerTherm Engineering. Product names, trademarks, and brands mentioned belong to their respective owners. EnerTherm Engineering is not affiliated with, endorsed by, or a licensee of any third-party software or product mentioned unless explicitly stated.

Technical Manager — EnerTherm Engineering
John Naranjo is Technical Manager at EnerTherm Engineering, bringing specialist expertise in chemical and environmental engineering. He recently led the implementation of Omni Vision, EnerTherm's real-time energy and utility monitoring platform. He holds an MSc in Environmental Engineering from the University of Huelva and a BSc in Chemical Engineering, with memberships in both the Energy Institute and IChemE.
