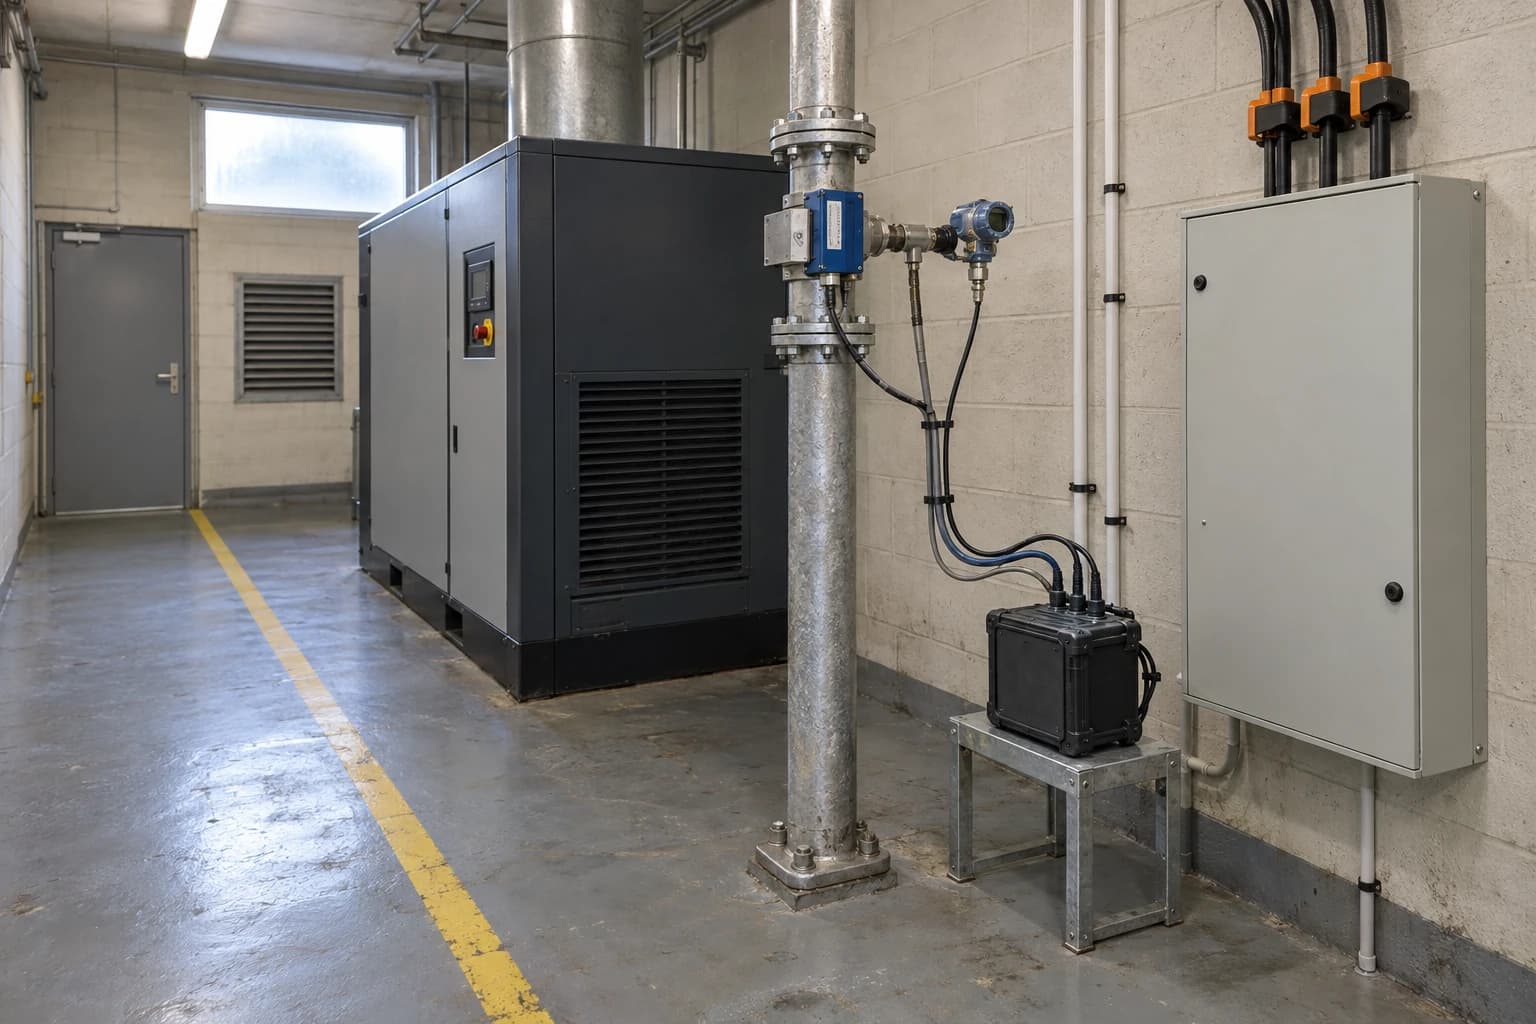
How Compressed Air Monitoring Finds 20-50% System Waste
ISO 11011:2024 sets the framework for measuring compressed air costs and ROI
In a poorly maintained industrial plant, compressed-air leaks can consume 20–50% of total compressor production capacity. That is not a universal figure for every site, nor does it represent all compressed-air waste. It is a serious warning for facilities that rely on estimates rather than measured demand.
Compressed air accounts for around 10% of industrial electricity consumption in the UK, according to the Energy Technology List. The cost sits behind production equipment, packaging lines, pneumatic tools, valves, conveying systems and automation. It often receives less scrutiny than process heating or large electric drives because the compressor house appears to be working normally.
A monthly electricity bill cannot reveal whether air demand supports production, escapes through leaks, compensates for pressure drop, or keeps an unloaded compressor running overnight. Compressed-air monitoring helps plant managers separate those causes.
The strongest compressed-air energy cost-reduction strategies start with a measured baseline. Power, flow, pressure, temperature and production data show how much air the site generates, where it goes, and whether the electricity consumed produces useful work.
Why compressed air energy cost reduction strategies need measured evidence
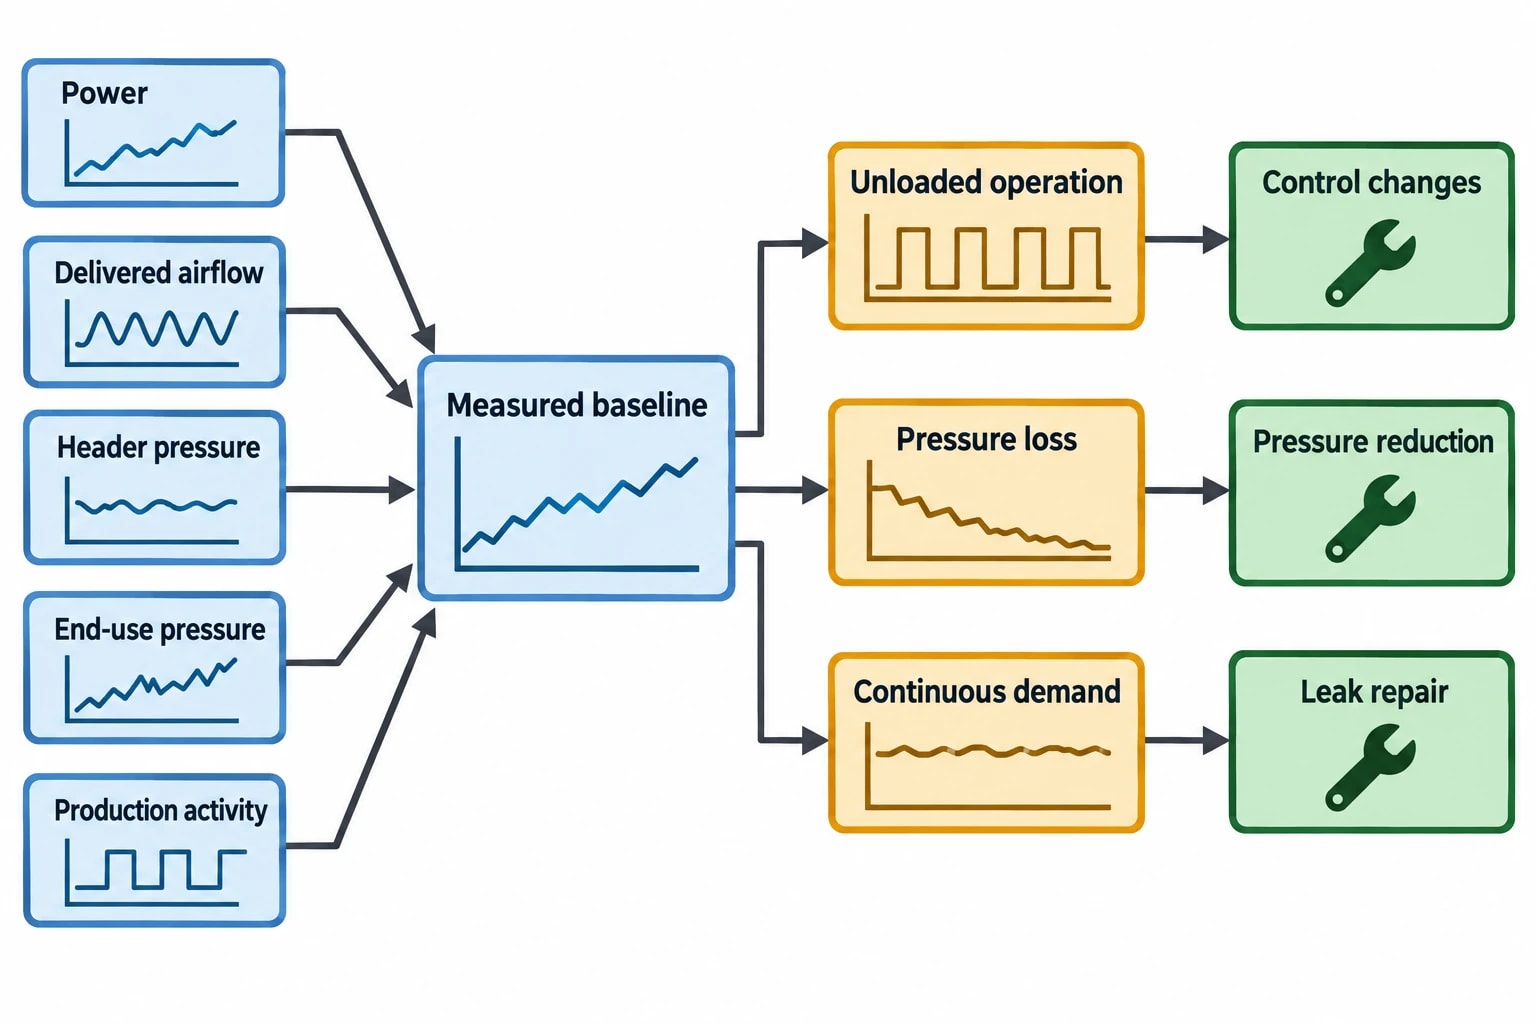
Compressed-air systems can appear stable while wasting substantial electricity. A compressor may maintain header pressure, production equipment may continue running, and no component may show an obvious fault. Meanwhile, the system may operate at excessive pressure, cycle inefficiently between load and unload states, or supply air to unused equipment.
The Energy Technology List identifies recurring causes of poor compressed-air efficiency:
- Air leaks
- Poor compressor control
- Over-pressurisation
- Ad hoc expansion of distribution systems
- Inappropriate uses of compressed air
- Inefficient dryers and ancillary equipment
Each issue leaves a different pattern in monitored data. The corrective action, cost and expected return differ.
A leak programme may require ultrasonic detection, repair work and verification. A pressure problem may need filter maintenance, regulator adjustment or pipework modification. Poor compressor sequencing may require control changes before a plant considers buying another compressor.
Nameplate power does not establish annual cost
A compressor motor rating tells a manager little about the actual annual cost of the air system. A 75 kW compressor that runs unloaded through breaks, weekends and changeovers can consume more energy than a larger compressor that matches output to demand.
Monitoring establishes the relationship between compressor operation and factory activity. It can show:
- Compressor kW against delivered airflow
- Loaded, unloaded and stopped operating periods
- Main header pressure against pressure at critical end uses
- Demand during production, breaks and shutdowns
- Compressor electricity consumption against batches, tonnes or units produced
- Air-treatment energy against air output
This evidence can prevent a costly sequencing error. A plant may assume that it needs a new compressor when leak repair, pressure reduction and improved control could release enough capacity to defer that investment.

Omni Vision delivers turnkey utility metering, CO2 tracking, and AI-powered production KPI intelligence — giving you real-time dashboards and actionable insights across your entire facility.
What compressed air monitoring should measure
ISO 11011:2013 sets out a whole-system approach to compressed-air energy assessment. It covers the supply, transmission and demand sides of the system, from energy input to useful work and wasted air.
A compressor can perform well in isolation while the wider compressed-air system wastes energy through restrictions, leaks or unnecessary end uses.
Meter power, airflow, pressure and temperature
The US Department of Energy compressed-air sourcebook identifies power, pressure, flow and temperature as core measurements for baselining. Production information should sit alongside them to show whether energy use changes with real output.
| Measurement | What it reveals | Typical action |
|---|---|---|
| Electrical power | Compressor energy use, loading and unloaded operation | Review controls, reduce run hours and assess compressor duty |
| Airflow | Total demand, base load and short peaks | Investigate leaks, isolate unused areas and assess storage |
| Pressure | Setpoint stability and distribution losses | Review setpoints, investigate restrictions and regulators |
| Temperature | Compressor and air-treatment operating conditions | Plan maintenance and investigate abnormal operation |
| Production data | kWh per tonne, batch or unit | Compare lines, shifts and product runs fairly |
Power measurement should cover each significant compressor. Major dryers and air-treatment equipment may also warrant metering where their electricity use is material.
Flow metering at the main header establishes total demand. Sub-metering on high-use production areas can identify which lines create persistent non-production demand or sharp peaks. Pressure sensors belong at the compressor discharge, the main header and critical end-use locations. A single pressure reading in the compressor room cannot reveal pressure drop where production depends on air quality and pressure.
Build a baseline that reflects real operating conditions
A short survey can identify visible maintenance issues. It cannot show the annual cost of waste or distinguish a genuine production peak from a permanent demand problem.
A useful baseline captures normal shifts, breaks, product changes, planned shutdowns and high-demand events. It should also record the status of compressors and major users.
The most valuable comparison is often between three demand states:
- Normal production demand.
- Idle demand during breaks, changeovers and shift handovers.
- Non-production demand during nights, weekends or planned shutdowns.
A site does not need identical demand across every hour. It needs enough context to explain why consumption changed.
If production equipment is isolated during a known shutdown and airflow remains high, the plant has a quantifiable base load. If the matching kW trend shows a compressor staying online, the cost can be annualised using measured operating hours and the site’s electricity tariff.
How monitoring identifies compressed-air waste
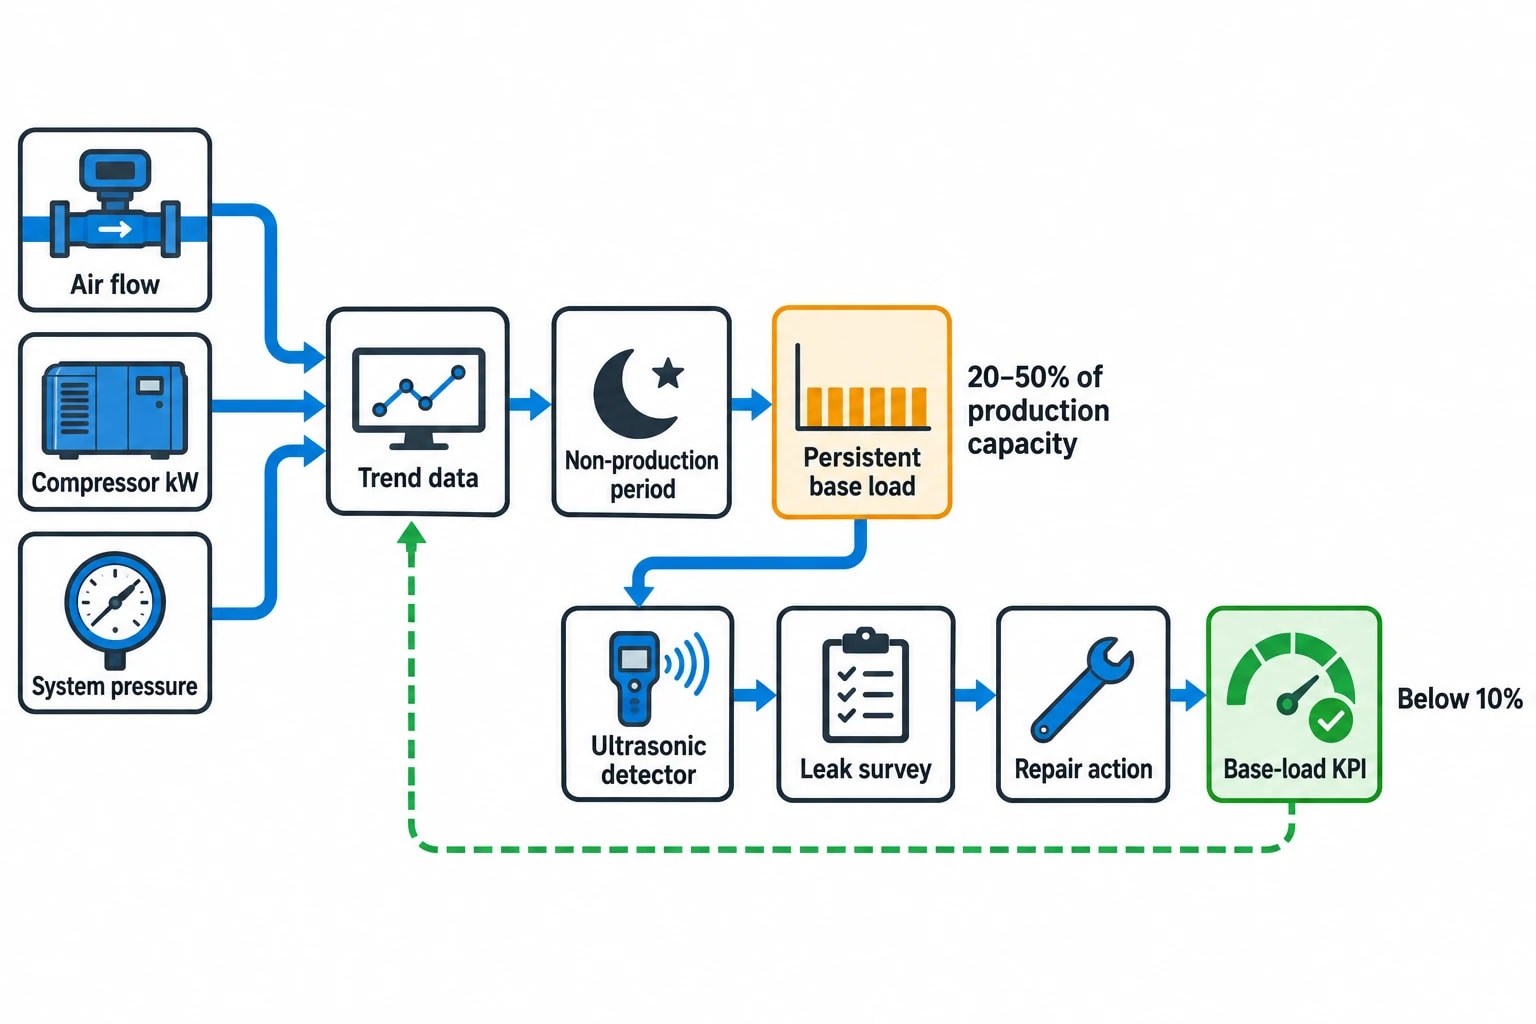
Continuous monitoring does not replace maintenance expertise. It directs maintenance and engineering teams towards actions with the clearest financial case, then verifies whether those actions delivered the expected result.
Persistent base load points to leaks and unnecessary demand
Leak surveys locate individual loss points. Ultrasonic detectors remain effective for finding the high-frequency sound associated with escaping compressed air.
Continuous flow and power trends add a system-level view. A persistent flow during known non-production periods indicates a load that deserves investigation. The same interval may show a compressor loading, unloading or starting repeatedly to satisfy that demand.
Poorly maintained plants can have leak rates of 20–50% of total compressed-air production capacity. A managed leak-reduction programme can reduce that level to below 10%.
The financial significance depends on how leaks affect compressor operation. A modest leak may have little immediate effect where excess compressor capacity is already online. The same leak can become expensive where it causes another compressor to start, forces a variable-speed compressor to run continuously, or prevents a compressor from shutting down overnight.
A permanent base-load KPI gives a leak programme staying power. It shows whether repairs reduced demand and highlights when deterioration returns.
Pressure trends expose over-pressurisation and restrictions
Pressure is a production requirement. The target is the lowest stable pressure that allows the critical end use to operate within specification.
Many plants raise compressor discharge pressure after operators experience low pressure at a distant machine. That response can restore production but increase energy use across the compressed-air system.
Monitoring helps identify the cause. If discharge pressure remains high while pressure falls at a packaging line or process skid, the issue lies in transmission or local demand. Common causes include:
- Fouled, saturated or undersized filters
- Restrictive dryers and treatment equipment
- Undersized pipework
- Partially closed valves
- Poorly selected regulators
- High intermittent demand
- Local leaks and inappropriate compressed-air use
The Carbon Trust has reported that reducing system pressure by 10% can reduce energy use by around 5%, subject to the operating characteristics of the system. That figure should guide investigation, not justify an untested pressure reduction. A monitored, incremental setpoint review protects production while establishing the lowest workable pressure.
Power and flow data reveal control losses
A compressor does not consume electricity in proportion to airflow under all conditions. Fixed-speed compressors can draw substantial power while unloaded. Multiple compressors can also compete across poorly aligned pressure bands.
Metering each compressor’s kW alongside total airflow helps expose:
- Long unloaded run periods
- Compressors operating in inefficient part-load conditions
- Overlapping pressure bands between compressors
- A trim compressor carrying unsuitable demand
- Excessive starts and stops
- Demand reductions not reflected in the control sequence
Operators or building-management systems can implement validated control changes during approved change windows. These may include revised pressure setpoints and lead-lag sequencing. The measured demand profile may instead support a master controller, additional storage or a different compressor arrangement.
Short demand peaks can create avoidable capital projects
High intermittent demand can cause pressure collapse even where average airflow is manageable. A large pneumatic event, purge sequence or batch operation can force a site to operate at an unnecessarily high system pressure or keep another compressor available for a short peak.
Trend data shows the duration, frequency and size of these events. Engineering teams can then assess whether strategically placed air receivers, local storage, revised timing or an end-use change would manage the peak more economically.
Storage should support a measured demand profile. Adding a receiver without understanding the event it is intended to buffer can leave the underlying control problem untouched.

Track energy consumption, emissions, and process parameters with seamless PLC/SCADA integration via Modbus, OPC-UA, and MQTT protocols.
Turning monitoring findings into a cost-benefit case
The financial case for monitoring should start with measured waste rather than a generic saving percentage. The strongest proposals separate immediate operational actions from projects that require capital approval.
Convert trends into an annualised opportunity
For each identified issue, the assessment should document the affected compressor, operating hours, production condition and expected corrective action.
A persistent non-production base load can be translated into an annual energy opportunity using the measured compressor power associated with that period, the number of equivalent hours per year and the applicable electricity cost. The result should remain an estimate until repairs and post-project verification confirm the reduction.
The same approach applies to pressure and control improvements. A reliable business case records the original operating condition, the intended change and the production conditions required for a fair comparison.
| Monitoring finding | Evidence required | Likely response |
|---|---|---|
| High non-production airflow | Flow and kW remain elevated during shutdown | Leak survey, isolation testing and repair work |
| Excess header pressure | Pressure exceeds the critical end-use requirement | Setpoint review, pressure-drop investigation, regulator work |
| Unloaded compressor operation | High kW persists while delivered flow is low | Sequencing and control review |
| Short high-flow peaks | Brief demand event causes pressure decay | Storage assessment, process timing review or local solution |
| Rising kWh per unit | Energy intensity increases without matching output change | Maintenance investigation and end-use review |
Rank actions by cost, risk and verification
The first action should not automatically be the largest theoretical opportunity. Plant teams should consider the cost of the measure, safety requirements, production risk, available maintenance windows and how easily the outcome can be verified.
Leak repair and isolation of unused equipment often provide early results. Pressure reduction may follow once engineers confirm that critical users have sufficient pressure. Control optimisation, storage and equipment upgrades belong later in the sequence when the demand profile supports them.
A monitoring project should assign owners to each action. Dashboards alone do not cut energy costs. Maintenance needs clear repair priorities, operations needs agreed pressure limits, and engineering needs evidence for capital expenditure.
Production-linked KPIs keep savings visible
Total compressor electricity use is useful, but it can mislead in a factory with changing output. A higher monthly kWh figure may be appropriate if production rose materially.
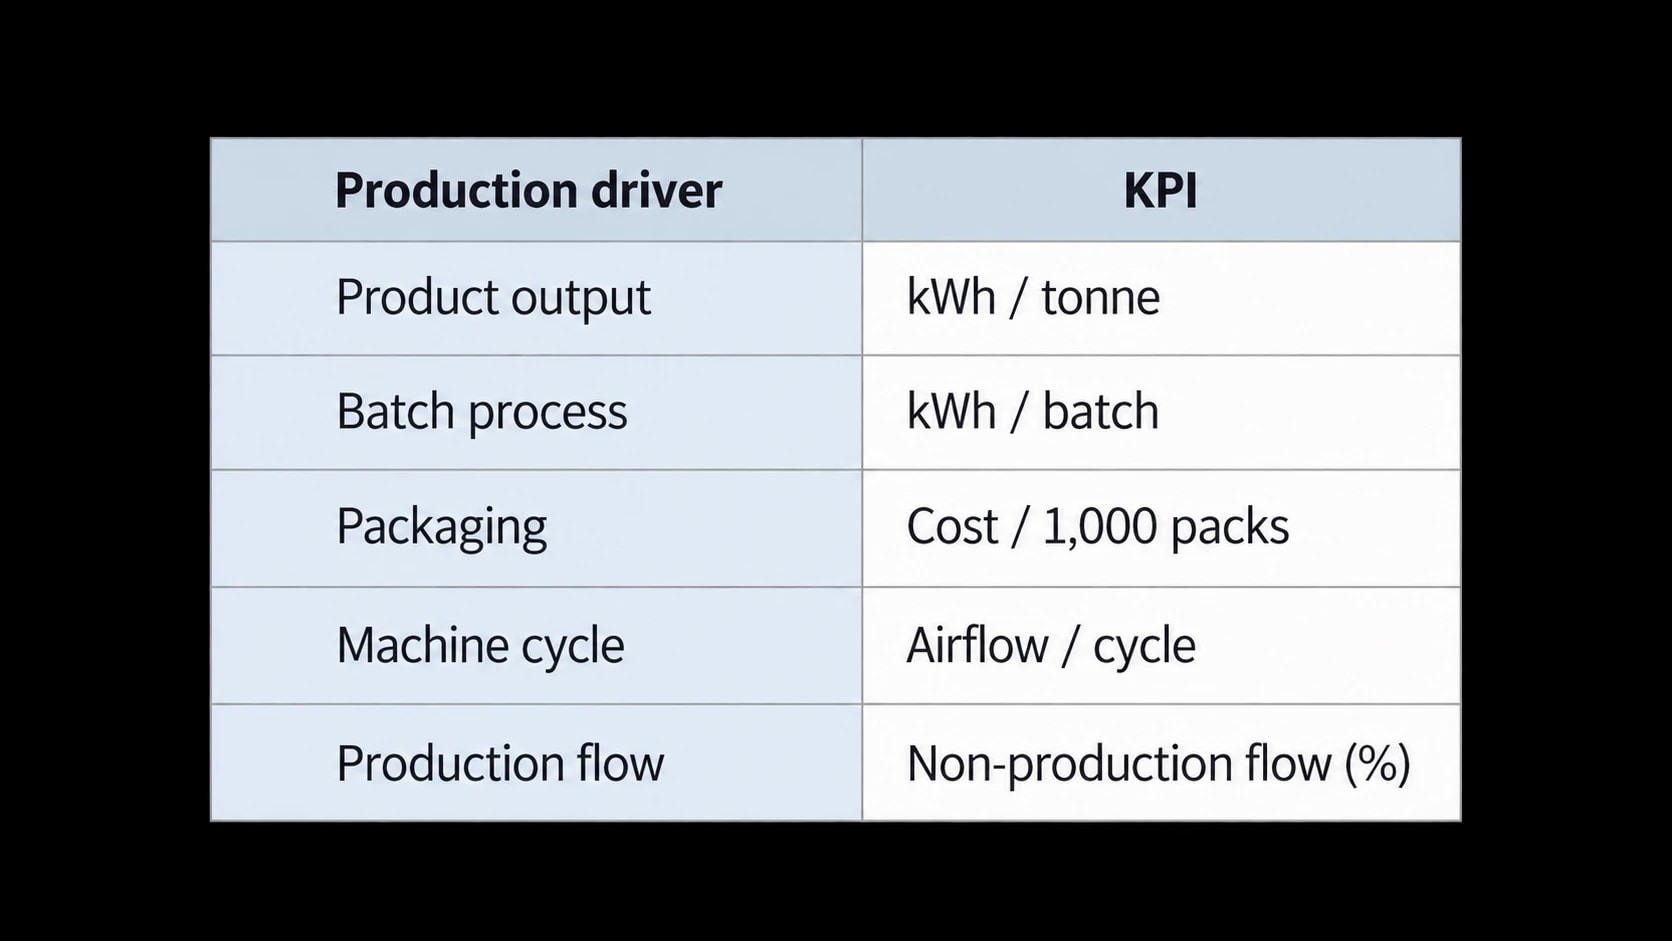
Production-linked KPIs provide a more useful operational measure. Examples include:
- kWh per tonne of product
- kWh per batch
- Cost per thousand packs
- Compressed-air flow per machine cycle
- Non-production airflow as a percentage of average production airflow
The right KPI reflects the activity that drives air demand. A packaging operation may require energy per thousand packs. A batch process may use kWh per batch. A machining facility may need a separate KPI for each component family where tooling and air demand differ.
These measures can identify gradual deterioration before it becomes a major cost. A rising kWh-per-unit trend may indicate pressure creep, new leaks, fouled filters, altered process settings or compressor wear.
ISO 50001:2018 uses energy performance indicators and energy baselines as central tools for energy management. Compressed-air monitoring applies that discipline to a utility often managed through experience and intermittent surveys.
Applying continuous monitoring to compressed-air cost reduction
Continuous monitoring turns a one-off audit into an operational evidence base. It provides a record of base load, pressure stability, compressor performance and energy intensity across changing production conditions.
EnerTherm Engineering’s Omni Vision Energy Intelligence Platform can centralise compressed-air and electricity data with production-linked KPIs such as energy per batch and cost per unit. Analytics supplied by EPSA can flag abnormal demand patterns and support forecasting, helping teams investigate waste before it becomes embedded in normal operation.
Plant managers need a concise view of energy cost, non-production demand and performance against the selected KPI. Energy engineers need the underlying flow, pressure and power trends. Facilities teams need a ranked list of actions and a record of completed repairs.
This article reflects the independent analysis and editorial opinion of EnerTherm Engineering. Product names, trademarks, and brands mentioned belong to their respective owners. EnerTherm Engineering is not affiliated with, endorsed by, or a licensee of any third-party software or product mentioned unless explicitly stated.

Technical Manager — EnerTherm Engineering
John Naranjo is Technical Manager at EnerTherm Engineering, bringing specialist expertise in chemical and environmental engineering. He recently led the implementation of Omni Vision, EnerTherm's real-time energy and utility monitoring platform. He holds an MSc in Environmental Engineering from the University of Huelva and a BSc in Chemical Engineering, with memberships in both the Energy Institute and IChemE.
