
Turnkey Energy Management Solutions: Sub-12-Month Payback
Omni Vision links six utilities to audit-ready data and 15-25% energy savings.
The deadline for eligible UK organisations to submit an ESOS Phase 4 compliance notification is 5 December 2027, and the assessment must draw on verifiable energy data. For factories still reconciling invoices, manual meter readings and production records in spreadsheets, that deadline exposes an operational and financial weakness.
Turnkey energy management solutions combine metering, plant data collection, analytics, KPI configuration and reporting in one managed implementation. Their business case depends on speed and focus. A site must identify avoidable consumption, assign action owners and verify savings quickly enough for the first-year benefit to exceed the installed cost.
EnerTherm Engineering’s Omni Vision Energy Intelligence Platform is designed around that model for general industry. It combines precision instrumentation and read-only PLC data collection with EPSA’s cloud analytics engine, covering electricity, gas, water, steam, compressed air and oil. EnerTherm Engineering reports an 8-to-16-week deployment period, typical energy-cost reductions of 15 to 25%, and payback in under 12 months across more than 150 customer deployments in 25 countries. These are supplier-reported figures, so each site still needs a measured investment case based on its consumption, tariff structure, operating constraints and improvement opportunities.
Why turnkey energy management solutions support faster payback
Integration work must produce decision-ready data
A conventional energy-monitoring project can involve separate suppliers for meters, controls integration, communications, dashboards, cloud storage and reporting. Each handover adds scope decisions, programme risk and internal coordination.
The result can be a partial system that records a site total but cannot explain which line, batch, asset or operating period drove consumption. Data without operational context rarely produces a credible cost reduction.
Turnkey energy management solutions put the practical components under a defined implementation scope. The provider takes responsibility for the metering plan, field installation, data collection, platform configuration and commissioning. The customer still needs to approve access, installation windows, production data and operational ownership. Operations teams retain authority over the process while the delivery programme avoids lengthy internal integration work.
A faster route to usable data also shortens the period in which energy costs remain unmanaged. For a site with a substantial utility bill, even a few months of delay can materially reduce the first-year return.
Monitoring does not create savings by itself
A dashboard cannot reduce a bill unless people act on the information it provides. Savings arise when a site finds a repeatable deviation, changes an operating practice or maintenance routine, and verifies the result against comparable production conditions.
Early opportunities often include:
- Reducing electricity, gas or compressed-air base load outside production hours.
- Finding compressed-air leakage and inappropriate pressure settings.
- Identifying excessive steam demand, poor condensate return or abnormal boiler operation.
- Investigating refrigeration, motors or process equipment running outside expected patterns.
- Allocating utility cost accurately to products, batches, lines or tenants.
- Detecting water leakage or unusually high washdown demand.
- Reducing manual effort spent assembling management and compliance data.
The supplier-reported 15 to 25% saving range should inform a screening exercise, not replace one. A facility with weak utility visibility, significant overnight demand and clear maintenance defects may have several low-disruption actions available. A tightly controlled pharmaceutical process may require a more measured programme that protects validated conditions and quality requirements.
Test the first-year investment threshold
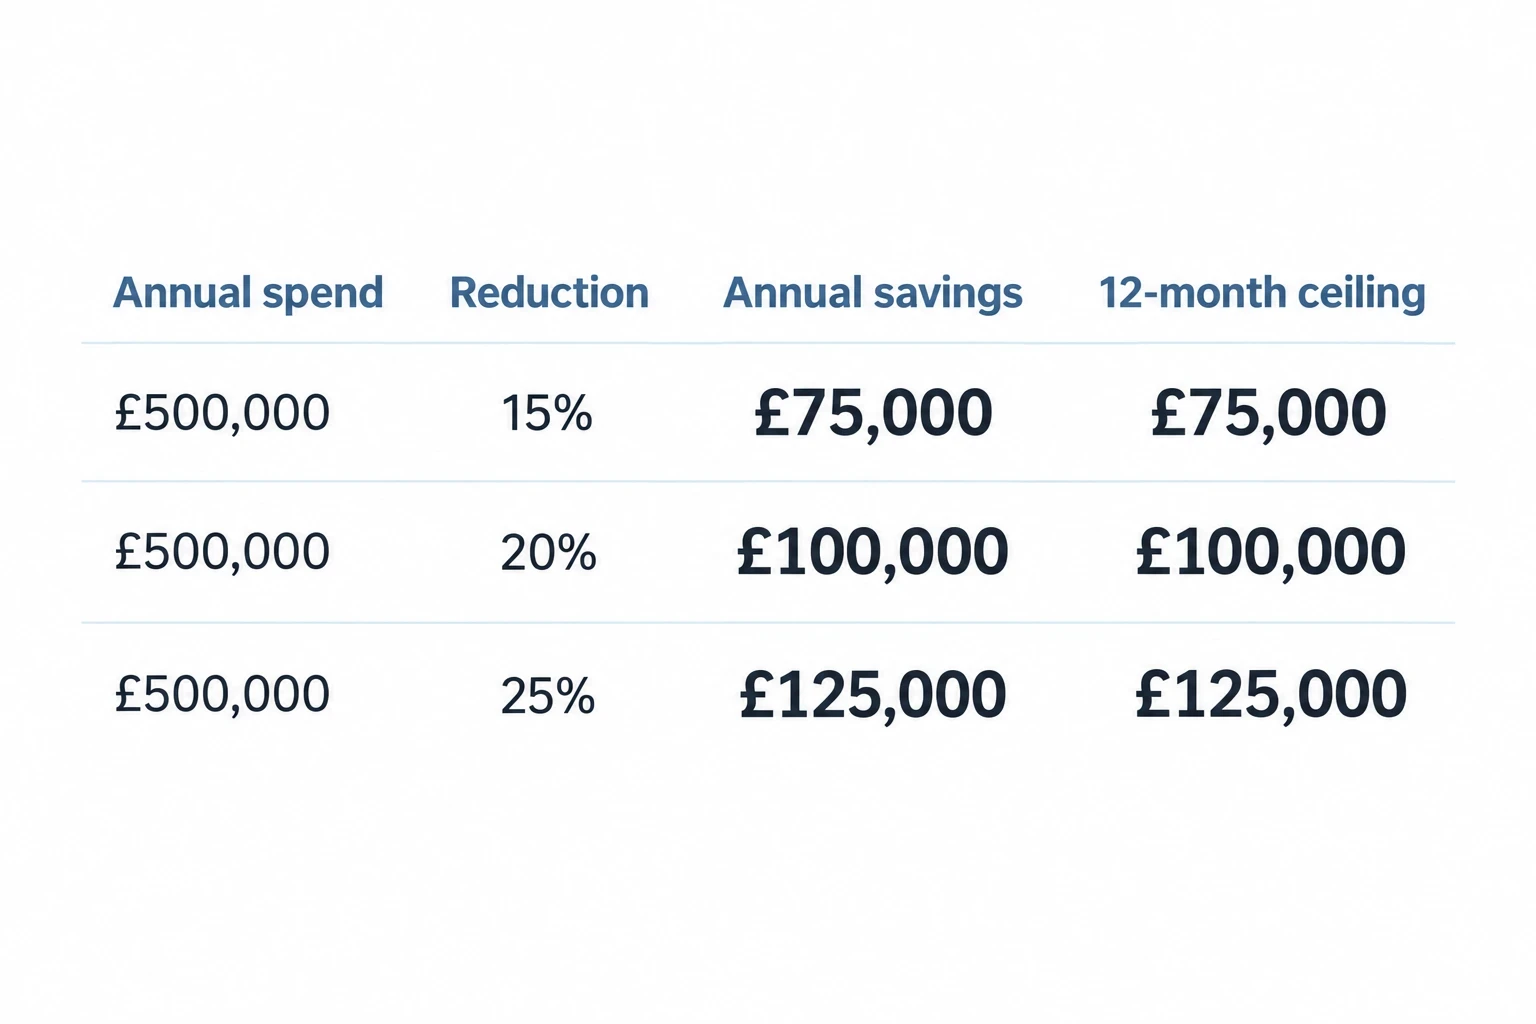
A sub-12-month payback means verified first-year savings meet or exceed the installed project cost. The calculation should include field hardware, installation, software, commissioning, training and the internal time needed to support the work.
| Illustrative annual energy spend | Energy-cost reduction case | Annual savings value | Maximum total investment for 12-month payback |
|---|---|---|---|
| £500,000 | 15% | £75,000 | £75,000 |
| £500,000 | 20% | £100,000 | £100,000 |
| £500,000 | 25% | £125,000 | £125,000 |
This is an illustrative financial screen, not a savings guarantee. Directors should ask which actions can be completed in the first year, which require capital approval and how finance will distinguish a technical improvement from a financially realised saving.

Omni Vision delivers turnkey utility metering, CO2 tracking, and AI-powered production KPI intelligence — giving you real-time dashboards and actionable insights across your entire facility.
ESOS Phase 4 makes traceable energy data more valuable
Compliance requires verifiable consumption evidence
ESOS Phase 4 applies to large UK undertakings and corporate groups that qualify on 31 December 2026. An organisation qualifies where it employs 250 or more people, or has annual turnover above £44 million and an annual balance-sheet total above £38 million.
Participants must calculate total energy consumption and identify significant energy consumption covering at least 95% of that total. They must also calculate energy-intensity ratios for buildings, transport, industrial processes and other energy uses.
For industrial sites, this shifts the conversation beyond annual utility spend. Electricity, fuel and process consumption need enough granularity to support a defensible view of material energy uses. ESOS assessments must, so far as reasonably practicable, use verifiable energy data measured over a 12-month period.
A utility-monitoring platform does not replace the ESOS assessment or lead assessor where one is required. It can, however, provide a more dependable data trail than reconstructed bills, estimated allocations and disconnected production reports.
ESOS now demands evidence of action
Phase 4 reporting includes greater attention to implemented measures and achieved savings. Participants must describe measures implemented during the compliance period, state the energy savings achieved and identify the energy-saving category. The assessment also requires an action-plan review that identifies proposed measures which were not implemented and explains why.
That requirement changes the value of energy intelligence. A site needs more than a list of opportunities. It needs a record showing who investigated an abnormal load, what action they approved, when the work occurred and whether consumption changed under comparable conditions.
An action register linked to monitored data gives energy managers a practical way to maintain this evidence. It also helps avoid a familiar problem: an improvement appears in an engineering report, but finance cannot establish whether it affected utility costs.
ISO 50001:2018 turns measurement into management discipline
A platform supports the energy management system
ISO 50001:2018 specifies requirements with guidance for an energy management system. It supports organisations in establishing an energy policy, objectives, targets and action plans, then monitoring improvement in energy performance.
Technology provides the evidence layer. It does not replace management review, competent staff, operational control or the decisions required to improve a process.
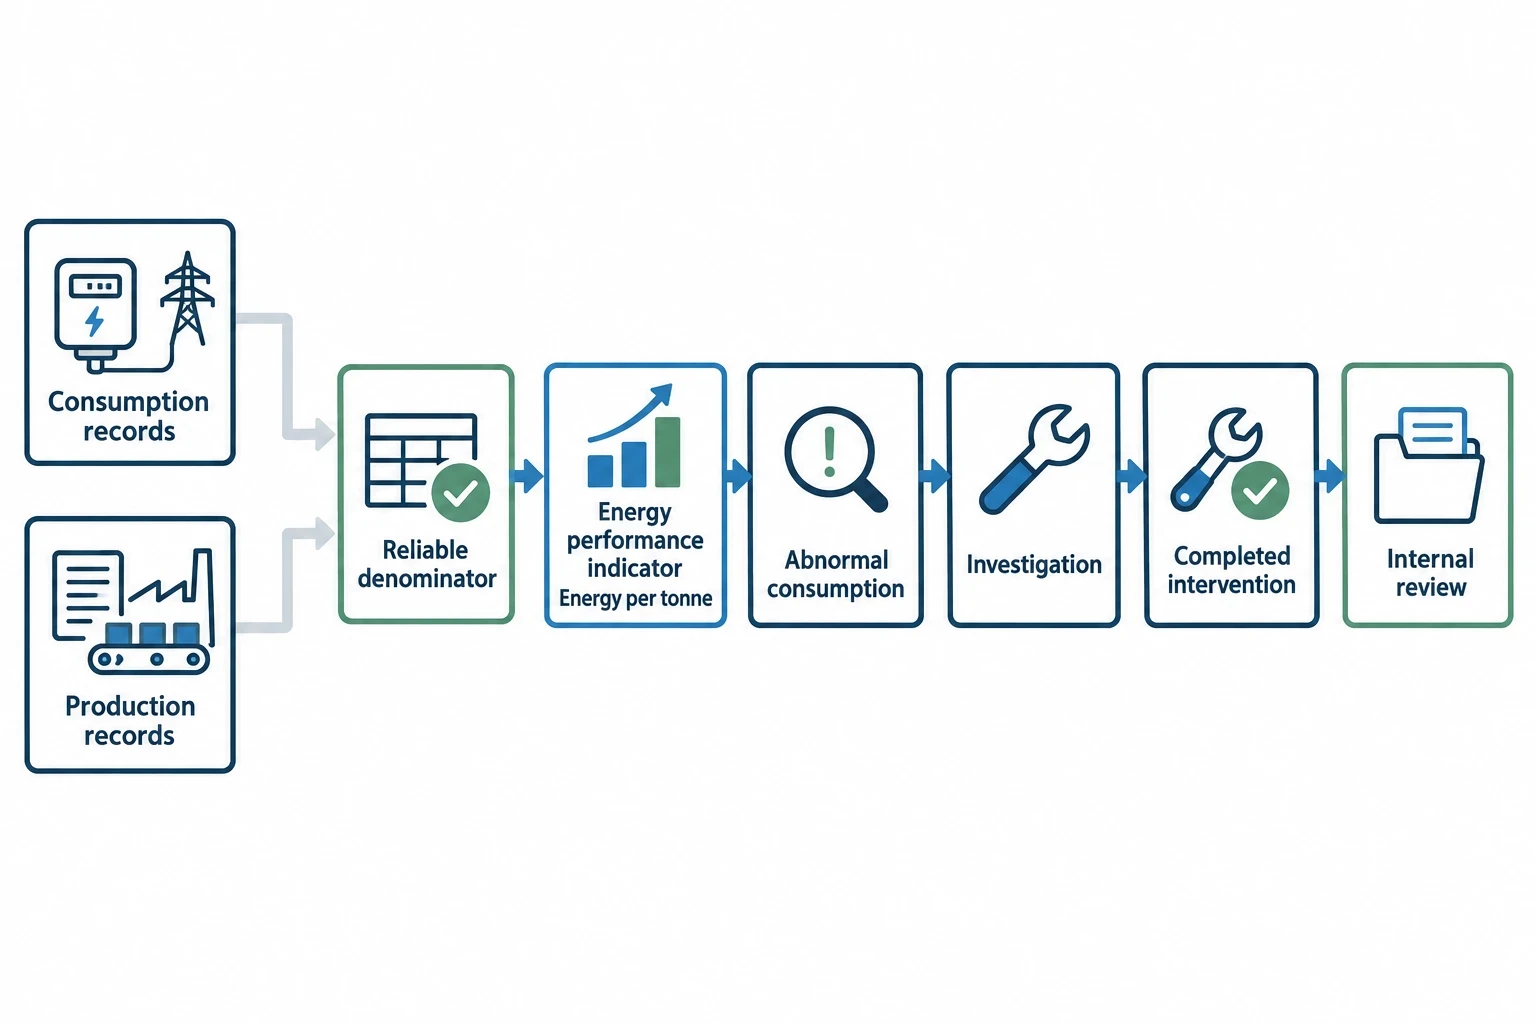
For a manufacturing site, a turnkey platform can support ISO 50001:2018 by providing:
- Consumption records by meter, utility and operating area.
- Energy performance indicators linked to production activity.
- A clearer view of significant energy uses.
- Alerts for abnormal consumption requiring investigation.
- Evidence of completed interventions and their results.
- Consistent records for internal reviews and audit preparation.
The discipline behind the system matters as much as the instrumentation. A multi-site group should standardise meter names, utility categories, reporting periods and KPI definitions. Without this groundwork, comparisons between factories may reflect inconsistent measurement scope rather than genuine performance differences.
Production-linked KPIs make the data useful
A site total can show that consumption increased. It cannot show whether the increase was reasonable for the output produced.
Energy per tonne, cost per unit, energy per batch and consumption per production hour give operations teams a more useful basis for comparison. Food and beverage operations may examine energy per tonne or pallet. Pharmaceutical facilities may track energy per batch while retaining control of validated process conditions. General manufacturers may begin with machine-hour, product-family or cost-per-unit measures.
The production denominator must be reliable. A missing batch count, delayed production record or inconsistent unit of measure can make a valid utility reading misleading. The project should therefore agree the KPI source and ownership before dashboard configuration.

Track energy consumption, emissions, and process parameters with seamless PLC/SCADA integration via Modbus, OPC-UA, and MQTT protocols.
Metering the utility streams that drive production cost
Start with material utility use
The right metering strategy follows materiality. A main electricity incomer gives a valuable site total but cannot explain why one production area uses more energy per tonne than another. Conversely, metering every minor load can consume budget without creating useful decisions.
A practical first scope examines six core utility streams.
| Utility stream | Operational question it can answer |
|---|---|
| Electricity | What drives demand, base load and line energy intensity? |
| Gas | Which boiler, oven, dryer or thermal process drives consumption? |
| Water | Is usage driven by process demand, washdown, leakage or overnight flow? |
| Steam | Where do generation, distribution and process losses occur? |
| Compressed air | Are leakage, pressure settings or compressor hours excessive? |
| Oil | How much fuel supports thermal duty, standby plant or specific production areas? |
The metering plan should target the largest energy uses first, then add resolution where an operational decision depends on it. A new meter earns its place when it reveals a controllable cost or verifies an improvement.
Establish the baseline before claiming savings
A baseline should represent normal operating conditions over a suitable period. Production volume, product mix, operating hours, shutdowns and weather-sensitive loads may all affect the comparison.
Energy managers should agree four points before commissioning:
- The authoritative meter for each utility and area.
- The production data source used for each KPI.
- The conditions that make a direct comparison invalid.
- The person authorised to approve a saving as financially realised.
This avoids arguments after a project has delivered a technical improvement. Operations may observe lower consumption per batch while finance sees no reduction in total expenditure because output, prices or tariff conditions changed.
Read-only PLC data collection protects plant operations
Process context should not interfere with control
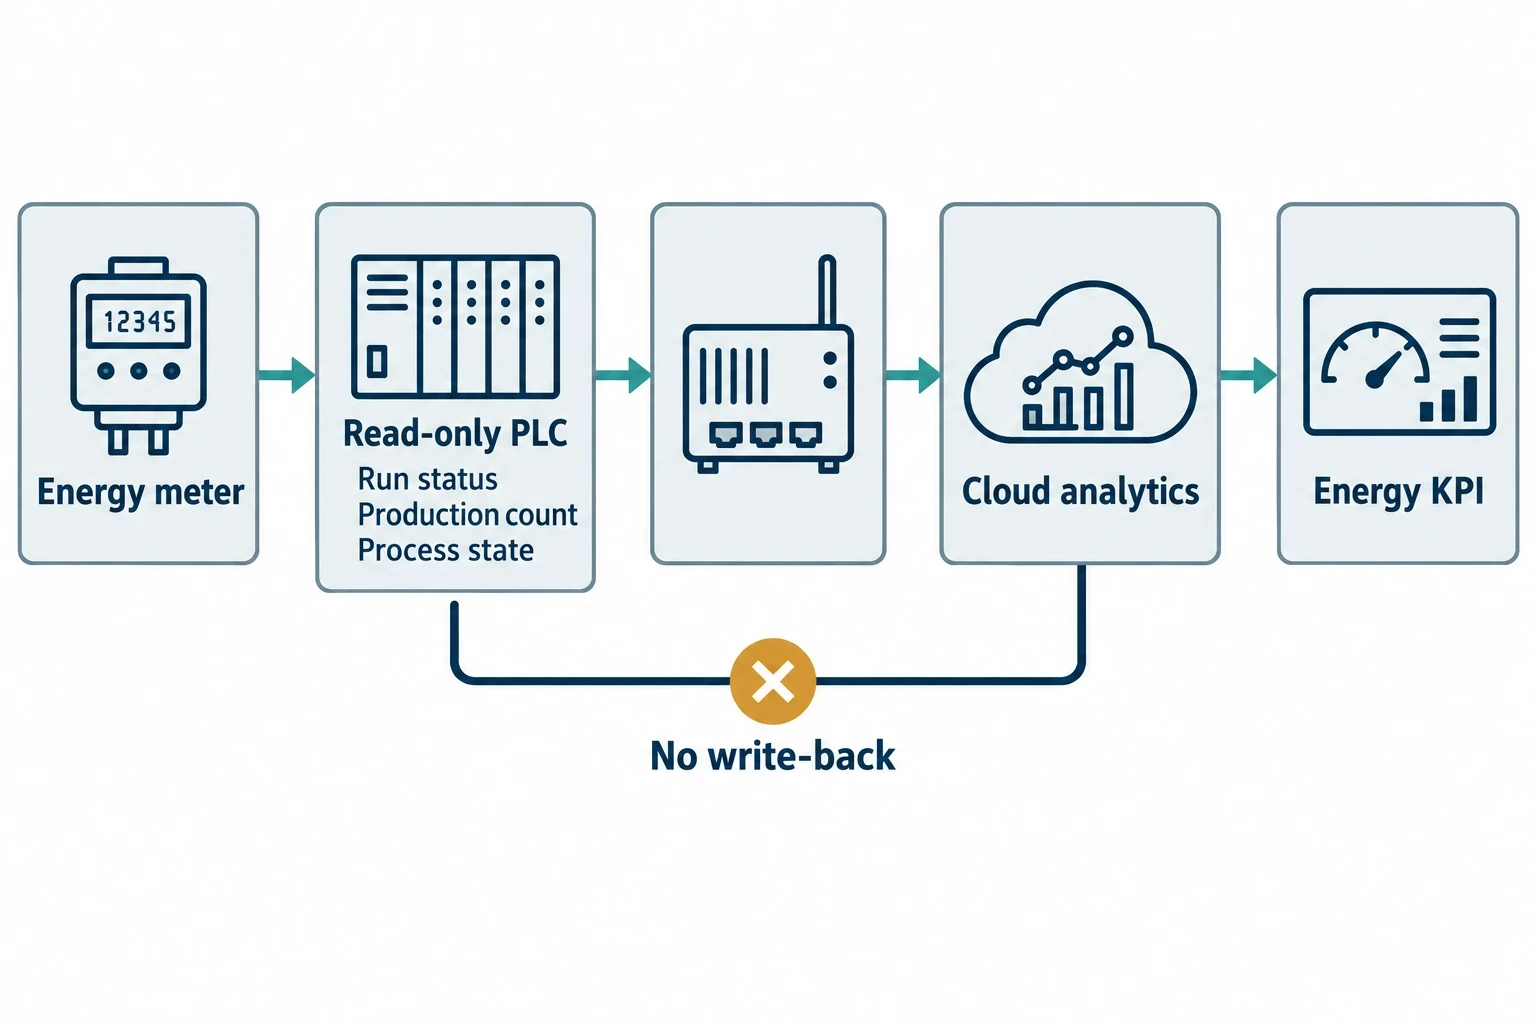
PLCs, building-management systems and supervisory platforms often hold signals that give utility data operational meaning. Run status, production counts, batch information and process-state indicators can explain why consumption changed.
The Omni Vision architecture collects agreed signals on a read-only basis. It extracts data without writing commands back to PLCs or changing plant control. This lets the platform relate utility use to production activity while preserving the site’s established control responsibilities.
The key implementation question is direct: what minimum set of signals will explain consumption and support a useful KPI? Starting with a focused point list reduces delivery effort and keeps the project centred on energy-performance optimisation.
Confirm data quality during commissioning
A platform should not enter financial or compliance reporting until the project team has checked meter accuracy, time alignment, data completeness and scaling factors. Missing intervals, duplicate meter paths and incorrect multipliers can quickly damage confidence.
Commissioning should include a formal acceptance review covering:
- Whether each meter reports the correct utility and location.
- Whether data intervals align with the agreed reporting period.
- Whether production and utility records reconcile sensibly.
- Whether dashboards calculate cost and intensity metrics correctly.
- Whether exception alerts have named operational owners.
These checks turn a technical installation into an operational management tool.
Turning utility visibility into verified savings
Use anomalies to prompt specific action
An abnormal electrical load may result from increased production, an overnight air leak, refrigeration deterioration, a process change or a meter fault. The alert only becomes valuable when it prompts an investigation by someone who can act.
EPSA’s analytics engine supports anomaly detection and forecasting within Omni Vision. Engineering and operations teams must validate the alert against plant conditions, decide on a response and record the outcome.
The best alert programme is selective. Teams should prioritise deviations with a clear owner, realistic response time and measurable cost implication. A large volume of unassigned notifications soon becomes ignored background activity.
Set a weekly operating rhythm
A weekly review keeps energy intelligence connected to plant decisions. The meeting can cover energy intensity, abnormal utility demand, actions completed, actions awaiting approval and savings awaiting verification.
Each action needs a named owner, target date, completion evidence and agreed checking method. This makes the platform part of operational performance management rather than a monthly reporting screen.
A sub-12-month return depends on follow-through: a verified reduction in avoidable consumption, linked to production performance and supported by audit-ready records.
This article reflects the independent analysis and editorial opinion of EnerTherm Engineering. Product names, trademarks, and brands mentioned belong to their respective owners. EnerTherm Engineering is not affiliated with, endorsed by, or a licensee of any third-party software or product mentioned unless explicitly stated.

Managing Director — EnerTherm Engineering
Dr. François Pierrel is Managing Director of EnerTherm Engineering with over two decades of expertise in thermal design, heat transfer, and industrial energy optimisation. He holds a PhD in Heat Transfer from Cranfield University and a Post-Doctorate from Heriot-Watt University.
