Turnkey Energy Solutions for Manufacturing in 8-16 Weeks
Non-invasive PLC integration supports ISO 50001, ESOS and Scope 1 and 2 reporting.
A turnkey energy solution for manufacturing is an installed and commissioned system that measures site utilities, connects them to production activity, and gives operations teams usable energy-performance information without assembling separate metering, integration and analytics packages.
A factory can consume substantial energy before the monthly invoice reveals anything useful. An air compressor can run unloaded through a weekend. Steam demand can stay high after production has slowed. A line can add peak electrical demand during start-up, yet the bill only reports the site total.
Manufacturers need a faster view. Utility intelligence shows where energy enters the facility, where it is used and how consumption changes with batches, shifts, machine state and output. EnerTherm Engineering’s Omni Vision Energy Intelligence Platform brings instrumentation, installation, data configuration and EPSA cloud analytics together in a standardised 8-16 week deployment framework.
Why Manual Energy Tracking Falls Short in Manufacturing
Monthly invoices establish cost, but provide limited operational evidence. They cannot distinguish increased output from inefficient operation. They cannot show whether a rise in electricity use came from a production change, extended idle running, unnecessary base load or a fault.
Spreadsheets introduce further gaps. Teams may take readings at different times, use inconsistent units or receive production figures after preparing an energy report. By then, the event has passed and the evidence has weakened.
Total Consumption Is Not an Energy Performance Indicator
Total site kWh remains necessary for budgeting and supplier reconciliation. It does not measure process efficiency on its own.
A production-linked indicator compares utility consumption against the activity that created demand. It helps a plant team separate output growth from worsening energy intensity. The appropriate measure depends on the process:
- Food and beverage facilities may monitor kWh per tonne packed, steam per cooking batch and water per cleaning cycle.
- Plastics manufacturers may compare electrical demand with machine hours, product weight and reject rate.
- Pharmaceutical operations may assess utility use by suite, campaign, clean-down period and production batch.
- General manufacturers may monitor cost per unit, energy per production run and compressed-air use outside production hours.
The Department for Energy Security and Net Zero defines industrial energy efficiency as reducing delivered energy consumed per unit of industrial output. That distinction matters. A site can lower total consumption during reduced output while its energy performance per unit deteriorates.
Better Time Resolution Changes the Investigation
A single monthly reading can conceal a large overnight load or persistent weekend energy draw. It can miss a compressed-air leak, a steam isolation issue or refrigeration equipment operating beyond the required schedule.
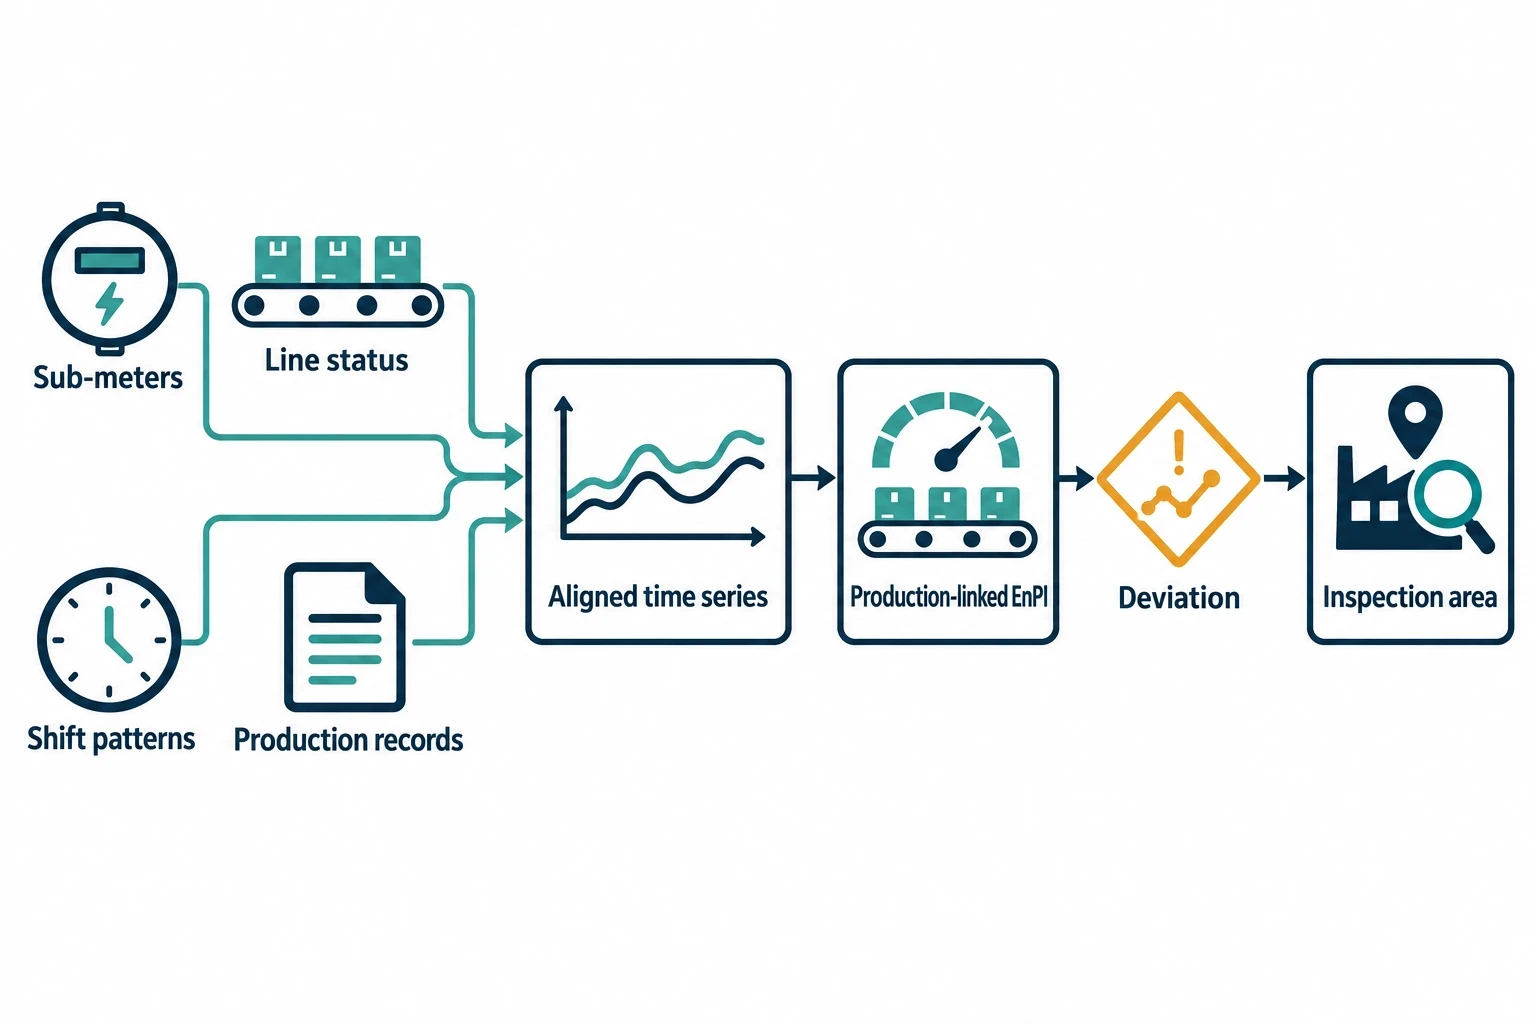
Sub-metering gives engineers a time series that can be compared with line status, shift patterns and production records. Instead of beginning with a theory, the team can identify when the deviation began, which utility changed and which area requires inspection.
This does not remove the need for experienced engineering judgement. It improves where that judgement starts.

Omni Vision delivers turnkey utility metering, CO2 tracking, and AI-powered production KPI intelligence — giving you real-time dashboards and actionable insights across your entire facility.
What Turnkey Energy Solutions for Manufacturing Measure
A practical deployment starts with the site’s significant energy uses, not a fixed number of devices. The initial scope may include the electricity incomer, compressor house, boiler plant and highest-consuming lines. The site can extend measurement once early data identifies the next priority.
| Utility stream | Typical measurements | Manufacturing question |
|---|---|---|
| Electricity | kWh, kW demand, current, voltage, power factor | Which lines or assets drive demand and energy intensity? |
| Gas | Consumption at site, boiler or process level | How much fuel supports steam generation, ovens or direct-fired equipment? |
| Water | Incoming supply, process zones, high-use areas | Where does demand rise outside planned production or cleaning? |
| Steam | Flow, pressure, temperature, condensate context | Is steam consumption aligned with process demand? |
| Compressed air | Flow, pressure, compressor electricity use | Is demand caused by production, leakage or ineffective control? |
| Oil | Storage level, transfers, consumption | How does liquid-fuel use change by operating period or plant area? |
Metering Must Fit the Process
The measurement chain determines the quality of later analysis. A dashboard cannot correct a poorly selected meter, an unlabelled electrical circuit or an incomplete utility balance.
Electrical monitoring may require whole-site meters, feeder meters and line-level sub-meters. Steam projects may require measurement at the boiler plant and selected process branches. Compressed-air monitoring should consider both air flow and compressor electricity use. Electrical demand alone cannot show whether the compressor is meeting productive air demand or consuming power while unloaded.
The survey should also identify practical constraints:
- Access to electrical panels and utility pipework.
- Available space for meters, sensors and gateways.
- Required isolations and production windows.
- Pressure, temperature and hygiene requirements for mechanical work.
- Existing instruments and usable operational data.
- Areas with restricted access or formal permit requirements.
These details shape the installation plan. They also determine whether work can proceed during normal operations or needs a controlled outage.
A Metering Architecture Needs Useful Names
Data becomes difficult to use when measurement points are labelled only by device number. A naming convention should identify the utility, location, asset and purpose. A plant team should be able to distinguish a boiler gas meter from a process oven meter without checking an installation drawing.
Clear asset names also support handover. Maintenance personnel need to know what a signal represents before investigating an exception. Production managers need to recognise the line or area behind a KPI. This basic project discipline often determines whether a platform is used daily or opened only before an energy meeting.
Designing the Deployment Before Installation
The 8-16 week programme is a delivery framework, not a promise that every factory can be upgraded without disruption. A compact site with accessible panels, known utility routes and existing production data may move quickly. A multi-building facility, complex steam distribution network or tightly controlled production environment needs more planning and formal approval stages.
A turnkey approach resolves measurement, installation and data questions as one project rather than leaving the plant to coordinate separate contractors.
Weeks 1-3: Survey, Scope and Measurement Design
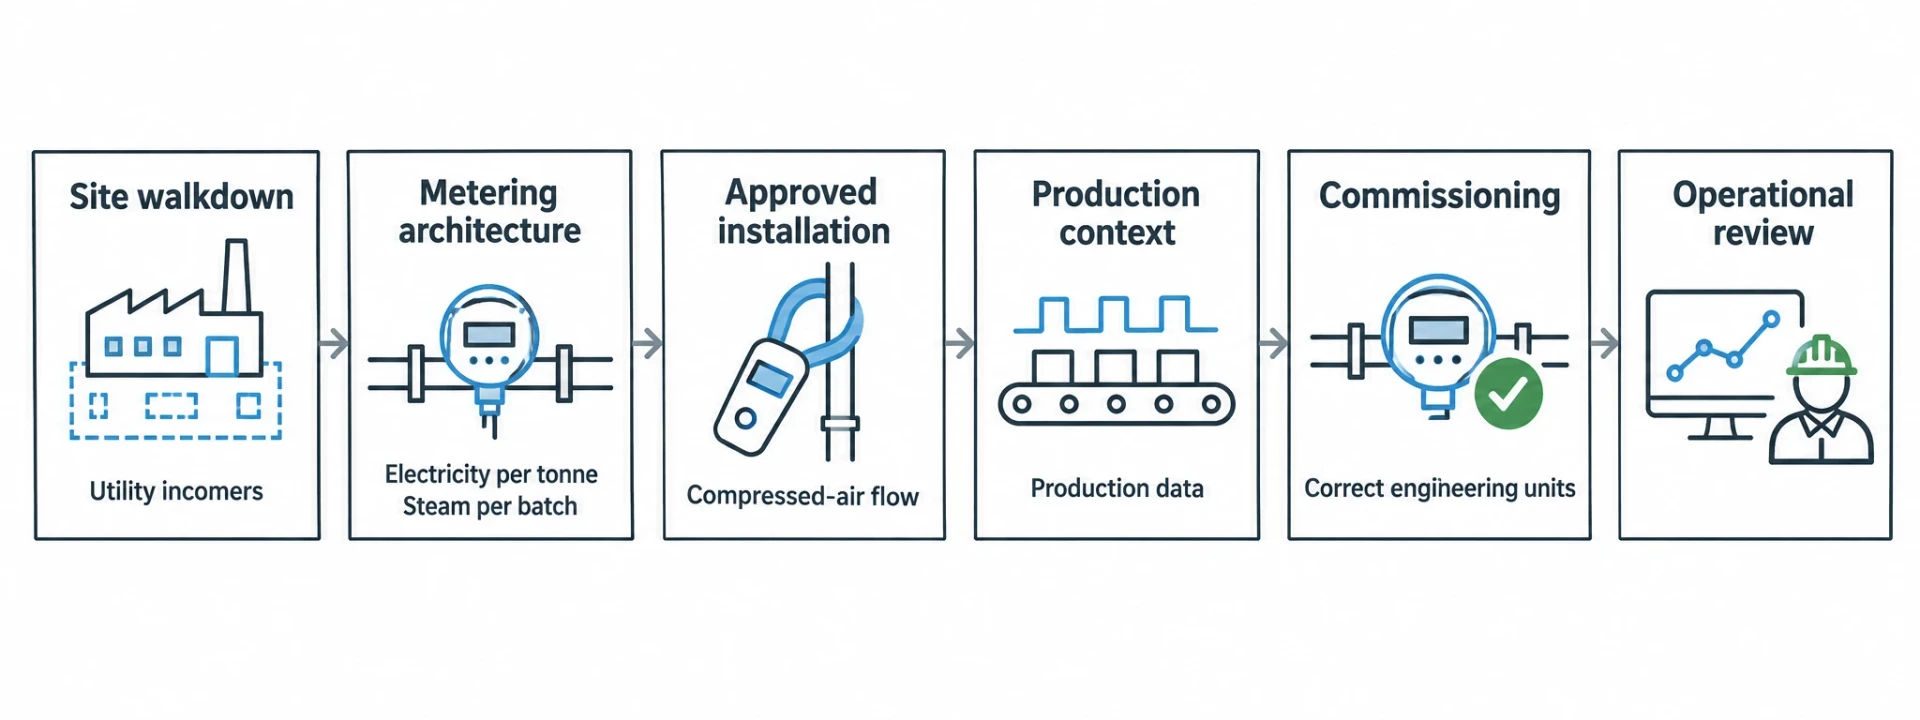
Engineers begin with a site walkdown and data review to identify utility incomers, distribution boards, boiler and compressor systems, major consumers, existing measurement points and available production context.
The design output should include:
- A metering architecture linked to significant energy uses.
- A schedule of measurement points, engineering units and recording intervals.
- The production data required for selected performance indicators.
- Installation methods and planned isolation periods where relevant.
- A data naming convention that mirrors the factory’s asset structure.
This stage prevents an expensive but common outcome: collecting large quantities of data that no one can relate to plant operations.
Weeks 4-8: Instrumentation and Data Collection
Installation teams fit approved meters, sensors and associated communications equipment. Electrical work follows the site’s procedures for live systems, isolation and permit control. Mechanical work must account for pressure, temperature, product protection and access.
The platform can collect existing operating data to provide context for utility measurements. Relevant signals may include line-running state, product count, batch identifier, recipe phase or machine status. Their purpose is to establish whether a change in utility consumption corresponds with production activity.
A measured rise in electricity use may be reasonable if output increased. The same rise during an idle period requires investigation. Production context converts a utility trace into an operational question.
Weeks 9-12: Validation and KPI Configuration
Commissioning confirms that each point is reading correctly, uses the right engineering unit and belongs to the intended asset or utility stream. Teams should compare readings against known meter values, operating conditions and production records before using dashboards for management decisions.
This is the stage for configuring indicators that operational teams can act on, such as:
- Electricity per tonne produced.
- Steam per batch.
- Compressed-air flow during non-production hours.
- Gas consumption per operating hour.
- Cost per unit by line or product family.
- Electrical base load during shutdown periods.
Tariff information can add cost context. Production data can establish intensity measures. Both depend on correct, consistently time-stamped meter data.
Weeks 13-16: Commissioning, Handover and Review Routines
The final phase moves the system from project delivery into normal management practice. An energy platform needs defined owners for alarms, reports and improvement actions.
A maintenance engineer may own compressed-air exceptions. A utilities manager may review boiler and steam performance. Production leaders may use energy-per-unit trends in line meetings. Senior management may review cost and consumption trends at site level.
The handover should cover alarm thresholds, dashboard interpretation, data-quality checks and a review calendar. Accurate metering without this operating routine becomes an unattended screen.

Track energy consumption, emissions, and process parameters with seamless PLC/SCADA integration via Modbus, OPC-UA, and MQTT protocols.
Turning Utility Data Into Manufacturing KPIs
The strongest application of turnkey energy solutions for manufacturing is the connection between a utility stream and a production decision. Each KPI should answer a question that someone on site can investigate.
Choose Indicators That Match Physical Reality
A useful KPI has a clear boundary, a defined unit and a relevant production denominator. “Energy per tonne” may be suitable for a continuous process with consistent products. It may mislead where product mix changes materially. A batch process may need energy per batch, per recipe or per operating hour instead.
The site should also account for relevant variables. Ambient conditions can affect refrigeration and compressed-air performance. Product specifications can change oven duty. Cleaning programmes can drive water and steam use. These factors do not invalidate the KPI; they define how it should be interpreted.
| KPI level | Example | Primary use |
|---|---|---|
| Site | Total kWh per month | Budgeting and overall trend review |
| Utility plant | Compressor kWh per m³ of air | Compressor control and leakage investigation |
| Process area | Steam per cooking batch | Process performance and operational control |
| Production line | kWh per tonne packed | Shift and line performance review |
| Asset | Idle electrical load | Start-up, shutdown and maintenance actions |
Baselines Need an Operating Context
A baseline is a reference period, not a permanent target. It should represent a defined operating condition and include enough information for the site to interpret later variance.
For a line-level electricity baseline, that may mean recording product type, output, shift pattern and planned downtime. For compressed air, it may mean separating production and non-production periods. For steam, it may mean recording boiler operating conditions and batch activity.
A plant team can then assess whether energy intensity changed after a maintenance intervention, process adjustment or operating schedule change. The analysis remains grounded in the facility’s operating conditions.
ISO 50001:2018 and Continuous Energy Improvement
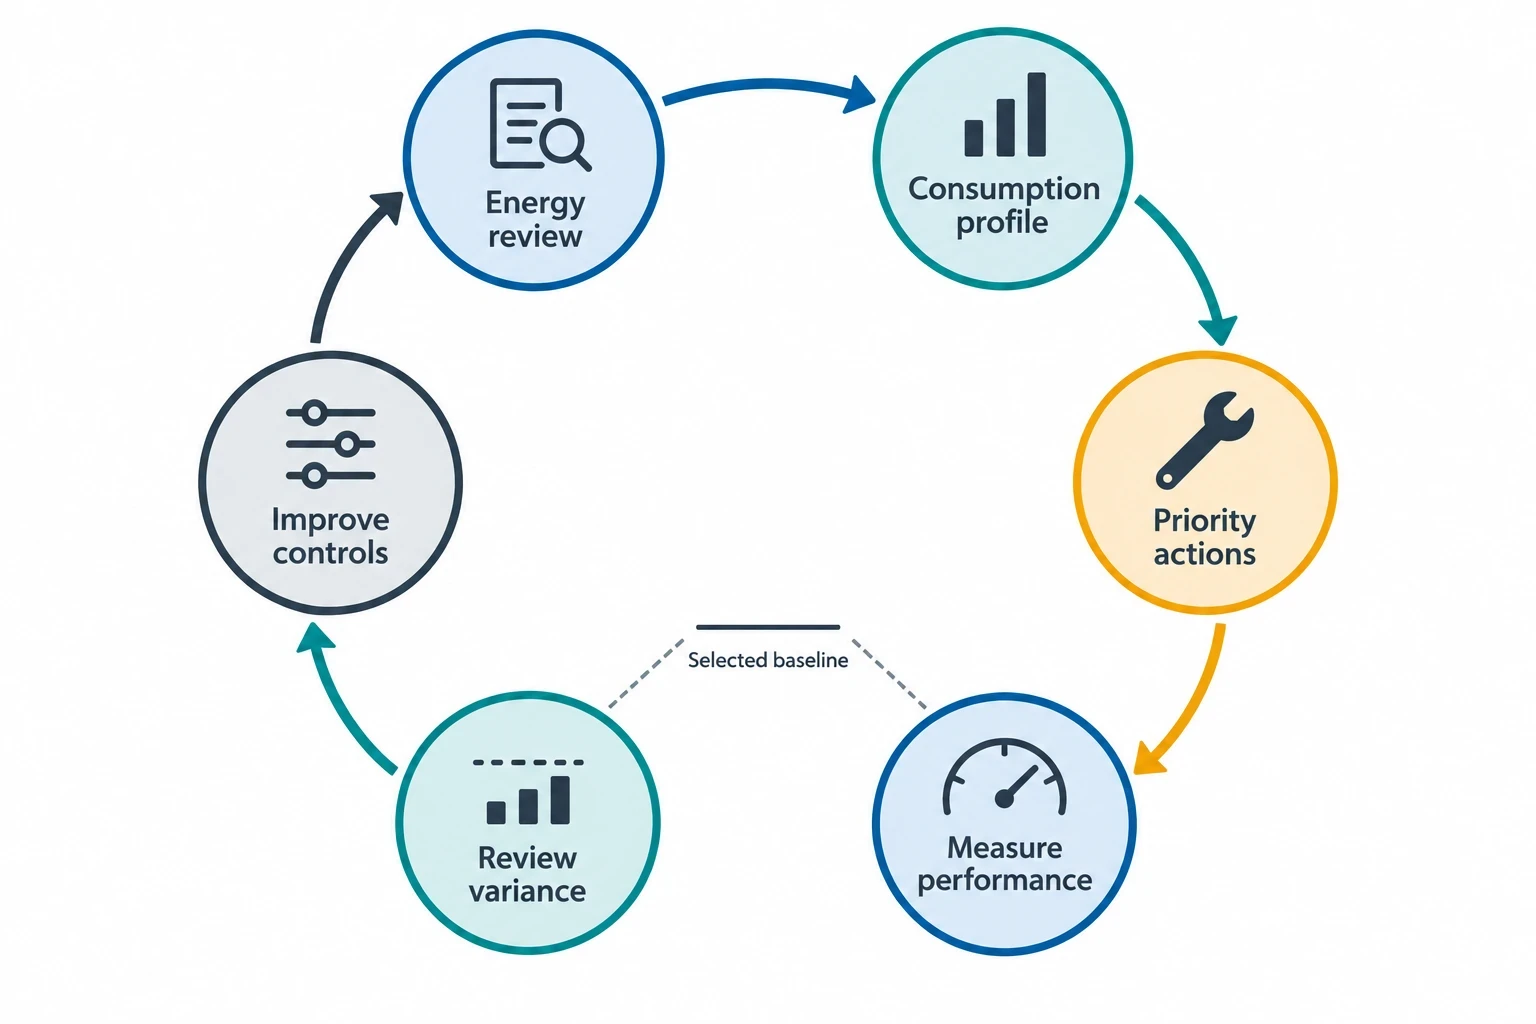
ISO 50001:2018 provides a recognised framework for an energy management system. It supports planning, implementation, performance evaluation and improvement. The standard is technology-neutral. It does not prescribe a particular meter, dashboard or analytics system.
Utility intelligence supports that management process by providing timely, traceable evidence.
Identify Significant Energy Uses
A site energy review needs to establish where energy is consumed and which systems deserve closer management. Metered data can reveal the relative importance of boiler plant, compressed air, refrigeration, process heating, ovens or specific production lines.
The result should be a practical priority list. A small but persistent out-of-hours compressed-air load may deserve attention because it is easy to verify and reduce. A large steam demand may require a broader investigation into boiler operation, condensate return and process use.
Apply Operational Controls
Once a site understands its consumption profile, teams can implement controls matched to the process. These may include start-up schedules, shutdown checks, compressor pressure settings, steam isolation procedures, idle-mode rules or targeted maintenance inspections.
The platform provides feedback on whether an action changed performance. It can show whether base load reduced after a shutdown procedure or whether compressed-air demand changed after repair work. This gives maintenance and operations teams evidence for further decisions.
Review Variance and Sustain Improvements
The improvement cycle depends on regular review. Teams compare current performance with the selected baseline, investigate material variances and record actions. The same routine detects drift after an initial saving has been achieved.
ISO 50001:2018 makes energy performance a managed activity rather than an occasional audit exercise. A turnkey platform provides measurement evidence, while plant leadership supplies objectives, accountability and operational decisions.
Where Early Manufacturing Actions Usually Emerge
The first opportunities often sit in operational losses rather than large capital projects. They can be identified quickly once the site has validated utility data and a clear comparison with production activity.
Common investigation priorities include:
- Electrical base load during shutdowns and non-production periods.
- Compressed-air flow that remains high when lines are stopped.
- Boiler or steam demand that does not follow the production schedule.
- Excessive warm-up time before the first production shift.
- Demand peaks associated with simultaneous equipment start-up.
- Water consumption outside planned cleaning or process activity.
- Material changes in energy per batch, tonne or operating hour.
EPSA’s cloud analytics can support anomaly detection, forecasting and production-linked KPI analysis after the platform receives validated utility and operational data. An alert identifying sustained compressed-air use during a known non-production period gives maintenance a defined place to start.
The site should finish with validated measurements, production-linked indicators, named owners and a ranked list of actions for engineering and operations teams.
This article reflects the independent analysis and editorial opinion of EnerTherm Engineering. Product names, trademarks, and brands mentioned belong to their respective owners. EnerTherm Engineering is not affiliated with, endorsed by, or a licensee of any third-party software or product mentioned unless explicitly stated.

Technical Manager — EnerTherm Engineering
John Naranjo is Technical Manager at EnerTherm Engineering, bringing specialist expertise in chemical and environmental engineering. He recently led the implementation of Omni Vision, EnerTherm's real-time energy and utility monitoring platform. He holds an MSc in Environmental Engineering from the University of Huelva and a BSc in Chemical Engineering, with memberships in both the Energy Institute and IChemE.
