How ISO 11011 Quantifies Compressed Air Leakage
Compressed air systems can use 10-30% of industrial electricity, making leaks costly.
Compressed air leakage quantification converts unintended air loss into measured flow, electricity consumption and operating cost. Compressed air accounts for around 10% of UK industrial electricity consumption, according to the Carbon Trust, while unmanaged systems can lose 20% to 50% of generated air through leaks.
A leaking quick-release coupling or hose fitting rarely appears as a separate line item on an energy bill. The bill records compressor electricity. Maintenance teams need evidence linking an audible or ultrasonic leak to annual air volume, compressor runtime and a financial loss that justifies repair.
ISO 11011 provides a disciplined framework for this task. It treats compressed air as an energy system, covering electricity input, compressor output, distribution pipework, productive use and waste. The standard helps assessors distinguish between a repair requirement and a quantified energy-saving opportunity.
The current ISO publication is ISO 11011:2013, Compressed air — Energy efficiency — Assessment. ISO confirmed this edition in 2020 and has begun work on a revision. References to ISO 11011:2022 should be checked carefully, because the ISO catalogue does not list a 2022 technical edition.
Why compressed air leakage quantification matters
Compressed air is convenient, controllable and widely used in manufacturing. It is also expensive to produce. Electricity powers the compressor, treatment equipment and, in some installations, cooling and condensate equipment before air reaches the point of use.
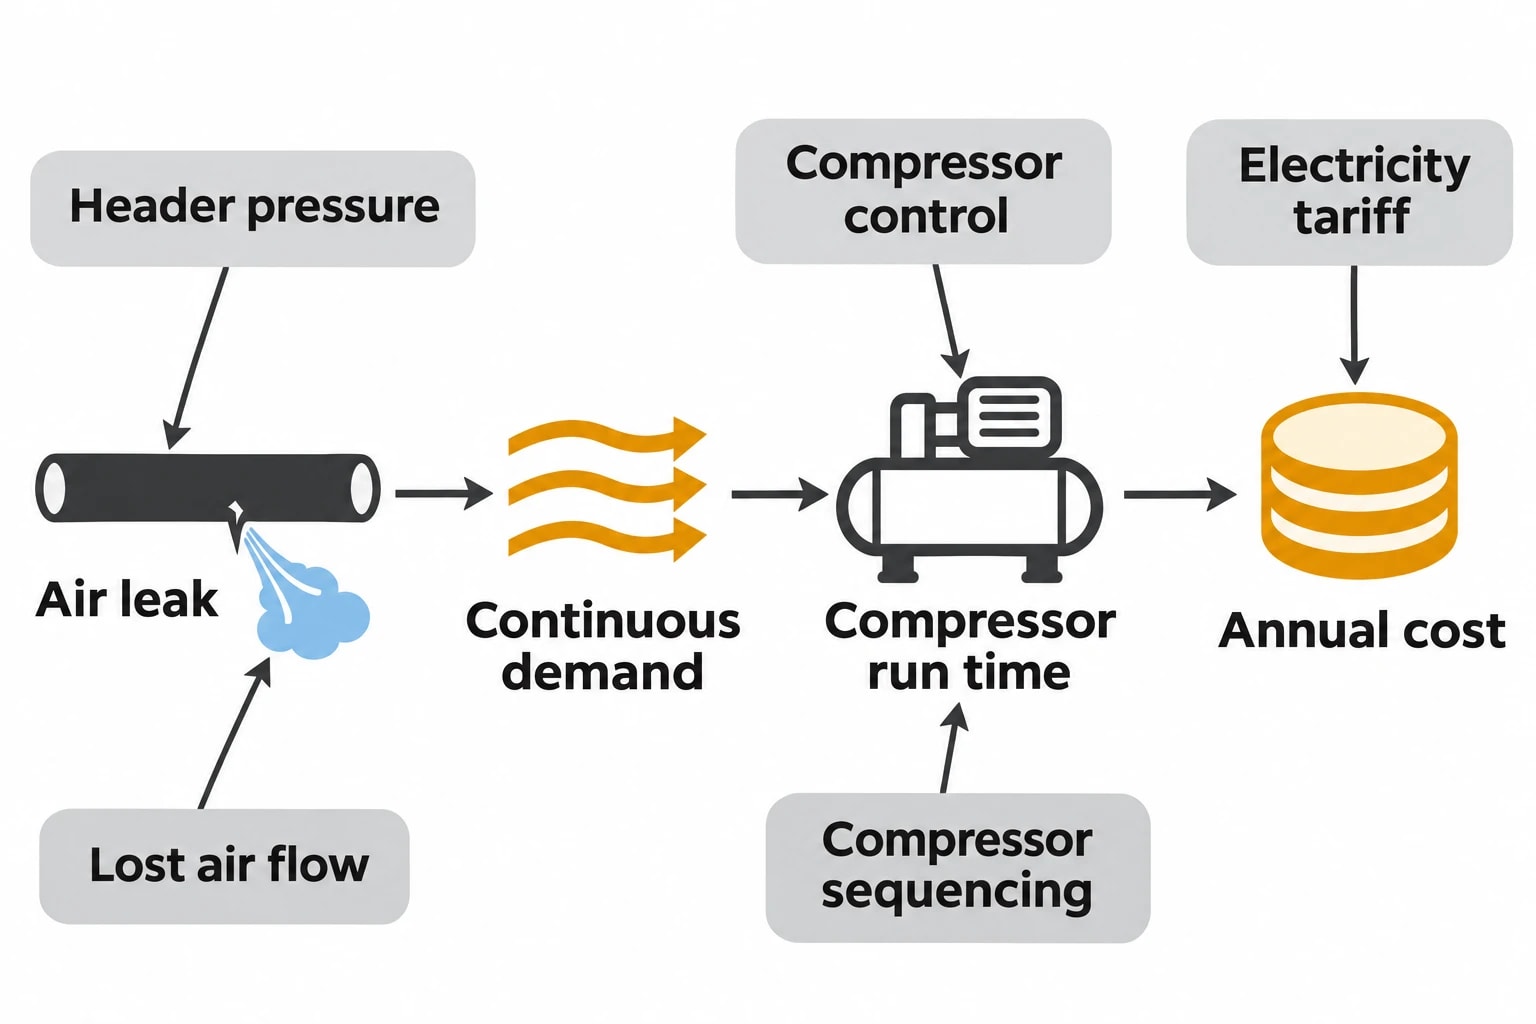
Leaks impose continuous demand. A small fault can persist through production shifts, weekends and planned shutdowns. It may increase loaded running time, require a trim compressor to run, reduce pressure at the point of use and consume reserve capacity.
The financial impact depends on operating conditions, not solely on leak size. A 24-hour leak on a high-pressure header can cost more than several larger faults on isolated pipework that is rarely live.
Key variables include:
- Header pressure and pressure setpoint
- Air flow lost through the fault
- Annual hours during which the affected zone remains pressurised
- Compressor control type and part-load performance
- Electricity tariff structure
- Compressor sequencing and standby capacity
- Residual demand during non-production periods
The Carbon Trust reports that industrial leakage rates can reach 30%, while its wider factory guidance states that 20% to 50% leakage is not uncommon. These figures prompt investigation, but do not provide a site-specific saving. A facility needs its own measured baseline.
Omni Vision delivers turnkey utility metering, CO2 tracking, and AI-powered production KPI intelligence — giving you real-time dashboards and actionable insights across your entire facility.
What ISO 11011 means for compressed air leakage assessment
Assess the system from supply to demand
ISO 11011 divides a compressed air system into three functional subsystems:
- Supply, where primary energy becomes compressed air.
- Transmission, where air moves through treatment equipment, receivers and distribution pipework.
- Demand, where compressed air supports productive end uses and waste occurs.
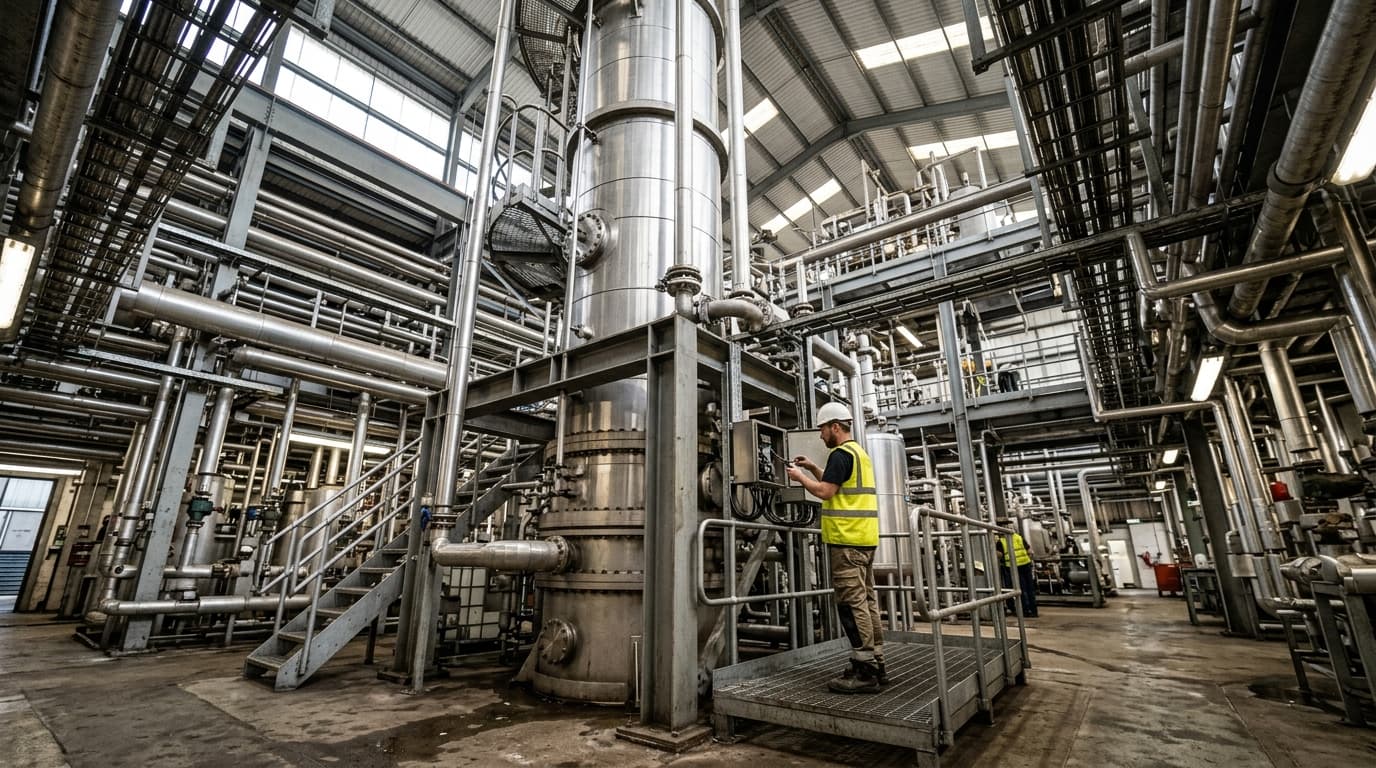
Leakage usually occurs in transmission and demand, but its electricity cost begins in supply. This whole-system view prevents a narrow leak survey from overstating or understating the result.
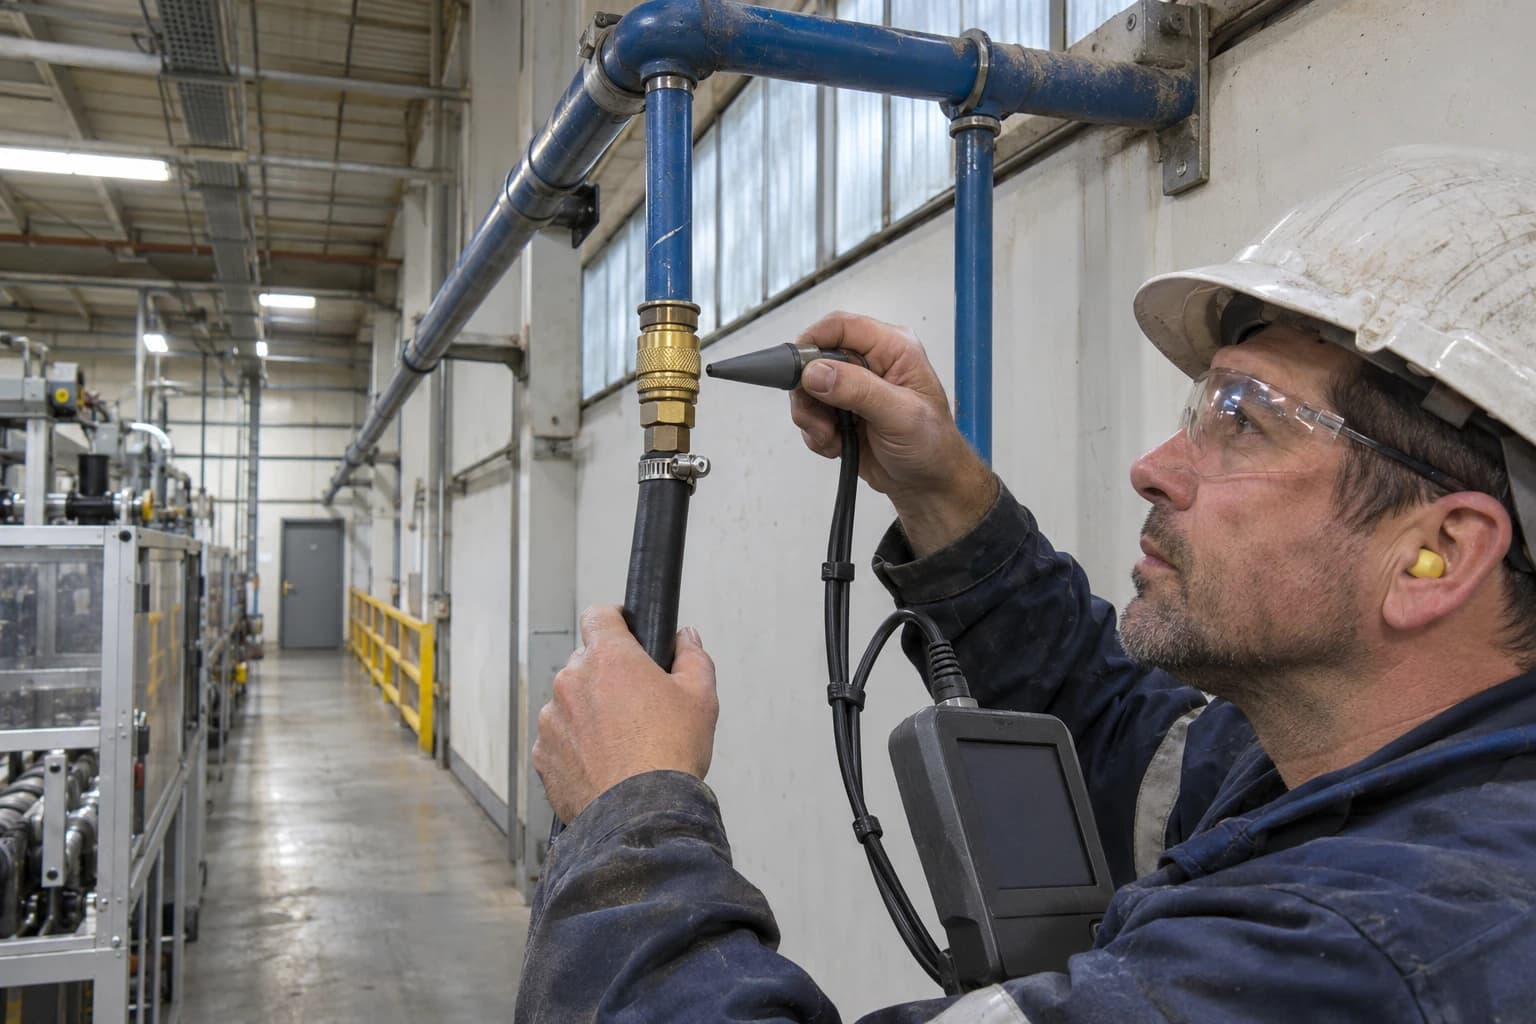
An ultrasonic detector can locate a defective valve, hose or coupling. It cannot establish how much electricity the compressor consumes to sustain the loss. The assessment must link the fault, lost air flow, system pressure, compressor power and operating time.
Establish a representative baseline
ISO 11011 requires an assessment to define its scope, collect system information, analyse data and report findings. For leakage quantification, the baseline should establish normal operation before repairs begin.
The assessment record should cover:
- Compressor types, rated capacities and control arrangements
- Compressor electrical power and run status
- Air treatment equipment and receiver capacity
- Main-header pressure and pressure variation
- Main air flow and major distribution-zone flow where practical
- Production periods, shift patterns and planned shutdowns
- Critical equipment supplied outside production hours
- Known leaks, historical repairs and redundant pipework
Comparing two monthly electricity bills before and after repairs does not isolate leakage savings. Production output, ambient temperature, compressor sequencing and pressure setpoints may differ between billing periods.
Use coincident measurements
Flow, pressure, electrical power and compressor state should be logged over the same period. That alignment allows the assessor to explain changes in air demand.
Fifteen-minute intervals can reveal broad operating patterns. Shorter intervals may be required where fixed-speed compressors load and unload rapidly, or several compressors sequence in response to changing demand.
Air-volume reference conditions also require careful control. A report should state whether it presents actual volume at line conditions or free air delivered at a stated reference condition. Mixing readings with different reference conditions can create false savings claims.
How to find and classify compressed air leaks
Use ultrasonic detection to locate faults
Ultrasonic leak detection identifies the high-frequency sound produced when compressed air escapes through a restriction. It is effective in noisy industrial areas and helps maintenance teams locate leaks that staff cannot hear.
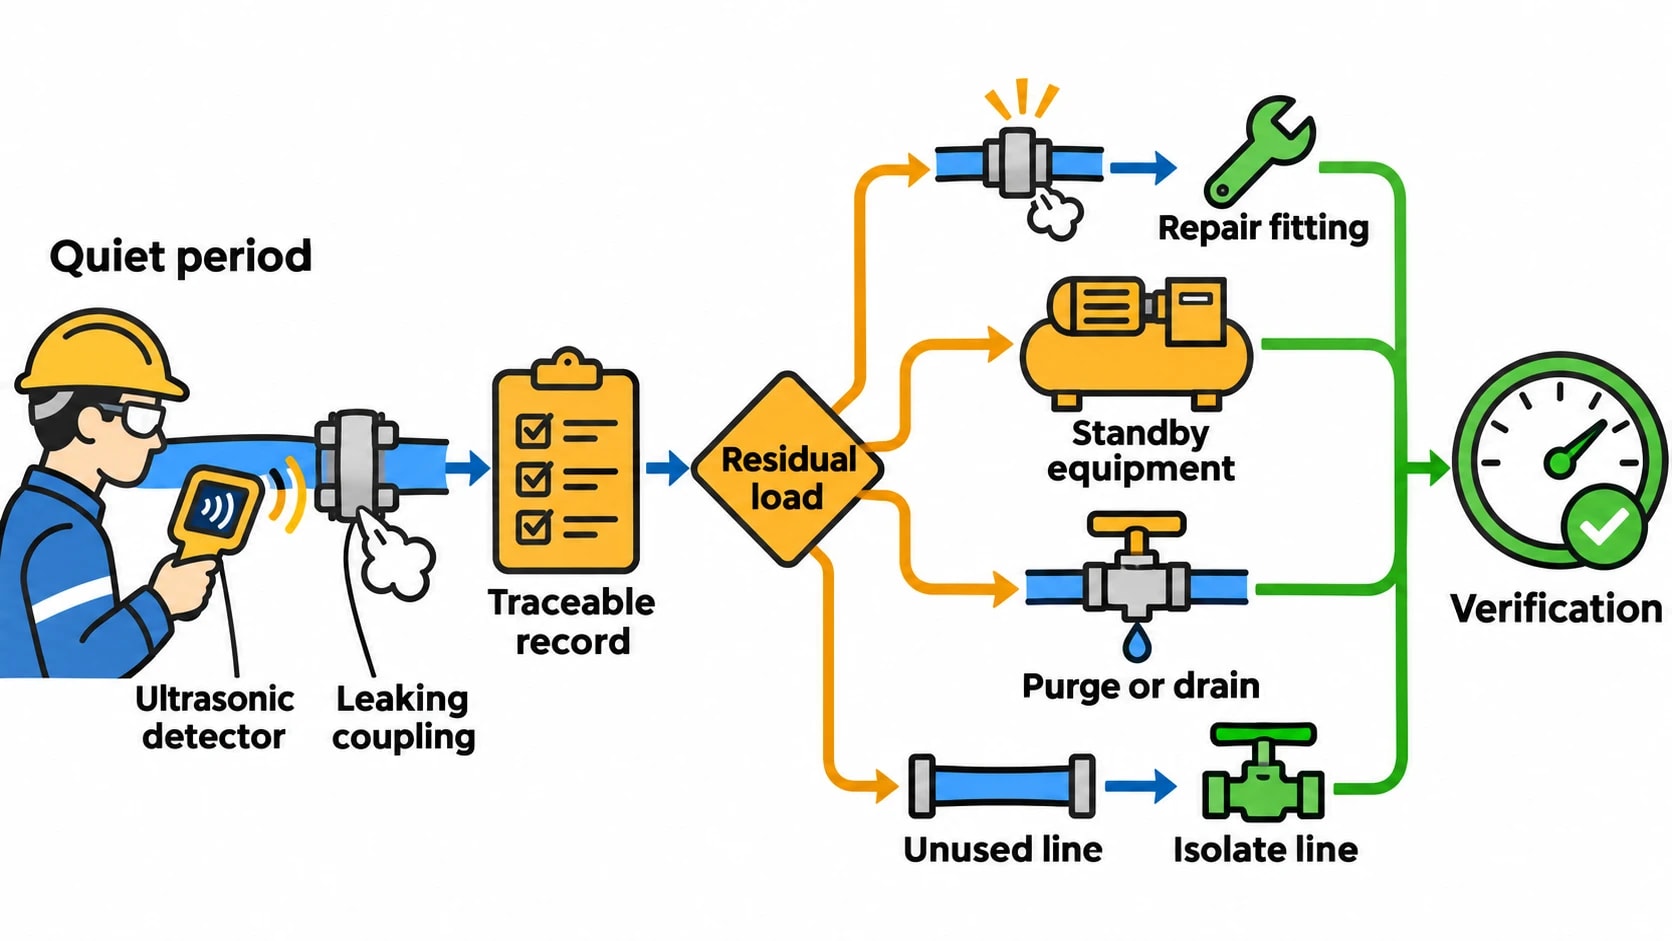
The Carbon Trust recommends checking for leaks during quiet periods. Productive air demand is lower, making ultrasonic detection easier and allowing the assessor to observe residual air use with fewer production-related variables.
Each fault should receive a traceable record containing:
- A unique identification number
- Exact location and component description
- Component type, such as coupling, hose, fitting or valve
- Estimated severity or measured flow
- Photograph where site procedures permit it
- Responsible owner and target repair date
- Repair status and verification result
Common leak points include quick-release couplings, threaded fittings, hose assemblies, pneumatic valves, cylinder seals, filter housings, condensate drains and isolation valves that no longer seal fully.
Separate leakage from other residual demand
A low overnight air-flow reading does not automatically equal leakage. It can include productive equipment left in standby, open blow-off points, purge flow, automatic drains and redundant pipework that remains pressurised.
A compressed air assessment should classify each residual load and identify the required action. Repairing a leaking fitting differs from fitting isolation valves to an unused production line. Both can reduce waste, but require different budgets, owners and verification methods.
Track energy consumption, emissions, and process parameters with seamless PLC/SCADA integration via Modbus, OPC-UA, and MQTT protocols.
Measuring compressed air leakage flow
No-load testing for load-unload compressors
A no-load test can estimate leakage where a compressor operates in a clear load-unload cycle and its full-load output is known. The facility isolates or safely shuts down productive air demand, leaving the compressor to maintain pressure against residual system demand.
The assessor records loaded and unloaded time across several representative cycles. The proportion of time spent loaded, applied to known compressor output, estimates residual air demand.
For example, a compressor delivering 500 m³/h at full load and running loaded for one minute in a five-minute cycle supplies about 100 m³/h on average during the test. The assessor must then investigate whether that 100 m³/h represents leakage, intentional consumption or a mixture of both.
This method becomes less reliable where multiple compressors interact, variable-speed compressors alter output continuously, hidden consumers remain live or compressor capacity is unknown at operating conditions.
Direct flow and power measurement
Temporary or permanent flow metering provides a stronger basis for compressed air leakage quantification. The assessor measures main air flow during a verified non-production period and compares it with compressor power, header pressure and compressor state.
A stable residual flow at normal operating pressure indicates the background load. Electrical measurements show how the compressor system responds to that load.
Two facilities can lose the same air volume yet incur different electricity costs. One may keep a fixed-speed compressor loaded. Another may allow a variable-speed compressor to reduce speed and input power. Site-specific measurement provides stronger evidence than a generic electricity-per-volume value.
Pressure-decay testing in defined zones
Pressure-decay testing measures the rate at which pressure falls after isolating a known section of the system. It can identify leakage in a defined zone containing known pipework and receiver volume.
The method becomes difficult to defend when system volume is uncertain, temperature changes influence pressure or automatic controls reconnect supply. It is best used as a diagnostic or before-and-after comparison method rather than the sole basis for an annual cost claim.
Converting compressed air leakage into annual cost
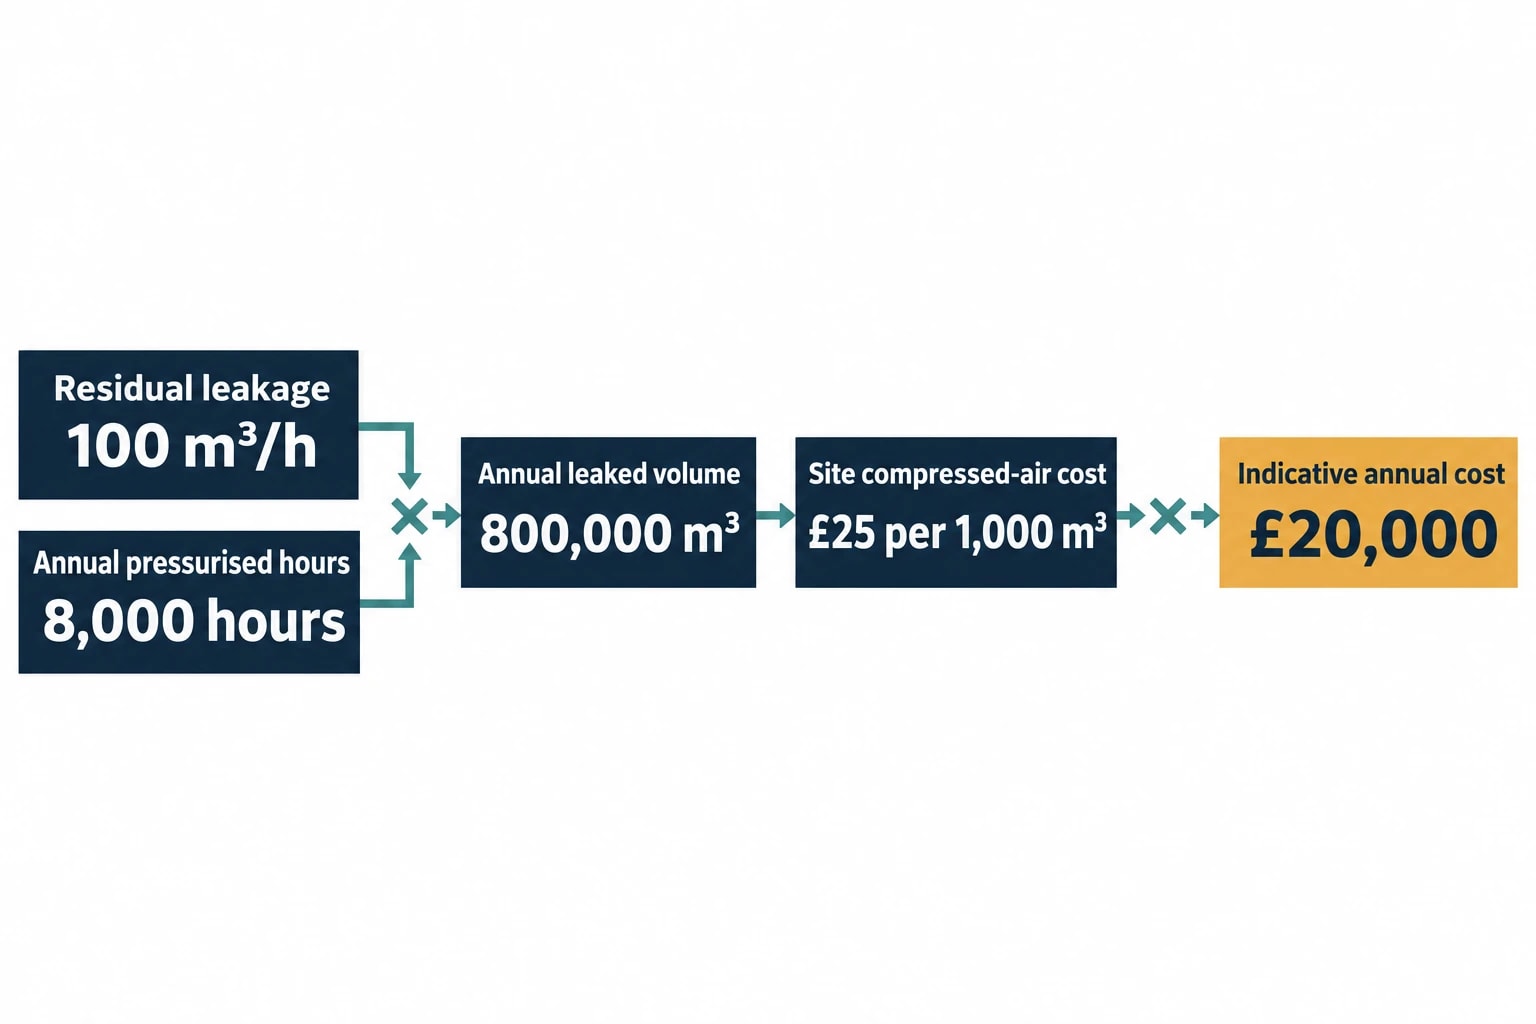
Calculate the site cost per 1,000 m³
The cost-per-1,000-m³ method turns a measured leakage rate into a financial value that maintenance and finance teams can review together.
Establish the electrical energy used to produce compressed air over a representative period. Match that electricity use to the metered air volume delivered during the same period. The resulting site-specific energy intensity can be combined with the relevant electricity cost to produce a cost per 1,000 m³.
The calculation must use consistent air reference conditions and state the tariff assumption. A screening exercise may use an all-in electricity rate, while a detailed business case may distinguish commodity charges, network costs and capacity-related charges.
| Assessment input | Illustrative value | Purpose |
|---|---|---|
| Residual leakage flow | 100 m³/h | Measures continuous air loss |
| Annual pressurised hours | 8,000 hours | Includes non-production periods |
| Annual leaked volume | 800,000 m³ | Converts flow into yearly waste |
| Site compressed-air cost | £25 per 1,000 m³ | Uses measured system energy and tariff assumptions |
| Indicative annual cost | £20,000 | Supports repair prioritisation |
The figures are illustrative. A residual load of 100 m³/h operating for 8,000 hours produces 800,000 m³ of annual waste. At £25 per 1,000 m³, the estimated annual cost is £20,000.
State compressor-control assumptions
Savings depend on how the compressor system reacts after repairs. A leak reduction may reduce electricity consumption by shortening loaded running time, lowering variable-speed compressor input, avoiding the start of an additional compressor or enabling a lower pressure setpoint.
A report should document the relevant control condition. It should not assume that each cubic metre of saved air delivers identical kWh savings at all loads.
The Carbon Trust notes that idling compressors can consume 20% to 70% of full-load power. Removing air demand may produce a modest power change if a compressor remains idling, but a larger reduction if the repair allows it to stop.
Include carbon only after electricity saving is established
A leakage project can support Scope 2 emissions reporting once the electricity reduction has been measured or credibly estimated. The emissions calculation should retain a clear audit trail: baseline period, repair date, post-repair period, electricity factor and cost assumption.
The repair register documents the energy-efficiency measure, its financial value and its carbon impact.
Verifying leakage repairs and sustaining the result
Confirm each repair at the component
Maintenance teams should re-scan the repaired component ultrasonically and update its record. They should also check that the repair has not created a pressure drop, air-quality problem or operational issue.
A post-repair inspection is particularly important for hose assemblies, threaded fittings, condensate drains and valves that cycle automatically. A repair that works during a daytime inspection may require further observation during normal operating conditions.
Re-test the non-production baseline
The stronger verification test repeats the original no-demand assessment or compares equivalent non-production windows. The comparison should use the same system boundary, header pressure, compressor configuration and measurement points.
A credible verification record includes:
- Baseline residual flow and electrical demand
- Date and detail of each repair
- Post-repair residual flow and electrical demand
- Changes in production schedule or plant configuration
- Annualised energy, cost and emissions savings
- Remaining leakage and next repair priorities
Leakage returns as hoses degrade, seals wear, fittings loosen and production equipment moves. The Carbon Trust recommends an ongoing test-and-repair programme because one repair campaign does not prevent new faults.
The most useful leakage KPI is measured residual air demand under defined non-production conditions. Expressed in m³/h, kWh and cost, it gives facility managers a repeatable indicator of invisible waste and a defensible basis for maintenance investment.
This article reflects the independent analysis and editorial opinion of EnerTherm Engineering. Product names, trademarks, and brands mentioned belong to their respective owners. EnerTherm Engineering is not affiliated with, endorsed by, or a licensee of any third-party software or product mentioned unless explicitly stated.

Technical Manager — EnerTherm Engineering
John Naranjo is Technical Manager at EnerTherm Engineering, bringing specialist expertise in chemical and environmental engineering. He recently led the implementation of Omni Vision, EnerTherm's real-time energy and utility monitoring platform. He holds an MSc in Environmental Engineering from the University of Huelva and a BSc in Chemical Engineering, with memberships in both the Energy Institute and IChemE.
