Facility Energy Intensity Analysis: Beyond Utility Bills
ISO 50006 EnPI normalisation links energy use to output for SECR reporting
Facility energy intensity analysis measures energy consumed per unit of production, adjusted where necessary for operating factors that materially affect consumption.
A factory can cut its monthly gas bill and still become less efficient. Lower output, milder weather, a production stoppage or a change in product mix can reduce total consumption while more energy is used to make each tonne, batch or finished unit. Utility bills record what crossed the site boundary. They rarely explain why it was used, where it went or whether the process performed efficiently.
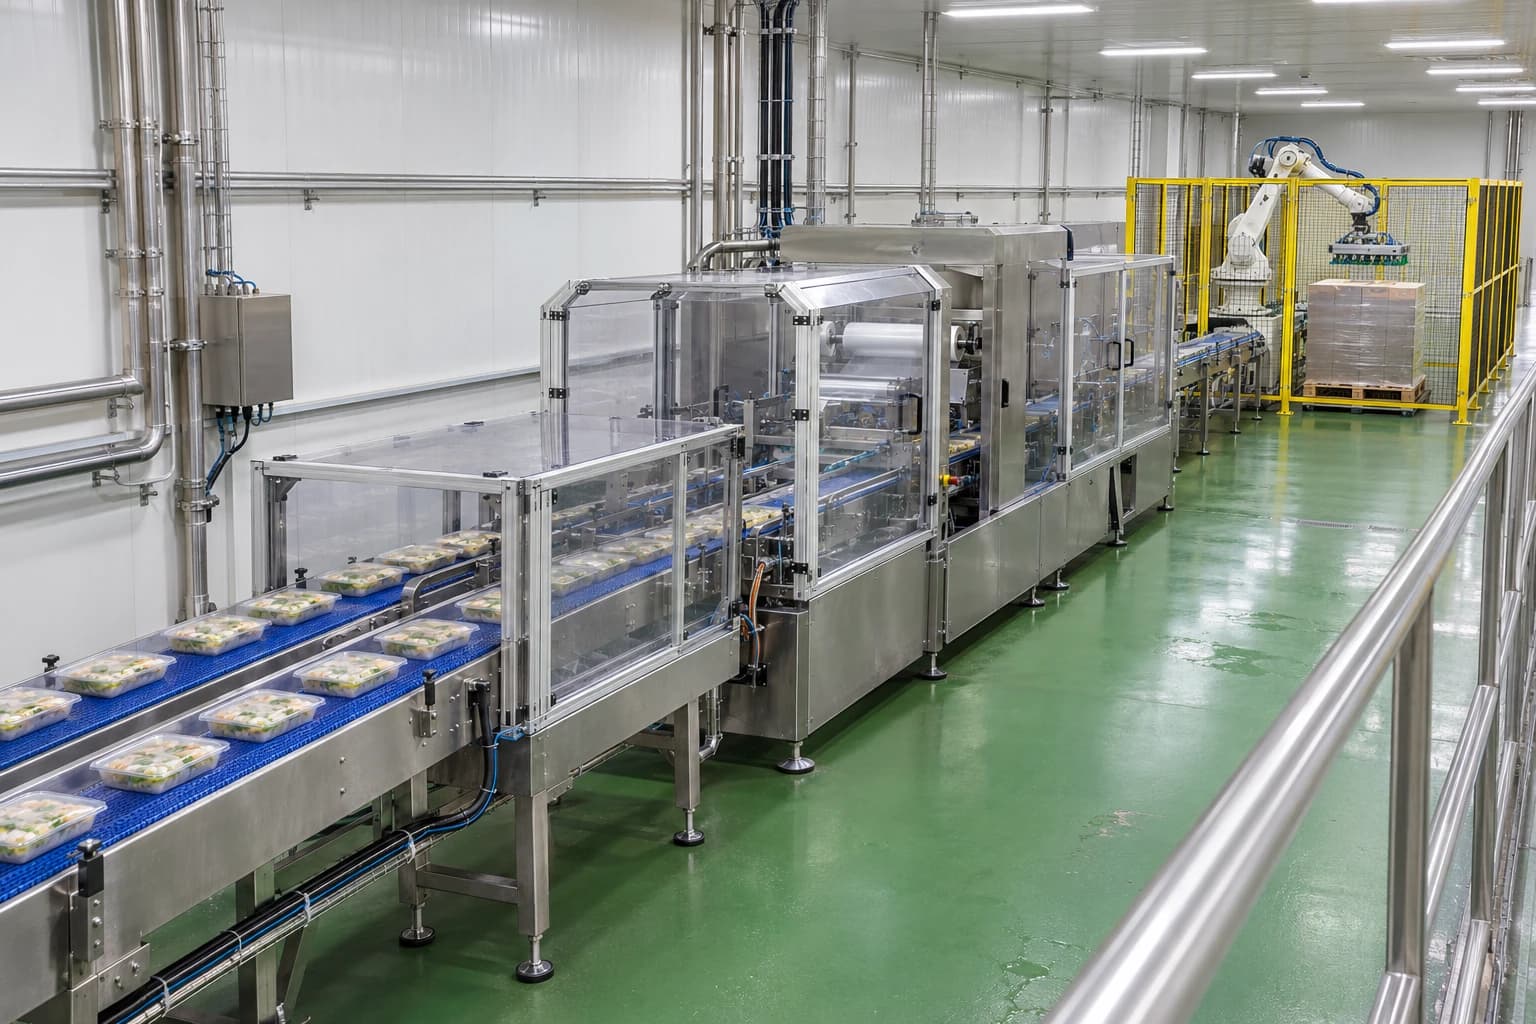
That distinction matters for high-output manufacturing and processing sites. Energy is a production input, alongside raw materials, labour and maintenance. A facility energy intensity analysis connects metered utilities to production data. It turns a monthly cost total into a performance measure that engineering, operations and sustainability teams can act on.
For UK organisations, the discipline also supports the intensity ratios required under Streamlined Energy and Carbon Reporting, while providing evidence to maintain Energy Performance Indicators and Energy Baselines within an ISO 50001 energy management system.
Why utility bills cannot measure facility energy performance
A utility bill provides a valuable financial record. It establishes how much energy a site bought, when charges rose and whether peak demand increased. It is a poor standalone indicator of process efficiency.
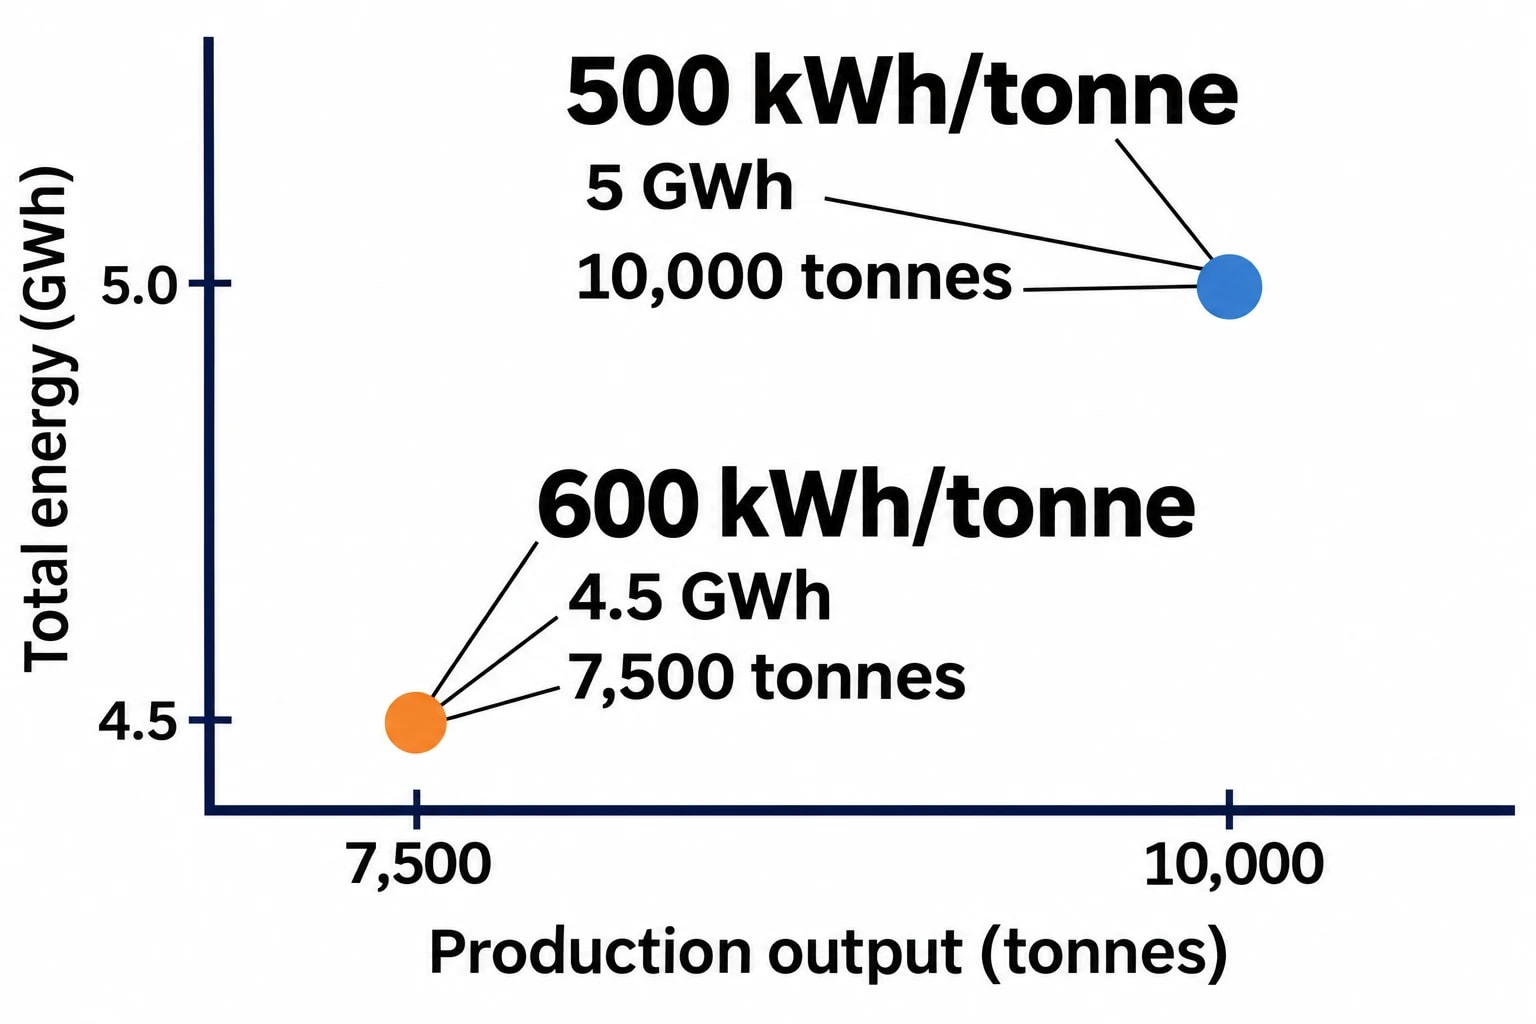
A food plant producing 10,000 tonnes in a month and consuming 5 GWh has a different performance profile from the same plant producing 7,500 tonnes on 4.5 GWh. Total consumption fell by 10%, but energy use per tonne rose from 500 kWh to 600 kWh. The utility bill records the lower total. Facility energy intensity analysis identifies the deterioration.
Total consumption and energy intensity answer different questions
Total consumption helps finance teams reconcile invoices, purchase energy and track absolute carbon emissions. Energy intensity tests how efficiently a facility converts energy into useful output.
Common industrial intensity measures include:
- kWh per tonne of product
- kWh per batch
- kWh per unit produced
- m³ of gas per tonne
- kgCO₂e per tonne of finished product
- Compressed-air kWh per production hour
- Steam per batch or per tonne of process material
The denominator must reflect the activity that drives energy consumption. Tonnes may suit bulk chemicals, aggregates and food processing. Batches can be more meaningful in pharmaceutical manufacture. Individual units may suit discrete manufacturing. A single plant may need several EnPIs where processes, products and utility streams differ materially.
Cost can conceal physical deterioration
Energy cost per tonne is commercially useful, but it combines physical efficiency with tariff changes, fuel prices and contractual terms. A production line can improve its kWh per tonne while its cost per tonne rises because electricity prices increased. Conversely, a lower cost per tonne can mask higher physical consumption after a tariff change.
Facility managers therefore need at least two linked views:
| Measure | Primary purpose | What can distort it |
|---|---|---|
| Total energy consumption | Procurement, carbon accounting and site demand management | Production volume, weather, shutdowns |
| Energy cost per tonne | Financial control and margin analysis | Energy tariffs, hedging and price changes |
| Energy per tonne or batch | Process and facility efficiency | Product mix, weather and operating pattern |
| Normalised EnPI | Measured performance against a comparable baseline | Data quality and model selection |
The value comes from reading these measures together. A rise in kWh per tonne alongside stable energy cost per tonne may point to a tariff change masking deterioration. A fall in normalised energy use with flat production can support the measured impact of a heat-recovery, controls or maintenance project.
Omni Vision delivers turnkey utility metering, CO2 tracking, and AI-powered production KPI intelligence — giving you real-time dashboards and actionable insights across your entire facility.
Facility energy intensity analysis and ISO 50006
ISO 50006:2023 provides guidance on establishing, using and maintaining Energy Performance Indicators, known as EnPIs, and Energy Baselines, known as EnBs. The standard supports organisations using ISO 50001:2018 and applies to businesses of different sizes and sectors.
An EnPI measures energy performance. An EnB is the reference against which that performance is assessed. Together, they distinguish operational variation from genuine improvement.
Establishing a useful Energy Performance Indicator
An EnPI needs a clear boundary, a reliable numerator and a meaningful denominator. “Site electricity per tonne” can be useful, but it may hide a major loss in a steam system, compressed-air network or high-temperature process. A more effective hierarchy often includes facility, department and significant energy use indicators.
For example, a processing site might monitor:
- Facility energy in kWh per tonne of dispatched product
- Boiler gas consumption per tonne of steam generated
- Compressed-air electricity per operating hour and per unit output
- Refrigeration electricity per tonne of chilled product
- Clean-in-place thermal energy per completed cycle
- Production-line electricity per batch, with product family recorded
Each indicator should state its purpose, boundary, units, source systems, data frequency, accountable owner and review frequency. Without those details, the number becomes difficult to reproduce during an internal review or certification audit.
Selecting the baseline period
A baseline should represent normal operation before the changes being assessed. It should use data that are complete, traceable and representative of expected production conditions.
An abnormal baseline can make later performance look better or worse than it is. A period affected by an extended shutdown, material shortage, major plant failure or unusual product campaign may be unsuitable. Energy teams should retain the source data, inclusion criteria, calculation method and exclusions used to establish the baseline.
ISO 50006:2023 recognises that baselines may require adjustment after material changes. A new production line, permanent process redesign, change in site boundary or replacement of a major energy system can alter the relationship between energy use and output. The organisation should define its adjustment method in advance and retain the rationale.
Ratio EnPIs work best with stable production conditions
Simple ratios remain useful. They are transparent, easy to explain and effective for a stable process with a single product. Their limits become obvious when the operation changes.
A kiln operating at low utilisation may consume more kWh per tonne because fixed losses are spread across fewer tonnes. A plant making a more energy-intensive grade may appear less efficient even where the process has performed as expected. A cold winter can increase space-heating energy without indicating poorer boiler efficiency.
These effects call for EnPI normalisation.
EnPI normalisation separates operating variation from efficiency
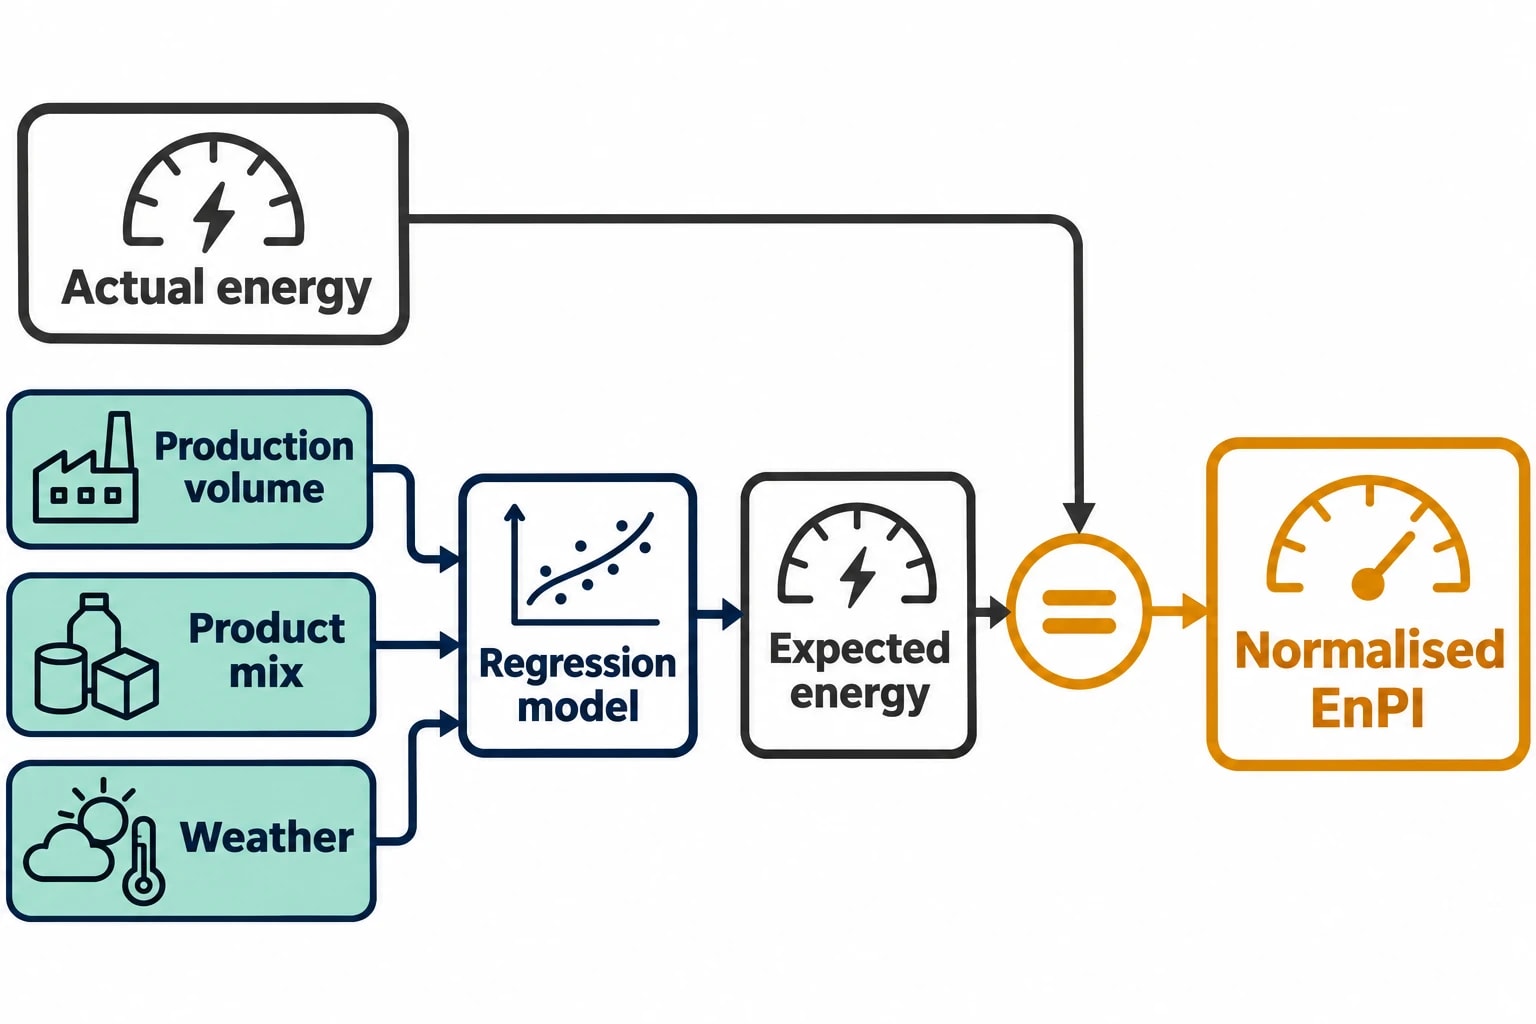
EnPI normalisation adjusts energy performance analysis for relevant variables that routinely affect energy consumption. It allows a site to compare actual energy use with the energy expected under equivalent operating conditions.
Regression analysis is commonly used for this purpose. It estimates the relationship between energy consumption and independent variables while controlling for their combined influence. In an industrial setting, the dependent variable is usually a utility stream or total energy consumption. The independent variables reflect factors with a credible, measurable effect on consumption.
Relevant variables should come from process knowledge
Production volume is often the starting point, but it may not be enough. A meaningful model reflects the operation rather than adding variables until a spreadsheet produces a favourable result.
Potential relevant variables include:
- Tonnes, batches or units produced
- Product family or grade
- Operating hours and shift pattern
- Heating and cooling degree days
- Ambient temperature or humidity
- Feedstock moisture or quality
- Line utilisation
- Number of clean-in-place cycles
- Steam demand from adjacent processes
- Permanent changes to equipment configuration
An energy engineer should test candidate variables against plant behaviour and available data. A variable can be statistically associated with energy use without being suitable for a management indicator. The final model needs physical sense as well as statistical validity.
Product mix needs explicit treatment
A site producing several product grades can report a misleading facility-wide kWh-per-tonne figure. One grade may require longer residence time, lower temperatures, additional drying, higher refrigeration load or more cleaning. Volume has increased, but the output mix has shifted towards a more energy-intensive product.
There are two practical approaches. The first is to report separate intensity indicators for each product family or process route. The second is to include product-mix information in a normalised model. The better choice depends on the production structure, the availability of batch data and whether equivalent units can be defined credibly.
An artificial conversion factor should not be introduced merely to create one headline number. Separate indicators are often clearer and more useful to production teams.
Normalisation must remain auditable
A normalised EnPI is only as reliable as the input data and documented method. Teams should keep the model version, baseline period, data sources, variable definitions, review date and reason for any baseline adjustment.
This record supports management review and prevents a common problem: a reporting method changes quietly after an efficiency project, leaving no comparable evidence of savings.
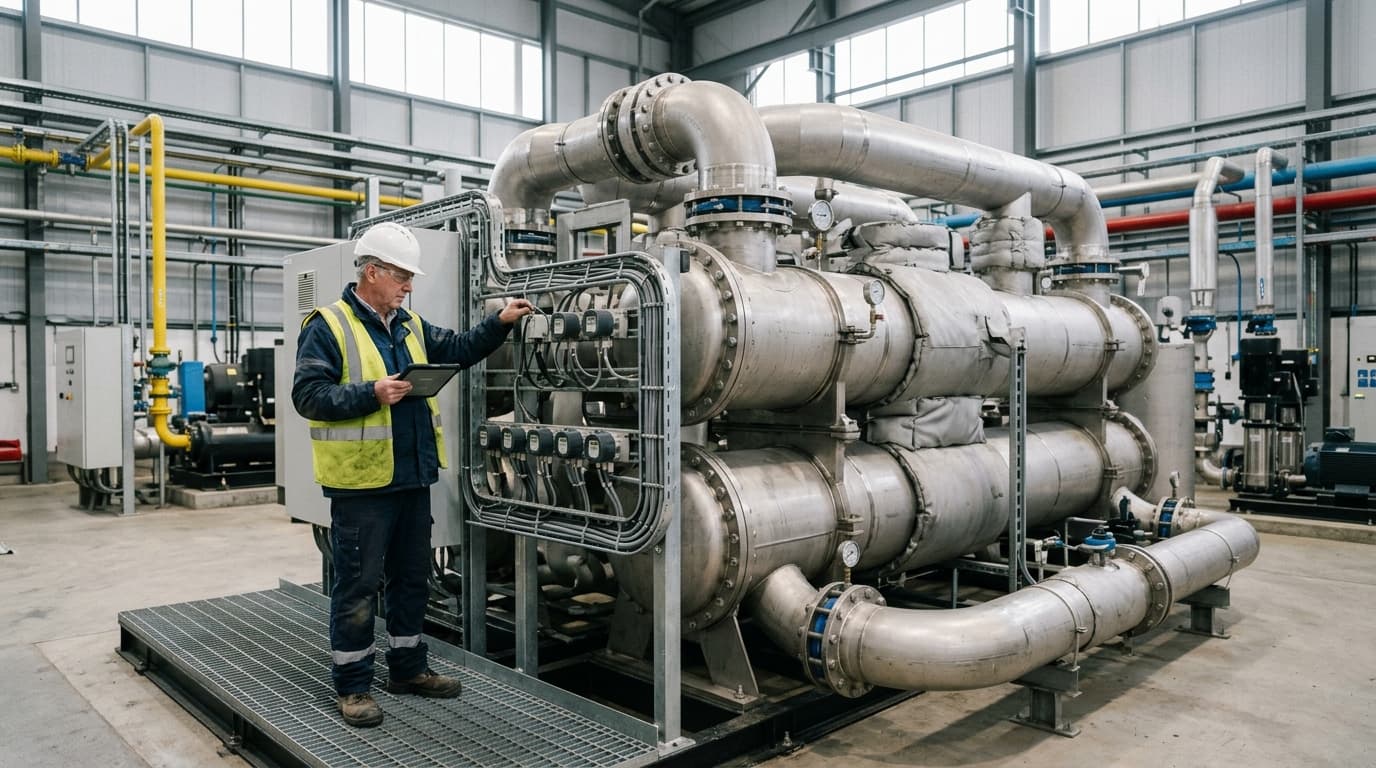
Track energy consumption, emissions, and process parameters with seamless PLC/SCADA integration via Modbus, OPC-UA, and MQTT protocols.
From meter data to process-specific energy insight
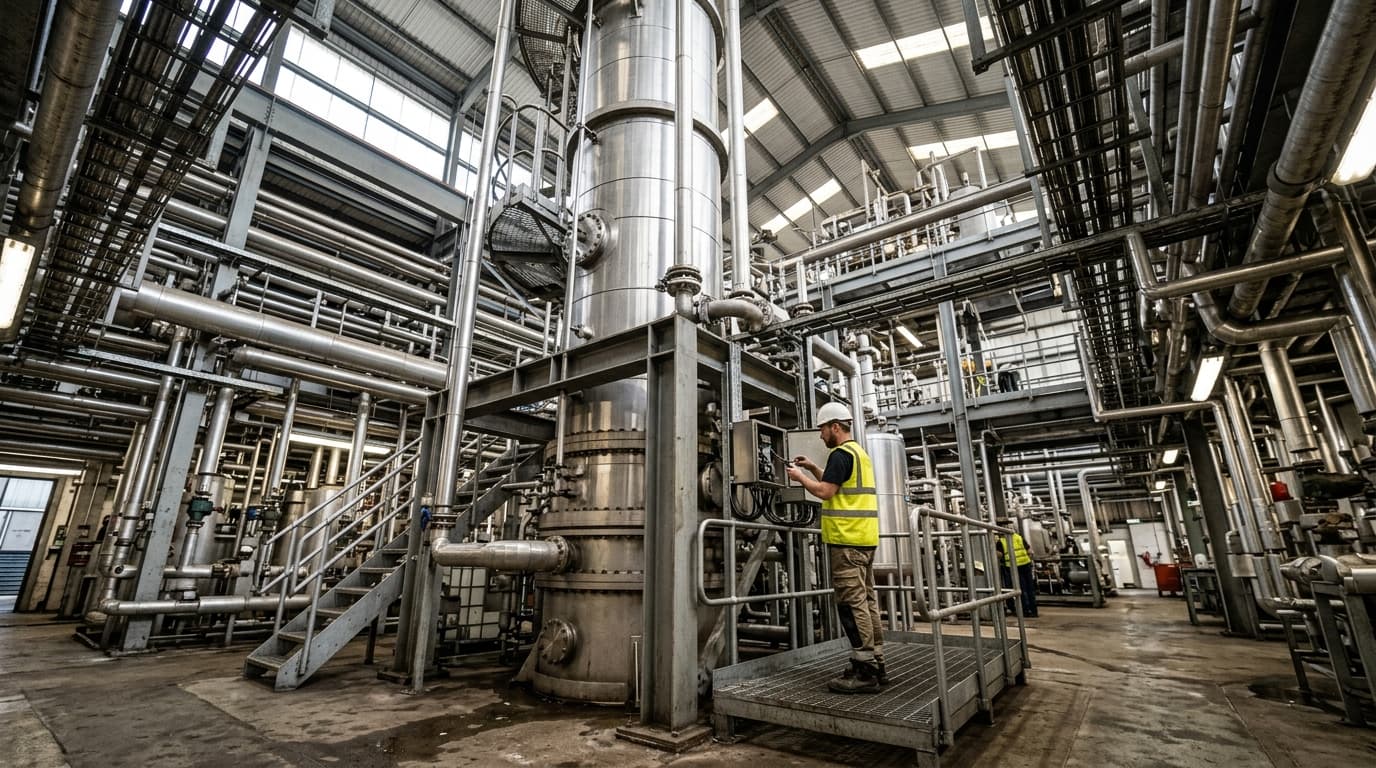
A utility bill aggregates a site. Facility energy intensity analysis needs enough metering detail to assign consumption to the activities that drive it.
The appropriate metering architecture depends on the site, but the central principle is consistent: measure the utility where an accountable process, department or major asset begins to consume it.
Start with the largest and least understood loads
A practical programme does not require a meter on every motor before it begins. It should first identify significant energy uses and metering gaps.
Typical priority points include:
- Main incomer electricity and gas
- Boilers and steam distribution headers
- Compressed-air generation and principal production branches
- Refrigeration plants and cold stores
- Thermal processing lines
- Effluent treatment
- High-load pumps, fans and vacuum systems
- Departments with distinct production outputs
Sub-meter data becomes useful when aligned with production records. A gas meter read once a month cannot diagnose the energy impact of an individual batch. Fifteen-minute, hourly or shift-level data may reveal abnormal base load, idle-period demand, compressor cycling, boiler short-cycling or deterioration in a process line.
Data governance is an engineering requirement
Energy intensity analysis fails when meter readings, production records and operating logs use incompatible time periods or boundaries. The data plan should define:
- Which meter is the source of record for each utility stream.
- How energy is allocated where systems serve more than one department.
- The timestamp, units and interval for each dataset.
- How missing, estimated or anomalous data are flagged.
- Which production measure is the official denominator.
- Who reviews data quality before performance is reported.
Allocation rules deserve particular care. A central boiler house may serve several lines, while a compressor may support both process equipment and general services. Where direct branch metering is unavailable, an organisation can use a documented allocation method, then improve measurement where uncertainty materially affects decisions.
SECR and ESOS make intensity data more valuable
UK Streamlined Energy and Carbon Reporting requires organisations in scope to disclose energy use, greenhouse gas emissions, at least one intensity ratio, energy-efficiency actions and the methodologies used. Government guidance states that the ratio should use a quantifiable factor appropriate to the business activity and remain consistent year on year.
For a manufacturer, tonnes of production may be more informative than revenue or floor area. The Environmental Reporting Guidelines give tonnes of CO₂e per total tonnes of production as an example for manufacturing. Granular facility energy intensity data provides the operational evidence behind that annual disclosure.
SECR reporting benefits from operational traceability
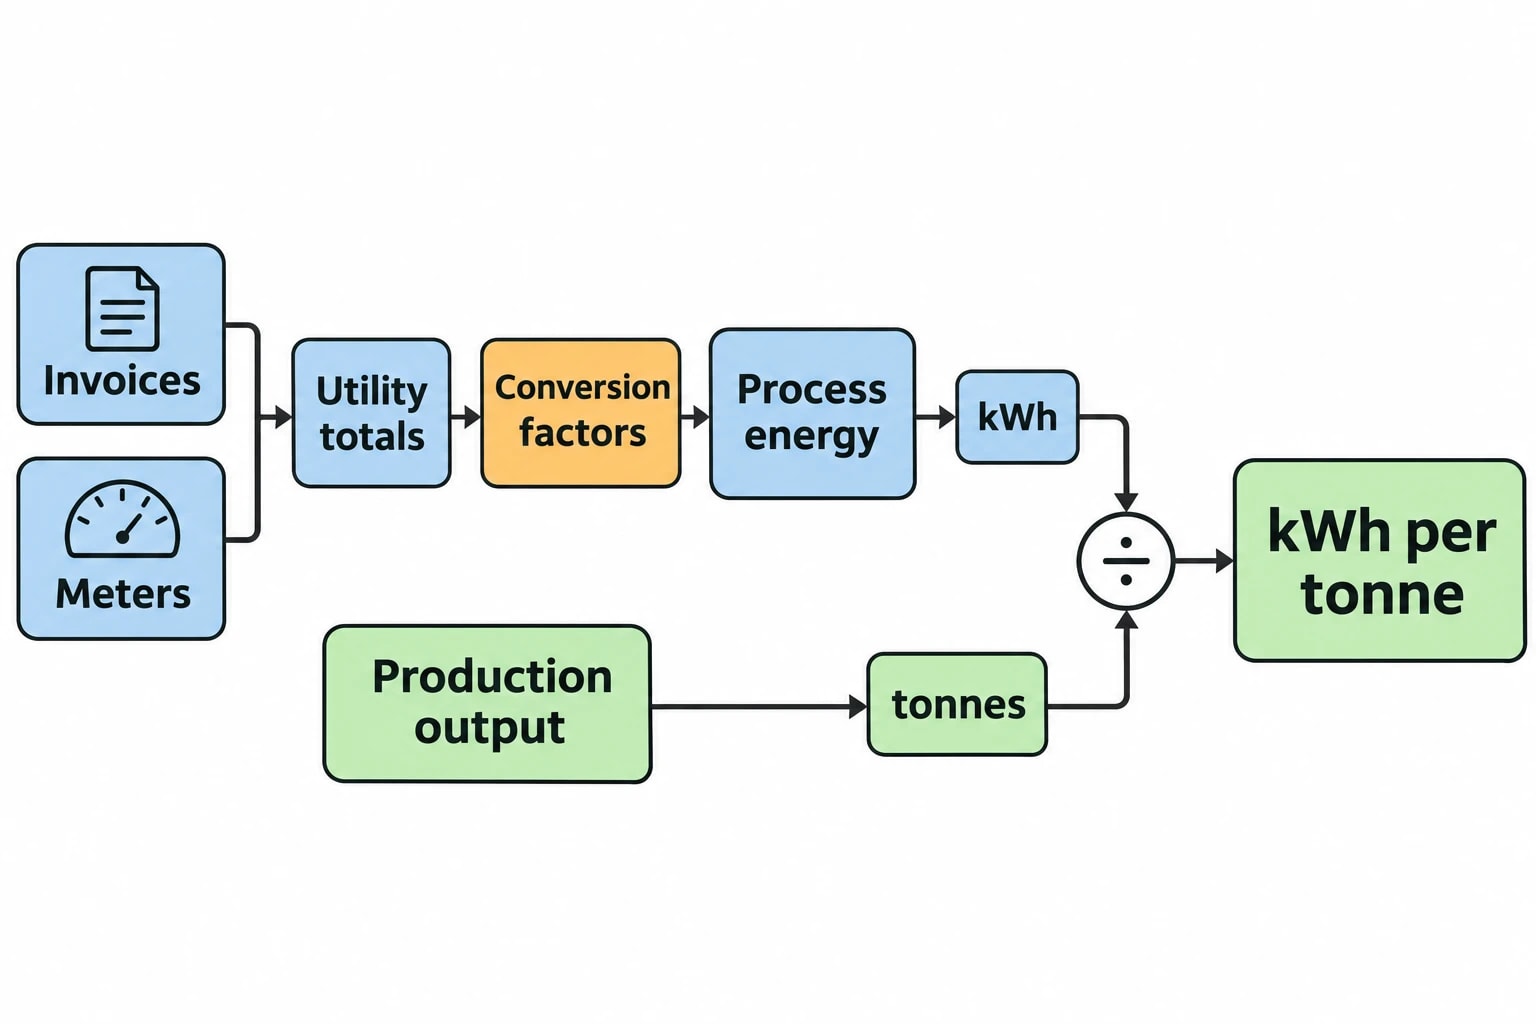
A credible annual intensity ratio requires more than a spreadsheet prepared at year end. Teams need a clear trail from invoices and meters to utility totals, conversion factors, emissions calculations and the selected production denominator.
The same dataset can support internal reporting at a more useful level:
- Monthly kWh per tonne by site and department
- Normalised energy performance against the established baseline
- Electricity, gas and steam intensity by production area
- Scope 1 and Scope 2 emissions intensity
- Energy use during shutdowns, start-ups and low-output periods
- Documented energy-efficiency actions and their observed effect
This approach prevents a compliance figure from becoming detached from plant operations. It also gives sustainability officers a defensible explanation for material year-on-year movements.
ESOS Phase 4 adds a further requirement
The current ESOS framework requires participating organisations to calculate energy intensity ratios for buildings, transport, industrial processes and other energy uses outside those categories. The ratio must use a quantifiable indicator associated with the relevant organisational purpose and should use verifiable data where reasonably practicable.
For industrial processes, government guidance describes the ratio as process energy consumption in kWh divided by total industrial output. Output may be expressed as tonnes, litres, individual units or another relevant unit. Facilities with separate outputs may need separate ratios rather than forcing unrelated products into one measure.
Turning energy intensity findings into action
The first result from facility energy intensity analysis is often a question, not a project. A rising steam-per-tonne indicator may result from boiler losses, condensate-return problems, a product-mix shift or a lower operating rate. Engineering investigation establishes the cause.
Use deviations to direct plant investigation
A sustained gap between actual energy use and normalised expected energy use can trigger targeted checks. The response should link the indicator to a controllable process or asset.
Examples include:
- Higher compressed-air energy at unchanged output, prompting leak surveys, pressure review and compressor sequencing checks.
- Rising boiler gas intensity, prompting combustion checks, blowdown review, insulation inspections and condensate-return analysis.
- Increased refrigeration electricity per tonne, prompting review of suction pressure, defrost schedules, door management and condenser condition.
- Electricity use during idle production periods, prompting operators to review shutdown procedures and building-management system setpoints during validated change windows.
- A widening gap between one product family and others, prompting analysis of cycle time, temperature profile or cleaning demand.
The intensity metric identifies where to look. It does not replace engineering judgement, maintenance records or process knowledge.
Omni Vision for energy consumption
EnerTherm Engineering’s Omni Vision Energy Intelligence Platform brings utility and production information into one operational view. Precision instrumentation and non-invasive PLC connectivity collect data from electricity, gas, water, steam, compressed air and oil streams, while production-linked KPI mapping supports indicators such as energy per batch, kWh per tonne and cost per unit.
The platform’s read-only data approach suits environments where operational integrity is essential. It supports meter-to-process analysis without writing commands back to plant systems. That matters in facilities operating under GMP, HACCP and other tightly controlled production practices.
For an energy intensity programme, the useful outcome is a repeatable monthly cycle: validate the data, review actual and normalised EnPIs, investigate material variance, assign actions, and retain the evidence.
This article reflects the independent analysis and editorial opinion of EnerTherm Engineering. Product names, trademarks, and brands mentioned belong to their respective owners. EnerTherm Engineering is not affiliated with, endorsed by, or a licensee of any third-party software or product mentioned unless explicitly stated.

Technical Manager — EnerTherm Engineering
John Naranjo is Technical Manager at EnerTherm Engineering, bringing specialist expertise in chemical and environmental engineering. He recently led the implementation of Omni Vision, EnerTherm's real-time energy and utility monitoring platform. He holds an MSc in Environmental Engineering from the University of Huelva and a BSc in Chemical Engineering, with memberships in both the Energy Institute and IChemE.
