
Omni Vision Maps Utility Waste to Cut Plant Costs
Real-time sub-metering and AI analytics can cut baseload waste by 15-25%.
Qualifying UK organisations must assess energy used in buildings, industrial processes and transport for ESOS Phase 4, with the compliance notification due by 5 December 2027. For plant managers and finance controllers, the commercial task is more immediate: identify utility spend that rises without producing more saleable output.
Monthly invoices cannot answer that question. They show the cost of electricity, gas and water, but not which process, asset or operating condition caused the variance. A compressor can run heavily through a weekend. Corrugator heaters can remain on standby for hours. Water can leak after the final shift. Each cost may remain buried in an aggregate site bill until it becomes a material budget problem.
The route to lower industrial energy costs is to map utilities against production activity. Omni Vision links electricity, gas, water, steam, compressed air and oil consumption to operational measures such as cost per tonne, energy per batch, water per clean-in-place cycle and compressed-air baseload. The result is an evidence trail that operations, engineering and finance can use to prioritise action and verify savings.
Why industrial energy costs stay hidden in site totals
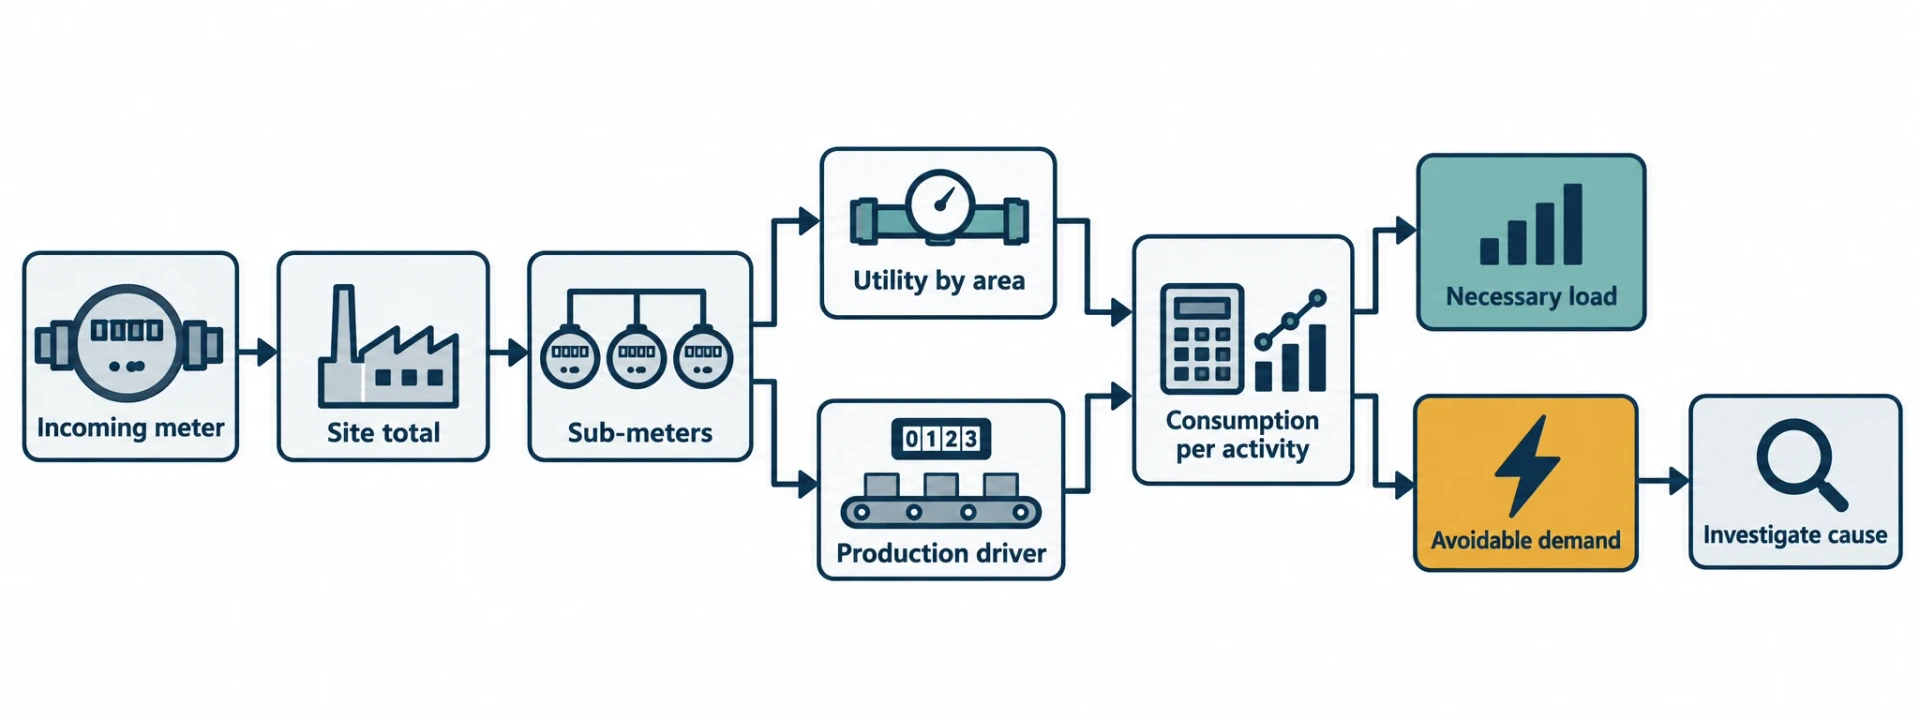
Most industrial sites have reliable incoming utility meters but limited visibility beyond the supply point. Finance receives the invoice. Engineering manages equipment condition. Production controls output and schedules. Each team holds part of the explanation, while few systems connect utility costs to the line, batch or shift responsible.
A site-wide kWh total therefore offers a weak basis for operational decisions. A lower bill may coincide with lower production, while a higher bill may reflect increased throughput and improved unit efficiency. The meaningful question is whether consumption has changed relative to the activity that required it.
Baseload is a direct cost investigation
Baseload is the demand that remains when a line or site is idle. Some of it is necessary. Refrigeration, critical environmental controls, safety systems and selected support services may need continuous operation. Other demand comes from leaks, incorrect control schedules, equipment left on standby, unnecessary set-points or poor shutdown practice.
Sub-metering separates necessary load from avoidable demand by utility and plant area. That distinction matters because each utility has different failure modes:
- Electrical baseload can reveal out-of-hours motors, pumps, extraction or lighting.
- Gas demand can point to boiler cycling, process heating left enabled or distribution losses.
- Overnight water use can indicate leakage, failed valves or uncontrolled cleaning.
- Compressed-air demand outside production may indicate leakage, excessive pressure or a compressor sequence issue.
- Steam demand can expose failed traps, poor condensate return or an unnecessary heating load.
EnerTherm identifies 15 to 25% energy-cost reductions and a sub-12-month payback as typical project targets for suitable facilities. Those figures should frame an initial opportunity assessment, not replace site measurement. The saving case needs to identify the load, its operating constraint and the corrective action that will remove the cost.
Production-linked KPIs expose poor performance
Industrial energy performance should be measured against a relevant driver of demand. Useful KPIs include:
| Utility | Production-linked KPI | Management question |
|---|---|---|
| Electricity | kWh per tonne or batch | Has unit electricity use changed at a comparable output? |
| Gas | kWh per process hour | Is heat demand rising during the same operating duty? |
| Steam | Steam per batch or clean-in-place cycle | Has the process or cleaning load changed? |
| Compressed air | kWh per machine hour | Is the compressor serving productive demand or waste? |
| Water | m³ per run or batch | Is cleaning, washdown or leakage driving consumption? |
| Oil | Litres per unit or operating hour | Is thermal or process consumption within the expected range? |
A rising electricity-per-tonne figure may result from lower throughput, extended machine idle time, poorer furnace utilisation or deteriorating equipment. A site total cannot distinguish those causes. The KPI gives engineers a bounded question to investigate.
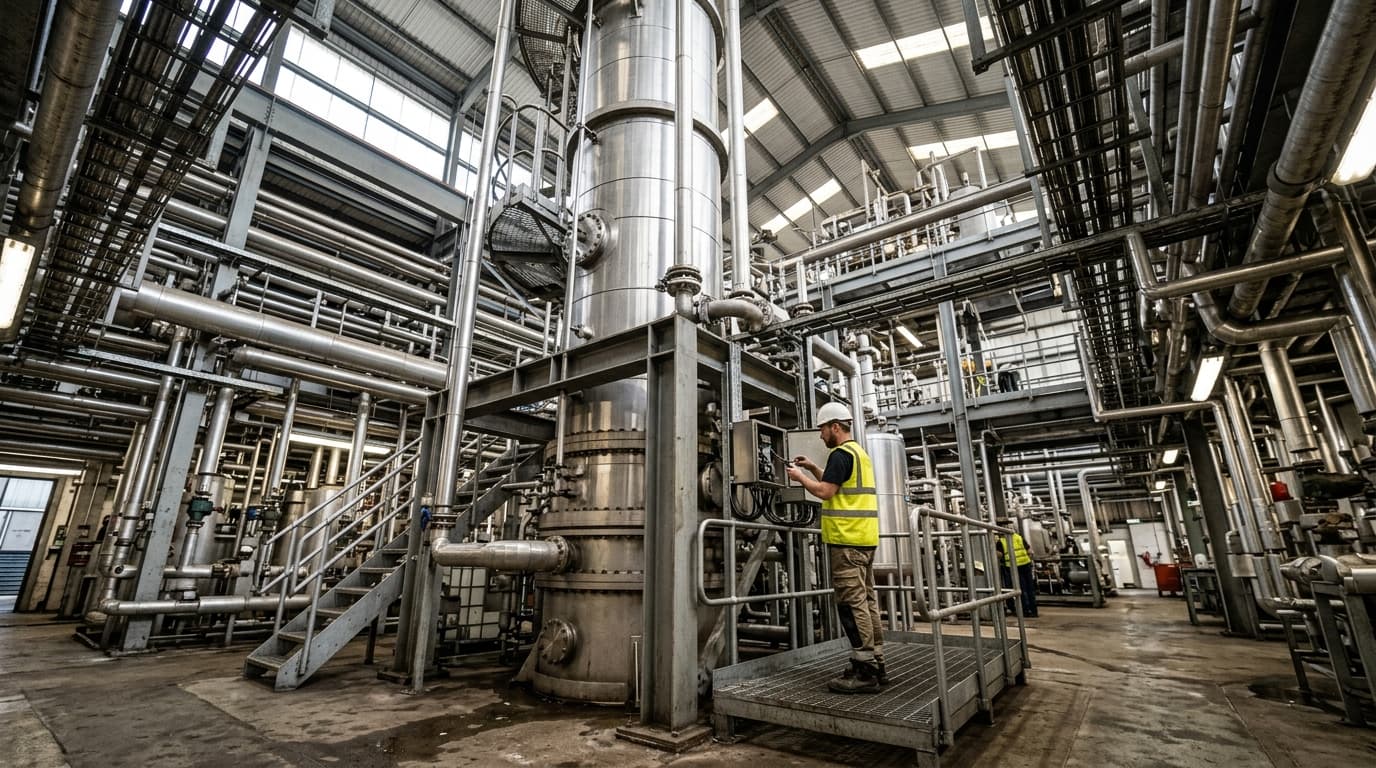
Omni Vision delivers turnkey utility metering, CO2 tracking, and AI-powered production KPI intelligence — giving you real-time dashboards and actionable insights across your entire facility.
How Omni Vision maps utility waste to plant costs
Omni Vision starts with a utility map rather than a generic dashboard. The map identifies incoming supplies, distribution branches, major users, shared services and the production records that provide operational context. Metering then focuses on points where the data can inform a maintenance, operating or investment decision.
Meter the decision points, not every connection
A plant does not need to meter every cable or pipe. It needs a hierarchy that covers the incoming supply, material energy users and priority process areas. A compressor room, boiler house, refrigeration plant, high-consumption production line or cleaning operation often provides a practical first scope.
Each meter point should have a defined purpose:
- What utility does it measure?
- Which production area or asset does it represent?
- Which KPI will use the data?
- Who investigates an abnormal result?
- What operational or maintenance action could follow?
This discipline prevents the common problem of creating data with no accountable user. A well-placed meter can show that a utility cost is associated with a condition that a named team can change.
Use interval data to investigate waste before month end
Interval data changes the timing of energy management. A monthly invoice arrives after the opportunity to stop a leak, correct a schedule or investigate a process deviation has passed. Frequent metering gives teams a chance to act while the condition persists.
A UK packaging-plant case study illustrates the value of that timing. Half-hourly gas analysis identified corrugator heaters running on standby for about six hours a day. Operators changed the operating setting, cutting the stated hourly standby cost from about £15 to £8: a 47% reduction, with estimated annual savings of £15,300.
The point is not the specific equipment setting. It is the method: measure a discrete utility load, establish the operating condition, assign an intervention and confirm the financial result.
Separate integration from analytics
EnerTherm Engineering provides the physical metering, instrumentation and integration work behind Omni Vision. EPSA provides the cloud analytics capability for anomaly detection, forecasting and utility-performance analysis.
That division matters when assessing the investment. Plant teams need dependable measurements and clear asset context. Analytics helps users identify abnormal patterns, compare performance with an established baseline and focus engineering time on exceptions with a credible financial impact.
How to reduce industrial energy costs with KPI mapping
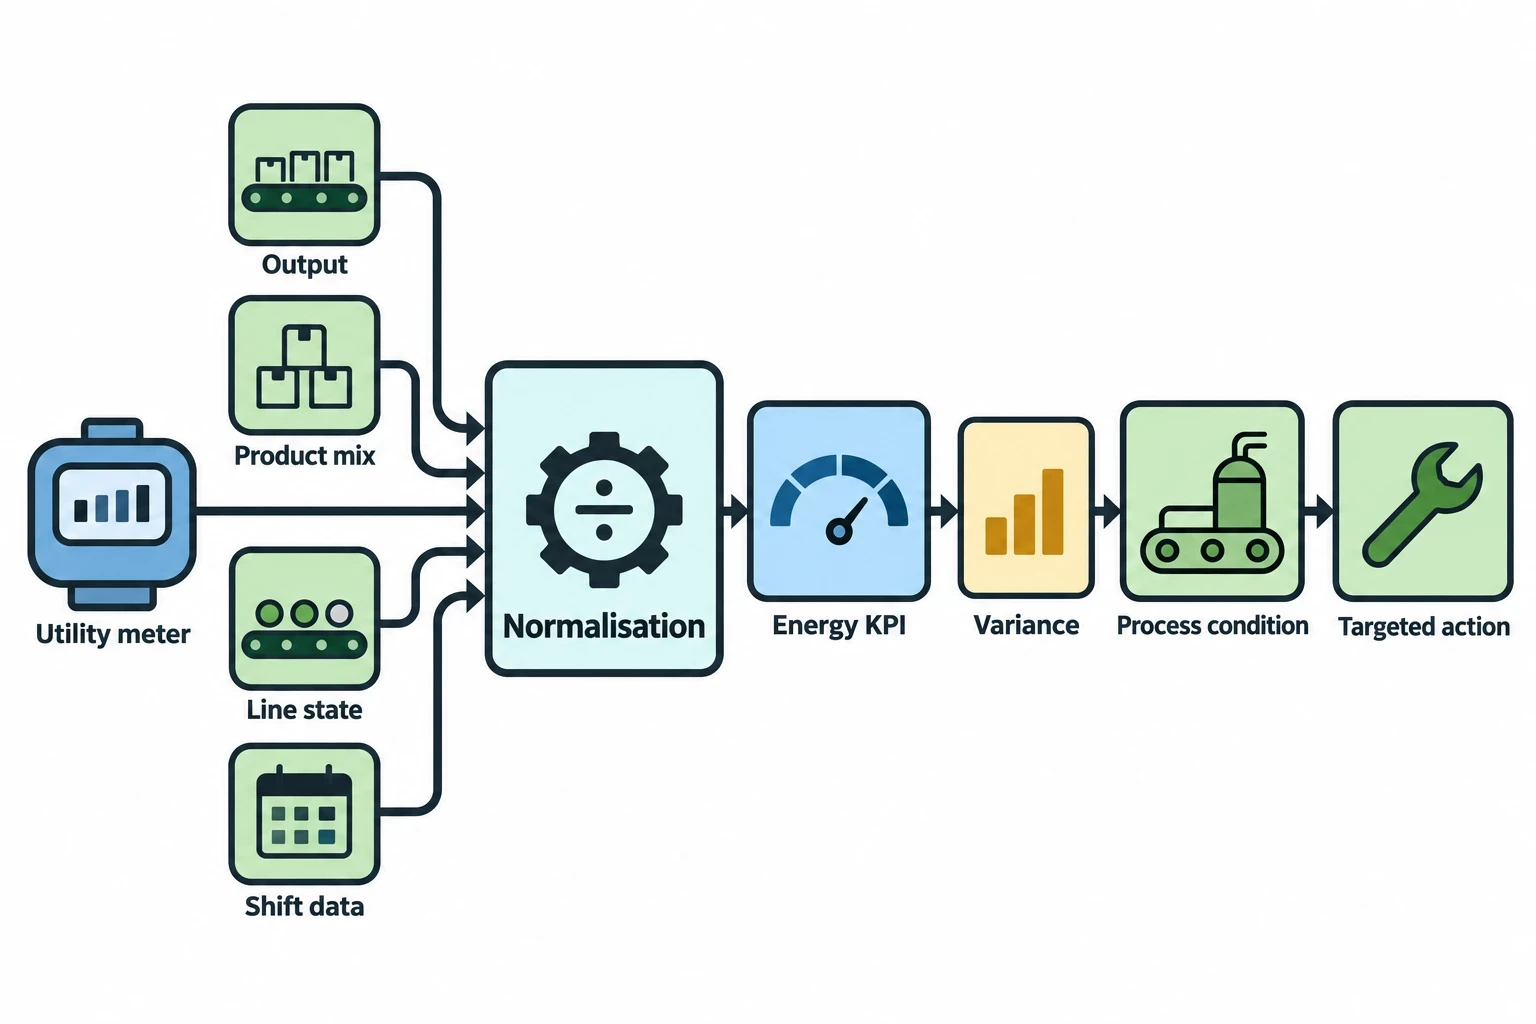
A utility reading becomes commercially useful only when it is placed beside production information. Batch records, output, shift patterns, recipe or product mix and line state help distinguish necessary consumption from avoidable waste.
Build the operating context around utility data
A practical KPI model combines the relevant meter with the factors that materially affect consumption:
- Output, such as tonnes, cases, batches or machine operating hours
- Product type or recipe where thermal demand varies
- Line state, including running, cleaning, changeover and idle time
- Shift and calendar information
- Quality, hygiene and environmental constraints
Consider a food manufacturer where steam use rises by 12% for comparable product runs. The cause may be a longer clean-in-place cycle, weaker condensate return, a heat-transfer issue or altered production scheduling. Linking the meter to batch and line-state data allows the team to isolate the change before deciding whether maintenance or process action is needed.
Heavy manufacturing follows the same logic. Electricity per tonne can rise because a furnace is underloaded, machines idle between jobs or an asset requires attention. The KPI directs the investigation to the process condition instead of encouraging broad site-wide reductions that risk output or quality.
Establish a baseline that reflects normal operation
A credible baseline accounts for the operational factors that explain energy demand. Comparing a winter month with a summer month, or a small batch with a full production run, can create false savings and false alarms.
The baseline should state:
- The meter boundary and utility measured.
- The production driver used for normalisation.
- The period used for comparison.
- Material operating variables, such as product mix or production hours.
- The owner responsible for reviewing a variance.
- The intervention date where an improvement project changes expected performance.
This makes the KPI useful to finance as well as engineering. A controller can see whether unit energy cost fell because of an operational improvement, a tariff change, lower output or a different product mix.
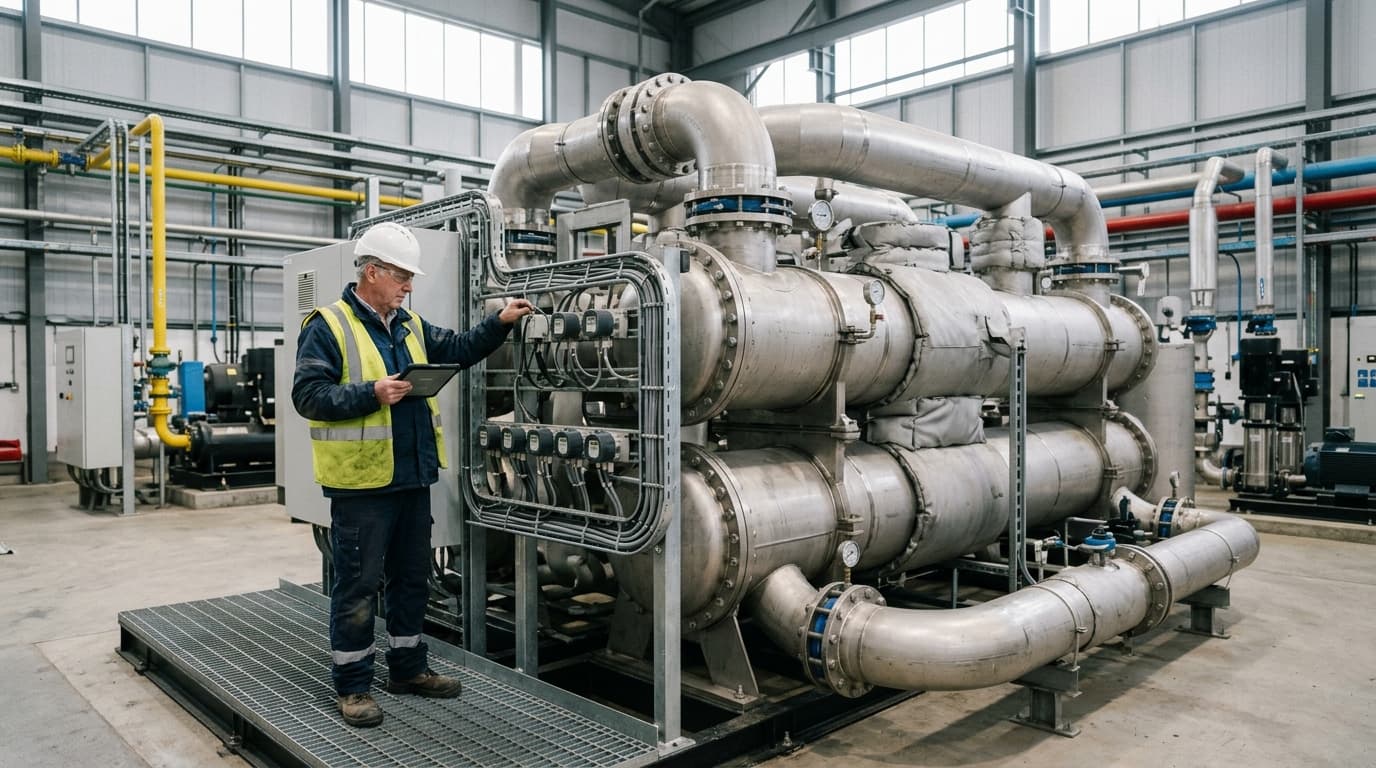
Track energy consumption, emissions, and process parameters with seamless PLC/SCADA integration via Modbus, OPC-UA, and MQTT protocols.
The cost-benefit case for industrial energy intelligence
A metering and analytics project should be assessed as an operational investment. The financial return comes from waste that the plant identifies and removes, not from data collection alone.
What a finance controller should require
A sound capital request ties each saving to measured evidence and a specific delivery mechanism.
| Business-case element | Evidence needed |
|---|---|
| Baseline spend | Utility invoices, tariff data and interval consumption |
| Opportunity size | Measured waste by asset, utility or operating condition |
| Saving mechanism | Specific action and expected operating change |
| Investment cost | Metering, installation, commissioning, integration and training |
| Recurring cost | Software, support, communications and maintenance |
| Savings verification | Agreed KPI, baseline, data source and review period |
| Delivery risk | Outage constraints, production requirements, access and data gaps |
This structure avoids percentage claims with no mechanism behind them. Each proposed saving should trace to a meter point, an observed condition, an owner and a defined action.
The early opportunities often involve operating practice rather than major asset replacement. Common examples include operator-led compressor scheduling, leak repair, pressure correction, boiler sequencing, shutdown routines, unnecessary standby load and abnormal water use. These projects can offer a shorter payback because they remove waste without waiting for a large capital programme.
Verify realised savings
A forecast supports investment approval, while verification establishes delivery. Teams should compare the relevant KPI before and after the intervention, while accounting for production volume, product mix, operating hours and other material changes. The record should also show the date of the intervention and any exceptional events, such as a shutdown or production transfer.
The High Value Manufacturing Catapult documented this approach at Alucast, an aluminium foundry in the West Midlands. Monitoring 17 machines helped the site evaluate shutdown periods rather than leaving equipment idle. The case study reported potential savings of 95,107 kWh and £78,225 over two years.
Savings evidence protects the business case after approval. It also provides an informed basis for the next project, whether that requires a validated control change, a maintenance programme or equipment replacement.
ISO 50001:2018 and ESOS Phase 4 strengthen the evidence trail
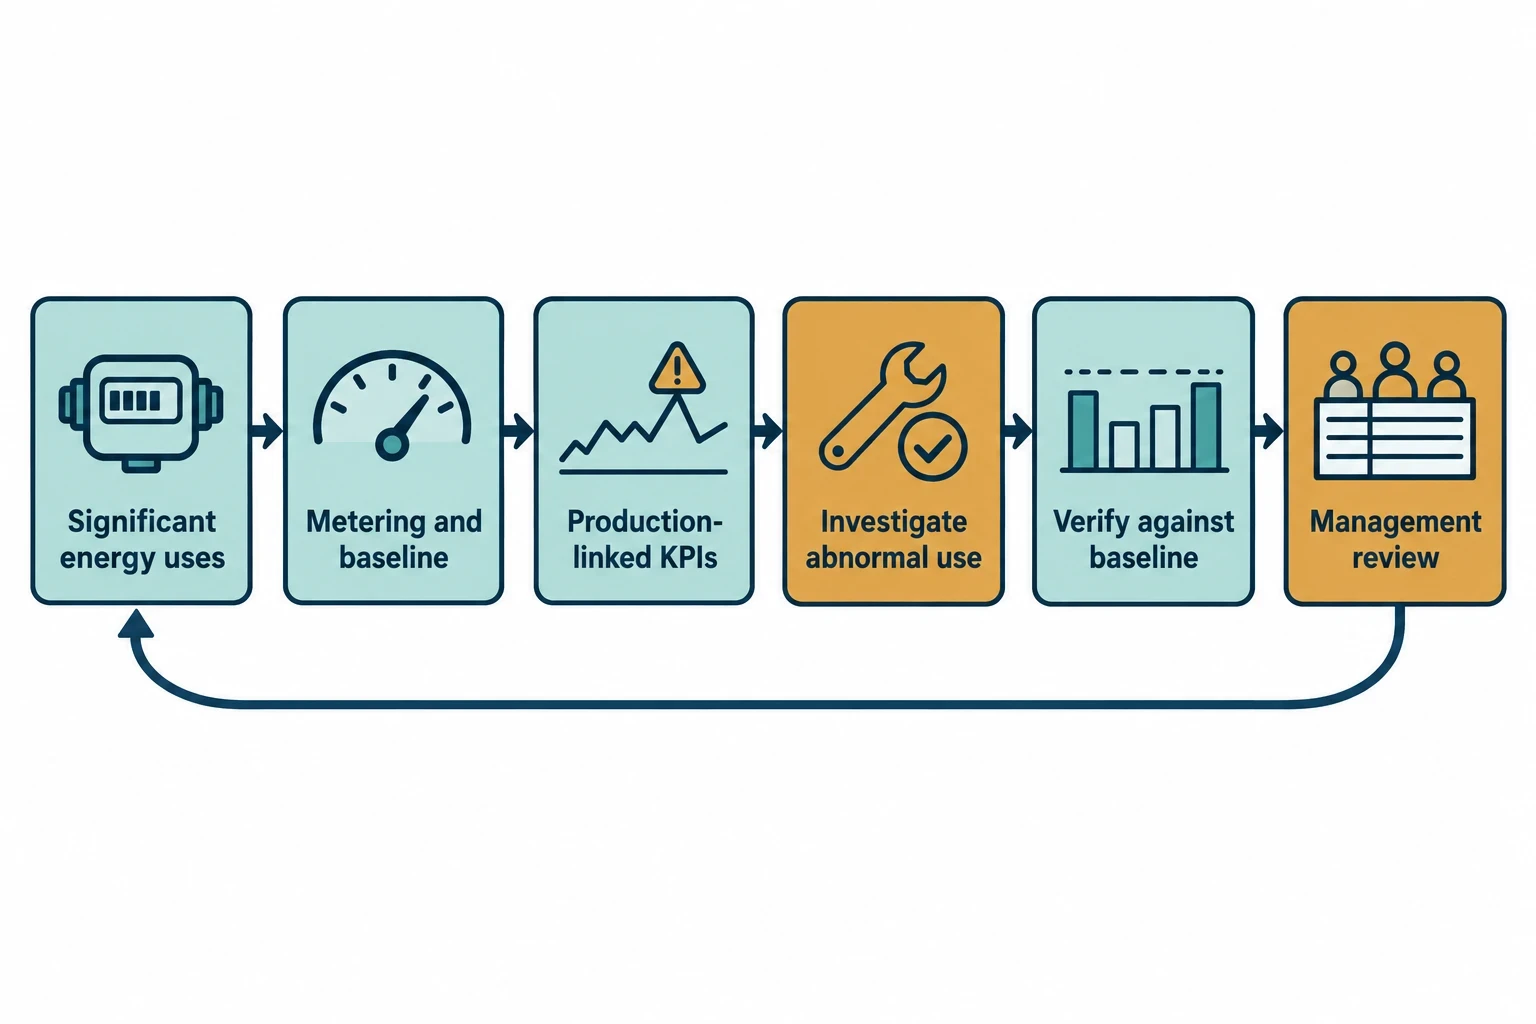
Energy intelligence supports compliance by making consumption patterns, KPIs and completed actions easier to review. It does not remove the need for an appropriate ESOS assessment route, competent oversight or board-level accountability.
ISO 50001:2018 provides a management framework
ISO 50001:2018 remains the current global standard for energy management systems. It establishes a systematic framework to improve energy performance through objectives, measurement, review and continual improvement.
For industrial facilities, the practical application is straightforward:
- Identify significant energy uses and the operational factors that drive them.
- Meter those uses sufficiently to establish reliable performance indicators.
- Set KPIs linked to output and process state.
- Investigate abnormal consumption and assign corrective action.
- Verify the result against the agreed baseline.
- Review performance and the action plan at management level.
This approach gives energy work a regular operating rhythm. Production teams explain output and constraints. Engineering teams investigate equipment and controls. Finance teams validate cost reductions and payback.
ESOS Phase 4 requires action-oriented reporting
ESOS applies to large UK undertakings and qualifying corporate groups. The Phase 4 qualification date is 31 December 2026 and the notification deadline is 5 December 2027.
Participants must identify significant energy consumption covering at least 95% of total energy consumption. They must also calculate energy-intensity ratios for buildings, transport, industrial processes and other relevant energy uses. Production-linked KPIs provide practical evidence for industrial-process intensity ratios because they relate utility consumption to a verifiable activity measure.
Phase 4 also requires organisations to report energy savings achieved during the compliance period, review action-plan measures that were not implemented and explain why. This makes metered evidence valuable beyond the audit itself. A documented KPI, action and verified result can support both operational cost control and ESOS reporting.
A practical deployment route for general industry sites
A strong deployment begins with scope discipline. The initial phase should focus on utilities and process areas with high spend, meaningful variation and a realistic route to intervention.
Start with the highest-value utility questions
The first survey should identify incoming supplies, major branches, high-load assets, shared services and available production data. Typical starting points include a compressor room, boiler house, refrigeration plant, utility-intensive cleaning operation or an energy-heavy production line.
Omni Vision is designed for a turnkey deployment of 8 to 16 weeks, depending on site scope and installation constraints. The programme covers the mapped utilities, followed by KPI configuration and operational review.
Meter ownership, units and alert accountability should be agreed during commissioning. A reading without those definitions cannot support a timely decision.
Turn alerts into accountable plant action
Anomaly detection creates value when the alert gives an engineer or operator enough context to act. Each priority alert should identify the utility, location, expected range, process context and escalation owner.
A practical operating routine includes a daily review of material exceptions, a weekly review of baseload and production-linked KPIs, and a monthly finance review of validated savings. That cadence helps teams sustain gains after changes in staffing, scheduling or product mix.
This article reflects the independent analysis and editorial opinion of EnerTherm Engineering. Product names, trademarks, and brands mentioned belong to their respective owners. EnerTherm Engineering is not affiliated with, endorsed by, or a licensee of any third-party software or product mentioned unless explicitly stated.

Technical Manager — EnerTherm Engineering
John Naranjo is Technical Manager at EnerTherm Engineering, bringing specialist expertise in chemical and environmental engineering. He recently led the implementation of Omni Vision, EnerTherm's real-time energy and utility monitoring platform. He holds an MSc in Environmental Engineering from the University of Huelva and a BSc in Chemical Engineering, with memberships in both the Energy Institute and IChemE.
