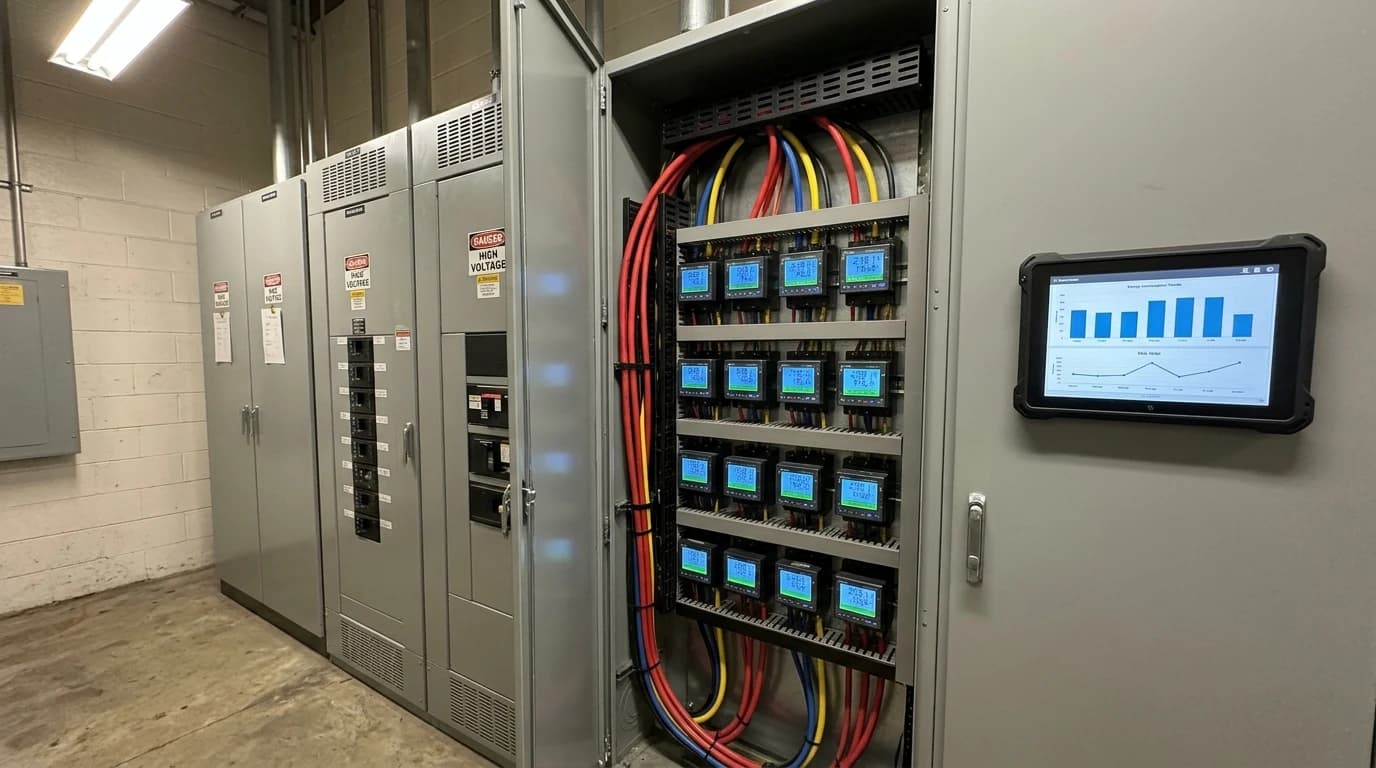
Why Normalised EnPIs Cut Factory Energy Costs by 15-25%
Using real-time Omni Vision data to normalise EnPIs and meet ISO 50001 requirements.
Industrial energy performance indicators (EnPIs) are quantitative measures or values designed to help industrial facilities evaluate, track, and compare their energy performance against established baselines. In industrial environments, relying on raw energy consumption data to assess operational efficiency represents a significant financial risk. If a manufacturing plant increases production output by 30 per cent while its gas and electricity consumption rises by only 10 per cent, raw data logs will record a net increase in energy usage. In a traditional monitoring framework, this raw spike would be flagged as a performance decline. In reality, the energy efficiency per unit of output has significantly improved, representing a highly successful operational cycle.
Without normalising these indicators against external and process-related variables, factory managers cannot distinguish genuine efficiency improvements from fluctuations caused by production volumes, weather conditions, or feedstock variations. Normalised metrics resolve this visibility gap, enabling energy engineers to identify systemic energy waste, eliminate operational drift, and achieve verified cost savings of 15 to 25 per cent with a typical platform return on investment (ROI) of under 12 months.
The Technical Framework of Industrial Energy Performance Indicators (EnPIs)
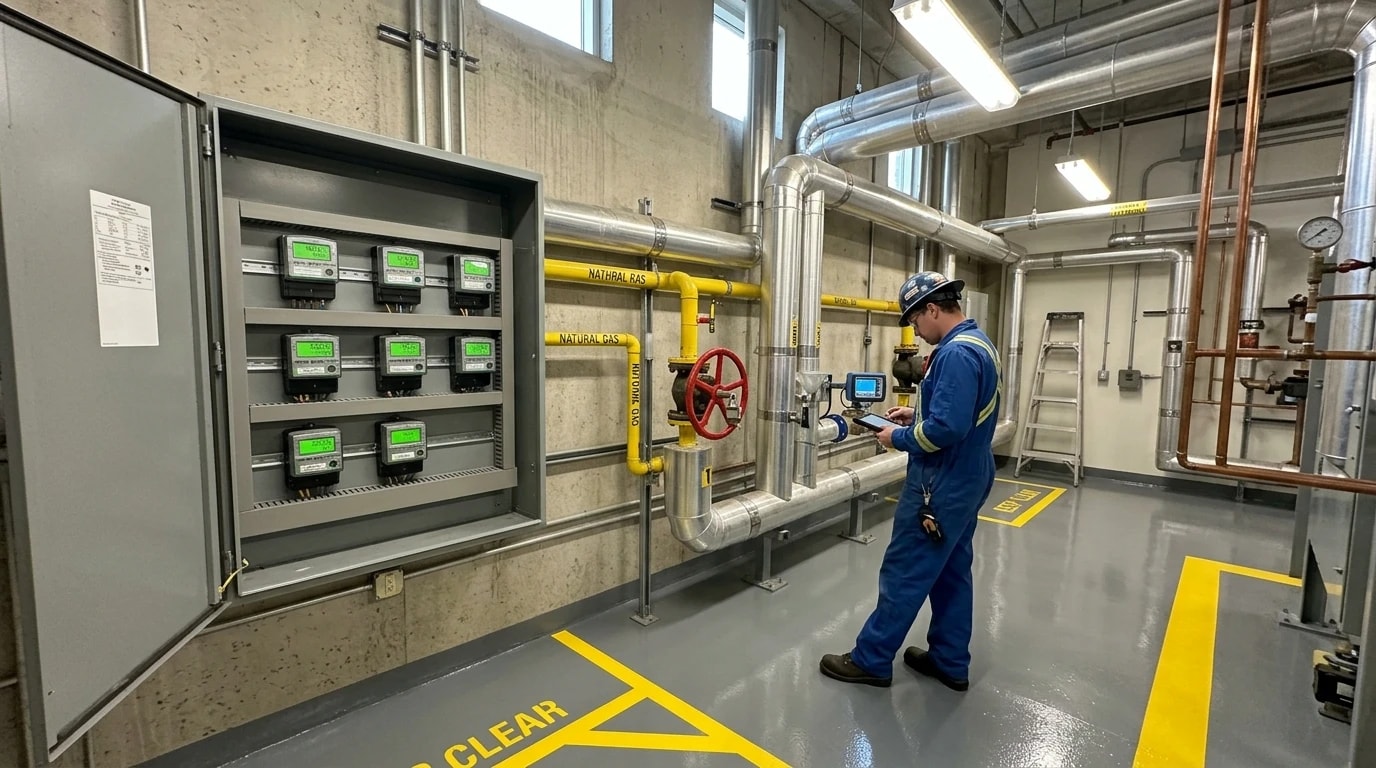
Evaluating factory performance requires a transition from raw utility tracking to structured, comparative metrics. This transition is governed by international standards that categorise how energy data must be contextualised to yield actionable operational insights.
Distinguishing Between Raw Consumption and Normalised Metrics
Raw consumption tracking measures absolute input, such as total kilowatt-hours (kWh) of electricity, cubic metres (m³) of natural gas, or tonnes of steam entering a facility. While absolute tracking is necessary for basic financial accounting and utility bill validation, it is incapable of measuring efficiency.
Normalised EnPIs represent the ratio between energy input and a corresponding physical driver. By factoring in variables like mass flow rate, ambient temperature, or process run times, normalised metrics isolate the thermal and electrical efficiency of the plant from external operational noise. For instance, tracking the electricity required to compress air (measured in kWh/m³ at a specific delivery pressure) provides a direct, unvarnished measure of compressor efficiency, regardless of how much compressed air the plant consumed during that month.
Why Absolute Energy Consumption Figures Mislead Operations Teams
Relying on raw consumption figures often causes operations teams to misdiagnose equipment health and process performance. For example, during seasonal transitions, a facility's cooling tower energy consumption will fluctuate significantly due to changes in ambient wet-bulb temperature. An absolute increase in cooling-loop electricity consumption during July does not necessarily mean the chillers are operating inefficiently. Conversely, a reduction in winter consumption does not guarantee that the refrigeration cycle is running optimally.
Similarly, in multi-product manufacturing plants, processing a highly viscous chemical formulation requires far more agitator motor power and heat input than processing a low-viscosity fluid. If the plant tracks only total energy consumed, high-viscosity production runs will falsely appear as inefficient operations, while low-viscosity runs will mask latent system degradation, such as fouled heat exchangers or worn motor bearings.
| Metric Type | Absolute Energy Tracking | Normalised EnPI Tracking (ISO 50006:2023) |
|---|---|---|
| Primary Data Source | Monthly utility invoices or totalised kWh meters | Real-time utility meters synced with PLC process variables |
| Weather & Ambient Influence | Ignored, causing seasonal fluctuations in reported efficiency | Corrected via regression models using local heating or cooling degree days |
| Production Variation | Unaccounted for, penalising low-volume high-efficiency runs | Standardised to production throughput (e.g., kWh per batch, gas per tonne) |
| Actionable Insight | Retroactive detection of spikes weeks after the event | Immediate alert of process drift or equipment degradation |
| Regulatory Status | Basic compliance, insufficient for proving continuous improvement | Fully compliant with ISO 50001:2018 and ESOS Phase 4 requirements |

Omni Vision delivers turnkey utility metering, CO2 tracking, and AI-powered production KPI intelligence — giving you real-time dashboards and actionable insights across your entire facility.
Normalising Energy Metrics Under ISO 50006:2023
To construct mathematically sound performance indicators, industrial organisations look to standard frameworks. The current international standard governing this methodology is ISO 50006:2023, which provides technical guidance on how to establish, use, and maintain energy performance indicators (EnPIs) and energy baselines (EnBs) to ensure energy performance is measured effectively.
Differentiating Relevant Variables from Static Factors
A central requirement of ISO 50006:2023 is the precise categorisation of factors that influence energy consumption. The standard divides these into two main classes:
- Relevant Variables: These are dynamic, routine factors that change frequently and have a direct, measurable impact on energy use. Examples include production throughput (measured in tonnes, litres, or units), raw material specifications (such as moisture content or density), ambient outdoor temperature, and humidity.
- Static Factors: These are physical or operational characteristics that do not change routinely under normal operating conditions. Examples include the physical floor area of a facility, the design capacity of a boiler, the number of shifts operated per week, or the thermal insulation properties of a building envelope.
If a static factor changes, such as a factory expansion that doubles the heated floor area, the energy baseline must be adjusted or reset to maintain the statistical integrity of the EnPI.
Establishing Representative Energy Baselines (EnBs)
An energy baseline (EnB) represents a historical reference period against which current energy performance is compared. According to ISO 50006:2023, a baseline period must be long enough to capture a full cycle of relevant variables. For most manufacturing operations, this requires a consecutive 12-month baseline to account for seasonal heating and cooling cycles.
If the baseline data is collected during an abnormal production period, such as a prolonged maintenance shutdown or a period of severe supply-chain disruption, the resulting model will fail to reflect normal operating conditions. The baseline must be mathematically validated to ensure that the relationship between energy consumption and relevant variables is statistically significant.
The Mathematical Model for Normalised Expected Energy
To normalise energy indicators when multiple relevant variables are at play, process engineers typically construct multivariable linear or non-linear regression models. The most common regression model for expected energy consumption is formulated as follows:
Eexpected=Ebase+(β1⋅V1)+(β2⋅V2)Where:
- Eexpected is the expected energy consumption calculated for a specific operating period (expressed in kWh, MJ, or equivalent units).
- Ebase is the baseload energy consumption, representing the fixed energy load of the facility or system that remains active regardless of whether production is running (such as background lighting, control systems, and base-level building thermal maintenance).
- β1 and β2 are the regression coefficients, which represent the rate of change in energy consumption per unit of change in their respective variables.
- V1 is the primary routine relevant variable, such as total production mass throughput (expressed in tonnes).
- $$V_2$ is the secondary routine relevant variable, such as heating degree days (HDD), which accounts for ambient outdoor temperature changes.
By comparing the actual measured energy consumption (Eactual) against this calculated Eexpected, energy engineers can determine the exact energy performance improvement or degradation, completely independent of production volume swings or seasonal weather anomalies.
Regulatory Alignment with ESOS Phase 4 and SECR in the UK
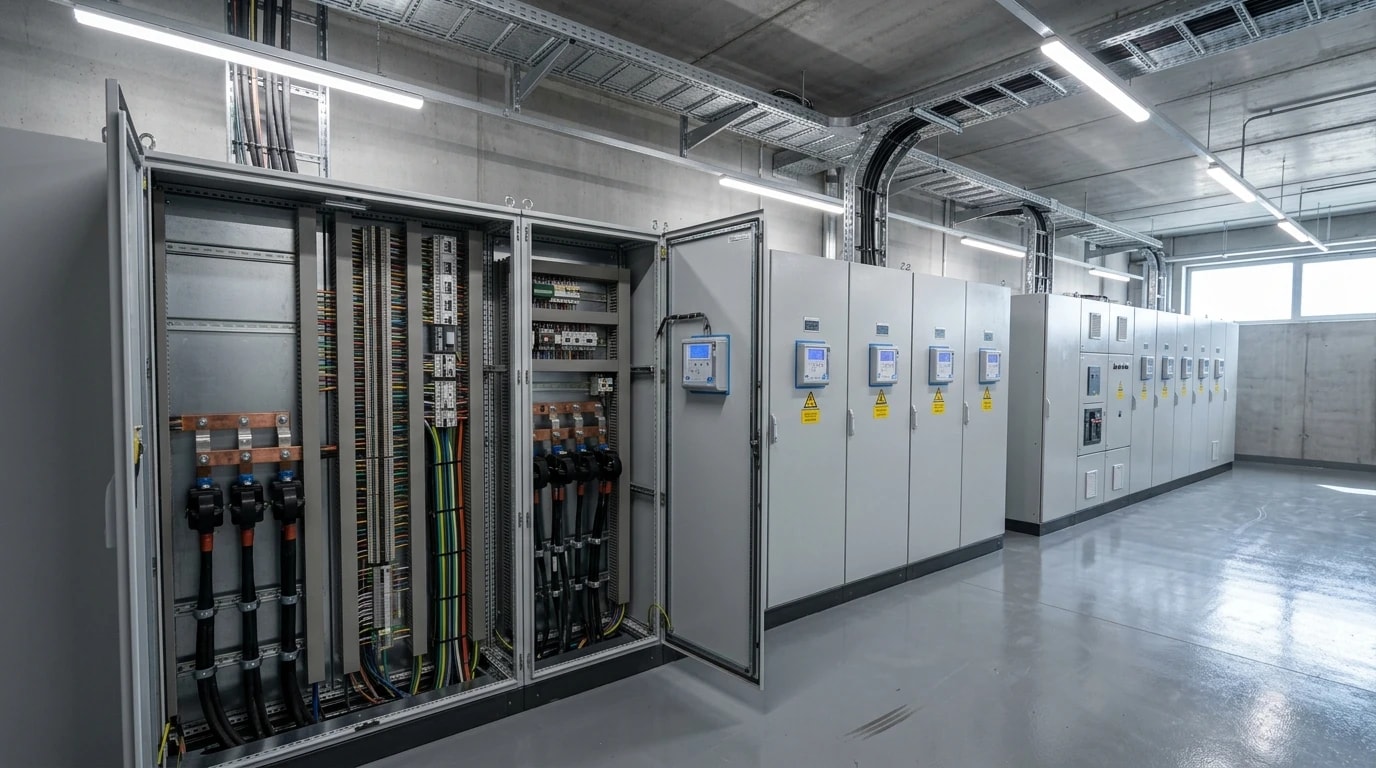
Implementing normalised EnPIs is no longer just a voluntary operational best practice; it is increasingly becoming a mandatory component of compliance within the UK and European regulatory framework.
Meeting SECR Mandated Intensity Ratios
Under the UK Government's Streamlined Energy and Carbon Reporting (SECR) regulations, large unquoted companies, limited liability partnerships (LLPs), and quoted companies are legally required to disclose their annual energy use and greenhouse gas (GHG) emissions. A fundamental requirement of SECR is the inclusion of at least one intensity ratio in the annual directors' report.
An intensity ratio is a normalised metric that expresses greenhouse gas emissions relative to a specific business activity metric, such as tonnes of CO₂e per tonne of product produced, or tonnes of CO₂e per square metre of factory floor area. Recent UK government guidance updates emphasise that these intensity ratios must be robust, repeatable, and directly aligned with the facility's significant energy uses (SEUs). Using raw financial turnover as the sole normalisation factor (e.g., CO₂e per pound sterling of revenue) is discouraged for manufacturing operations, as market price fluctuations can artificially distort the reported carbon intensity, masking underlying energy inefficiencies.
Proving Continuous Improvement under ISO 50001:2018
The ISO 50001:2018 standard, which outlines requirements for establishing, implementing, maintaining, and improving an Energy Management System (EnMS), places a mandatory obligation on certified organisations to demonstrate continuous "energy performance improvement". Unlike older standard iterations, which allowed organisations to point to the mere execution of energy efficiency projects, ISO 50001:2018 requires quantitative, data-driven proof of efficiency gains across the defined system boundaries.
For large organisations in the UK, maintaining an active ISO 50001 certification that covers 100 per cent of their energy consumption serves as a direct compliance route for the Energy Savings Opportunity Scheme (ESOS), bypassing the need for separate quadrennial audits. Under ESOS Phase 4 (which operates on a compliance cycle running to December 2027, with the key qualification assessment date on 31 December 2026), the Environment Agency has intensified scrutiny on the quality of energy data. Organisations that do not use the ISO 50001 route must conduct comprehensive audits that calculate and report clear energy intensity metrics across all key operational areas.
Proving continuous year-on-year efficiency gains for ESOS action plans and progress updates is virtually impossible without granular, real-time data. Thermal and electrical engineers require high-frequency metering to construct the normalised EnPIs needed to isolate actual performance gains from background operational shifts.
Mapping Process Efficiency and Significant Energy Uses (SEUs)
To implement normalised EnPIs that deliver real-world savings, engineers must first perform an energy review to identify Significant Energy Uses (SEUs). These are the systems, processes, or facilities that consume a substantial portion of the plant's total energy, or those that present the greatest opportunities for efficiency optimisation.
Defining and Isolating Significant Energy Uses
In a typical manufacturing facility, a small number of process assets consume the vast majority of utilities. An energy review identifies these key systems, such as industrial steam boilers, large refrigeration compressors, thermal oxidisers, or spray dryers. Once identified, these systems are isolated using physical metering or virtual sub-metering so that individual EnPIs can be calculated for each specific asset.
Attempting to normalise a whole factory's energy consumption using a single variable like total production output often fails. This is because different manufacturing areas respond to different operational drivers. A packaging line's electricity consumption may scale linearly with unit count, whereas a chemical reactor's gas consumption is driven by chemical batch hold times and thermodynamic heating requirements.
Tracking Six Core Utility Streams
Comprehensive process efficiency mapping requires continuous, high-frequency monitoring of six core utility streams:
- Electricity: Active and reactive power consumption, power factor, and peak demand across key distribution boards and large motors.
- Gas: Mass flow rate of natural gas or liquefied petroleum gas (LPG) feeding boilers, ovens, and direct-fired burners.
- Water: Volumetric flow rates of mains water, demineralised water, and cooling-loop makeup water.
- Steam: Mass flow, temperature, and pressure of saturated or superheated steam distributed to heat exchangers and jacketed vessels.
- Compressed Air: Volumetric flow rate, delivery pressure, and dew point of compressed air lines.
- Oil: Flow and temperature of thermal oils used in high-temperature transfer systems.
By tracking these streams at the equipment and department levels, operators can construct detailed, localised energy balances.
Production-Linked Metrics Across Industrial Sectors
The variables used to normalise EnPIs must reflect the physical realities of the specific industrial sector:
- Chemical Manufacturing: Process engineers map energy consumption against chemical batch characteristics (such as viscosity, exothermic reaction thresholds, and hold times). EnPIs are often expressed as kWh of electricity per tonne of polymer, or megajoules (MJ) of steam per batch cycle.
- Pharmaceutical Manufacturing: Facilities must maintain strict environmental envelopes. Because of strict Good Manufacturing Practice (GMP) standards, cleanroom heating, ventilation, and air conditioning (HVAC) systems must run continuously. Here, EnPIs are normalised against outdoor air temperature, relative humidity, and room pressure differentials, and are typically expressed as energy consumed per cubic metre of conditioned air volume per hour (kWh/m3/h).
- Food & Beverage Processing: Energy consumption is closely linked to clean-in-place (CIP) sanitation cycles, pasteurisation thermal profiles, and packaging rates. Typical EnPIs include kilograms of steam per hectolitre of beverage brewed, or electrical kWh per raw tonne of product pasteurised.

Track energy consumption, emissions, and process parameters with seamless PLC/SCADA integration via Modbus, OPC-UA, and MQTT protocols.
Cloud-Based Data Architectures for Real-Time EnPI Calculation
Transitioning from manual spreadsheet tracking to automated, normalised performance evaluation requires a robust, secure, and modern digital data architecture.
Secure Read-Only Edge Connectivity
To collect high-frequency data from diverse factory assets without compromising operational safety, edge devices interface directly with existing plant-floor control systems. EnerTherm Engineering's Omni Vision Energy Intelligence Platform achieves this by connecting to programmable logic controllers (PLCs), distributed control systems (DCS), and smart power meters.
To maintain operational integrity and meet strict safety standards (including GMP and HACCP), the platform employs a non-invasive, read-only connectivity architecture. Using industry-standard protocols such as Modbus, OPC-UA, BACnet, and MQTT, the hardware extracts raw utility and process variables. The data is then pushed to the cloud using a secure, encrypted, one-way outbound data flow. Because the edge device has zero-write access to the plant's control network, it is physically impossible for the cloud system to interfere with, reprogramme, or disrupt active manufacturing operations.
AI-Driven Anomaly Detection and Predictive Modelling
Once the raw utility streams and process variables are securely transmitted to the cloud, the data is processed by EPSA's cloud-based AI analytics engine. This platform does not rely on static, historical spreadsheets. Instead, it applies machine learning algorithms to continuously evaluate the complex, non-linear relationships between production schedules, ambient weather conditions, and energy consumption.
The AI engine automatically builds dynamic operational baselines. By comparing real-time consumption against the expected normalised energy usage (Eexpected), the system can instantly identify anomalies. If a steam valve leaks, a compressor begins to short-cycle, or a heat exchanger exhibits rapid fouling, the platform detects the deviation immediately. Operations teams receive automated alerts containing precise diagnostic information, allowing them to intervene before the drift results in significant financial losses.
Turnkey Deployment Timelines and ROI
Industrial facilities often hesitate to adopt advanced energy management systems due to fears of protracted IT integration projects and high capital costs. The Omni Vision platform addresses this concern through a standardised, turnkey deployment model that takes 8 to 16 weeks to fully implement.
Because the platform integrates with existing sensors and PLCs, it minimises the need for expensive new instrumentation or plant downtime. By rapidly exposing hidden operational waste, thermal anomalies, and peak demand issues, the platform secures 15 to 25 per cent energy cost reductions within the established sub-12-month payback window.
How Normalised EnPIs Drive 15-25% Cost Reductions
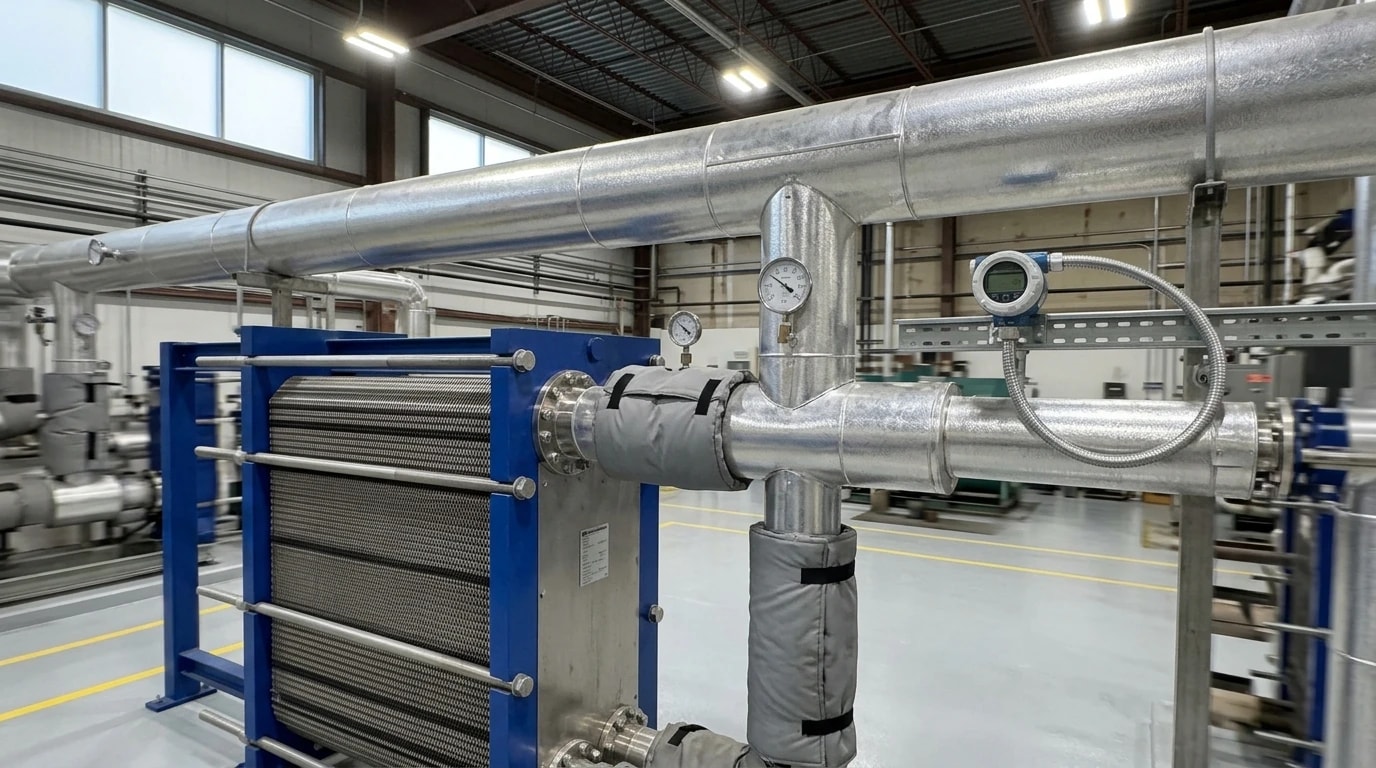
The primary mechanism of action for normalised EnPIs is their ability to make hidden energy waste visible. By stripping away production and weather variations, energy engineers can pinpoint exact operational issues that were previously obscured.
Isolating Operational Drift and Process Anomalies
Operational drift occurs when equipment performance degrades slowly over time. In a standard factory tracking absolute consumption, a 5 per cent drop in heat exchanger efficiency or a slow wear-down of an axial fan's impellers is virtually impossible to see amidst daily production volume changes.
Normalised EnPIs isolate these trends. For example, if the normalised thermal energy consumption for a drying process shows a steady upward trend over three weeks (such as rising from 1.2 to 1.35 MJ of heat per kilogram of water evaporated, under identical feed-moisture conditions), the system identifies a drift. This allows maintenance teams to schedule a targeted descaling or filter replacement during a planned shutdown, preventing a catastrophic spike in energy costs or unplanned production stops.
Optimising Peak Demand and Startup Protocols
A major contributor to high electricity bills is capacity penalties and banded network charges under the UK's Targeted Charging Review (TCR). Rather than trying to predict peak half-hourly grid periods to avoid variable residual tariffs—which have now been largely replaced by fixed daily charges based on Agreed Supply Capacity (ASC)—factories must actively manage their maximum demand peaks. By integrating real-time process data with predictive AI forecasting, the platform identifies the facility’s actual peak capacity requirements. This enables energy managers to safely reduce their registered ASC with the Distribution Network Operator (DNO) to drop into a lower, cheaper tariff band without the risk of drawing excess power and triggering expensive capacity exceedance penalties.
Normalised indicators reveal the high energy cost of startup and shutdown cycles. Many manufacturing lines consume substantial baseline energy (up to 40 per cent of peak load) when idling or during heating phases before raw materials are introduced. By tracking normalised EnPIs during these transition states, the platform highlights unproductive energy use, allowing operations teams to implement optimised startup sequences during validated change windows. This ensures that auxiliary systems, such as thermal oil heaters or high-pressure fans, are only activated at the precise moment they are needed, eliminating hours of unproductive, high-tariff energy waste.
Data-Driven Capital Investment Decisions
When deciding which energy efficiency projects to fund, sustainability managers often struggle with conflicting vendor performance claims. If a factory replaces an old boiler with a high-efficiency condensing model, but production volume subsequently increases by 40 per cent, absolute gas bills will rise. This makes it difficult to justify the capital expenditure to financial directors.
Using normalised EnPIs under ISO 50006:2023 provides a scientifically verifiable way to track savings. By normalising the post-installation energy data against the validated baseline model, engineers can prove the exact savings achieved by the new boiler. This clear measurement and verification (M&V) process builds the internal business case for future decarbonisation projects, shifting the organisation from subjective guesswork to precise, data-driven financial decision-making.
Establishing a Normalisation Strategy: A Step-by-Step Implementation Guide
Transitioning an industrial facility to a normalised EnPI framework requires a systematic, phased approach to ensure data accuracy and long-term model validity.
Step 1: Boundary Definition and Variable Identification
First, define the physical and operational boundaries of the systems to be monitored. Process engineers construct "energy fence diagrams" to map all incoming and outgoing utility flows.
Once the boundaries are established, the team identifies all routine relevant variables and static factors that could affect energy consumption. This is done by reviewing historical production logs, shift schedules, and local meteorological data.
Step 2: Continuous Data Acquisition
Manual meter reading is insufficient for constructing reliable normalised models. Factories must integrate automatic data collection systems. This step involves installing sub-meters on high-consumption assets and establishing secure, read-only edge connections to PLC networks.
By capturing utility and process data at 1-minute to 15-minute intervals, the system builds the dense datasets required for accurate statistical modelling.
Step 3: Constructing and Validating the Regression Model
Using the collected data, statistical regression analysis is performed to determine the correlation between energy consumption and the identified relevant variables. The resulting mathematical model calculates the expected energy consumption.
To validate the model, engineers check the coefficient of determination (R2). An R2 value close to 1.0 (typically ≥0.75 for industrial environments) indicates that the selected variables explain the vast majority of the variations in energy consumption, confirming the model's statistical validity.
Step 4: Maintaining and Adjusting Baselines for Continuous Savings
Once validated, the normalised model runs continuously in the cloud, comparing actual energy consumption to the expected baseline in real time.
If a static factor changes, such as a major equipment upgrade, an alteration in raw material feedstock, or a change in cleanroom classification, the energy baseline must be updated or reset to maintain accuracy. This continuous loop of measurement, verification, and adjustment ensures that the factory's energy saving activities remain highly accurate, fully compliant with international standards, and optimised for long-term operational cost reduction.
This article reflects the independent analysis and editorial opinion of EnerTherm Engineering. Product names, trademarks, and brands mentioned belong to their respective owners. EnerTherm Engineering is not affiliated with, endorsed by, or a licensee of any third-party software or product mentioned unless explicitly stated.

Technical Manager — EnerTherm Engineering
John Naranjo is Technical Manager at EnerTherm Engineering, bringing specialist expertise in chemical and environmental engineering. He recently led the implementation of Omni Vision, EnerTherm's real-time energy and utility monitoring platform. He holds an MSc in Environmental Engineering from the University of Huelva and a BSc in Chemical Engineering, with memberships in both the Energy Institute and IChemE.
