Minimum Night Flow Detects Industrial Water Leaks
AI-driven flow analysis flags out-of-hours anomalies for ISO 46001 water audits.
Minimum night flow is the lowest sustained water flow measured within a defined industrial meter boundary during a period of minimal legitimate demand. It helps identify potential leakage and uncontrolled consumption. For a factory with a borehole or other abstraction source, unexplained overnight demand can also make it harder to manage water use against internal targets and Environment Agency licence conditions.
Industrial water-leak detection starts with a practical question: what should the meter show when production demand is at its lowest?
The answer differs between sites. A food factory may run cleaning cycles at night. A pharmaceutical facility may maintain purified-water circulation. A chemical plant may require cooling water, safety equipment or treatment-plant operation around the clock. These loads are legitimate, measurable and often predictable. A persistent flow above them requires investigation.
Minimum Night Flow, commonly shortened to MNF, turns the plant’s lowest-demand period into a recurring test of the water network. It will not pinpoint a failed valve or buried pipe on its own. It can show where and when to start looking, often before a loss becomes visible, disrupts production or appears on a monthly invoice.
Why industrial water leaks evade routine reporting
Monthly billing data measures water after it has been used or lost. It may reveal a rising total, but it rarely identifies when the loss started, the responsible system or the operating conditions behind it.
Industrial demand also masks leakage. A rise in daily use may result from higher throughput, product changeovers, hot weather, washdown, cooling demand or a genuine fault. Looking only at a 24-hour total can leave a leak hidden within a legitimate process load.
The quiet period exposes residual demand
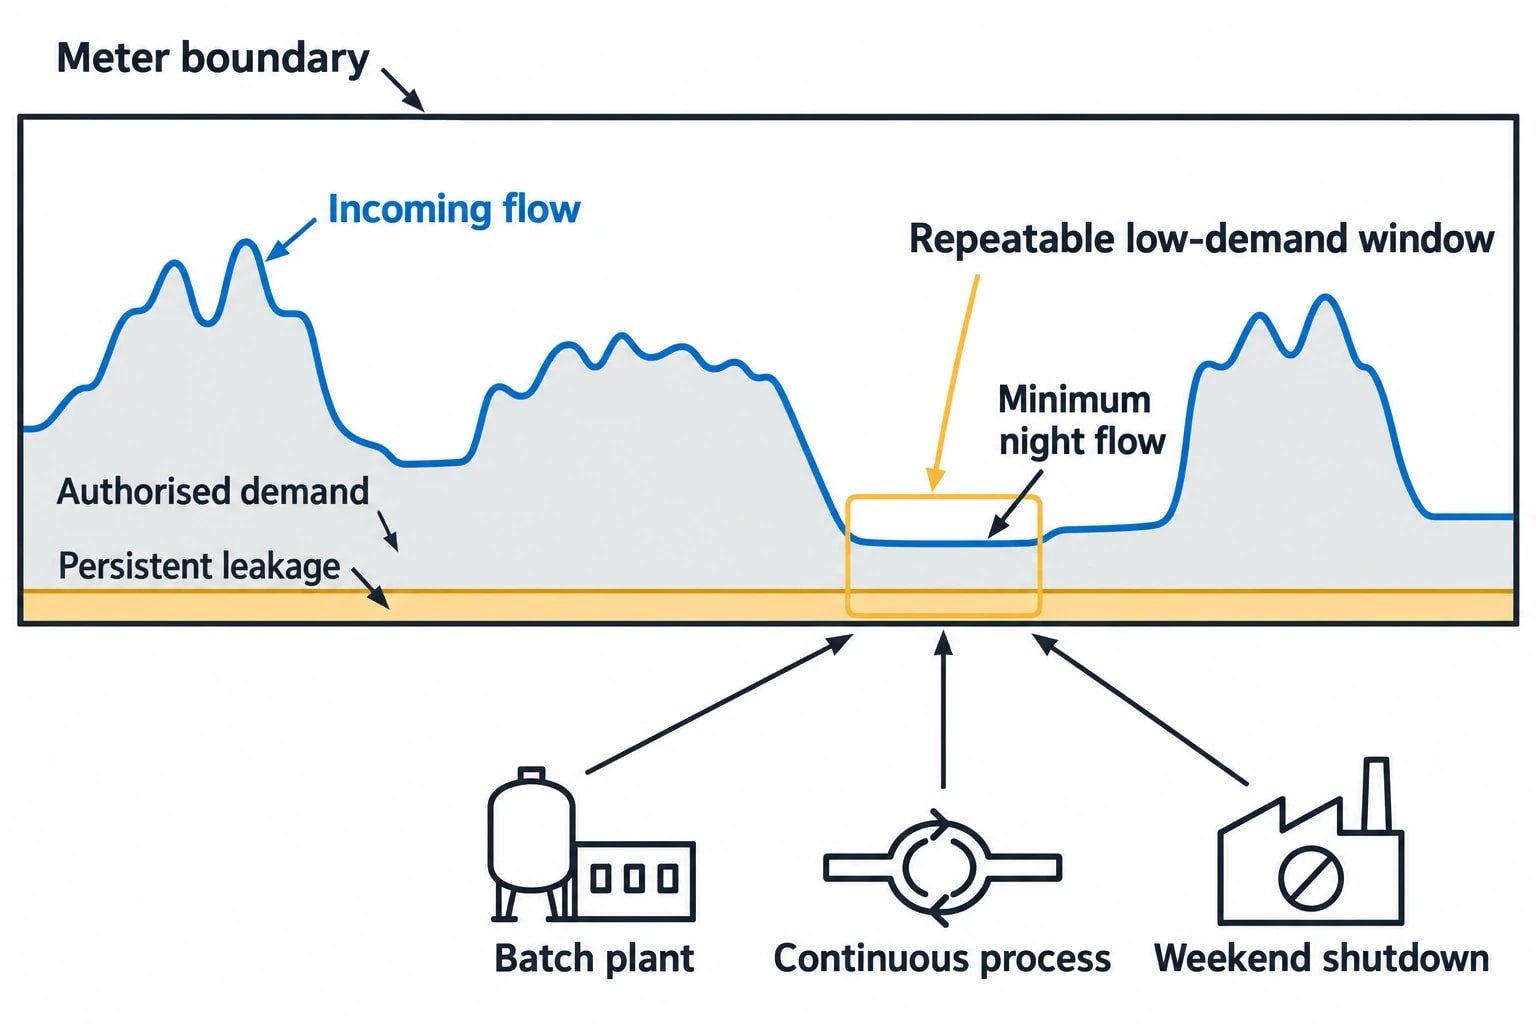
MNF is established in water-distribution leakage management because authorised use often falls during the early hours, making leakage a larger proportion of total incoming flow.
A production site needs a more careful interpretation. The relevant window is not automatically 02:00 to 04:00. It is the period in which a defined meter boundary has the lowest stable, repeatable authorised demand.
For a batch plant, that may be the gap between production and cleaning. For a continuous process, it may be a recurring low-load operating state. For a site that shuts down at weekends, the most useful comparison may be a defined interval during a standard weekend shutdown.
This distinction prevents a normal cooling load or clean-in-place cycle from being misclassified as a leak.
Water losses create costs beyond supply charges
A leaking pipe, stuck solenoid valve or overflowing tank can increase more than the incoming-water bill. The full impact can include:
- Energy used to pump, heat, soften, cool or treat water.
- Sewerage and trade-effluent charges where lost water reaches drainage.
- Corrosion, saturated insulation and structural damage.
- Slip risks and water ingress near electrical equipment.
- Product-quality or hygiene exposure in controlled areas.
- Unplanned maintenance and production disruption.
- Higher abstraction volumes where the site uses its own source.
Water UK has highlighted the scale of non-household demand in England and Wales, reporting that it accounts for 20% of water put into supply. For industrial operators, reducing avoidable demand supports site operating costs and wider water resilience.
Omni Vision delivers turnkey utility metering, CO2 tracking, and AI-powered production KPI intelligence — giving you real-time dashboards and actionable insights across your entire facility.
How Minimum Night Flow analysis works
Minimum Night Flow analysis begins with a closed, clearly defined meter boundary. That boundary may be an incoming main, utilities block, production department, cooling system or process line.
The method is based on the established MNF water balance. During the selected low-demand window, incoming flow comprises authorised night use, any measured transfer across the boundary and water loss. Engineers estimate or directly measure authorised consumption, account for transfers, then investigate the remaining residual flow.
This is an estimate of suspected loss, not proof that every residual litre is leakage. Its confidence depends on how well the site understands night operation.
Document legitimate night use before setting an alert
A credible baseline lists the assets that normally consume water during the selected period. Typical examples include:
- Boiler make-up and controlled blowdown.
- Cooling-tower make-up and bleed-off.
- Reverse-osmosis regeneration and filter backwash.
- Water-treatment plant cleaning.
- Automatic clean-in-place sequences.
- Tank level control and top-up valves.
- Welfare facilities and security operations.
- Scheduled washdown.
- Fire-system testing.
Each load should be assigned to a meter, operating schedule or confirmed volume where possible. A broad allowance based on assumptions will make the leakage signal less reliable.
Continuous users deserve particular attention. In water-network MNF practice, a significant and variable non-domestic consumer should be metered and its actual use subtracted from the night-flow assessment. The same principle applies to industrial utility loads. A cooling tower with variable make-up is a measured demand, not a fixed adjustment.
Use sustained values rather than one low reading
A single low meter sample can be distorted by pressure changes, valve movement, communication gaps or meter resolution. MNF should therefore be derived from a sustained interval, such as a rolling 15-minute average, rather than the lowest instantaneous reading.
The selected interval should reflect the process and the meter’s data quality. Stable systems may support shorter intervals. Batch facilities often need a longer window that excludes transfers between batches. Once the method is set, teams should apply it consistently to comparable operating states.
Compare matching operating conditions
A valid MNF baseline compares similar nights. The following events should be tagged in the data rather than folded into normal performance:
| Operating condition | Effect on minimum night flow | Treatment |
|---|---|---|
| Planned cleaning | Authorised high water demand | Exclude from the standard baseline or create a cleaning-state baseline |
| Reduced-rate production | Alters utility demand | Compare only with equivalent production states |
| Water-treatment regeneration | Creates concentrated demand | Identify the cycle and meter it where possible |
| Maintenance shutdown | May isolate normal users | Treat as a separate operating mode |
| Extreme weather | Can affect cooling demand | Analyse with temperature and cooling-system status |
| Meter intervention | Can create missing or unreliable readings | Mark data invalid until verification is complete |
This operating context separates industrial water-leak detection from a simple overnight threshold alarm.
Flow metering determines what an investigation can prove
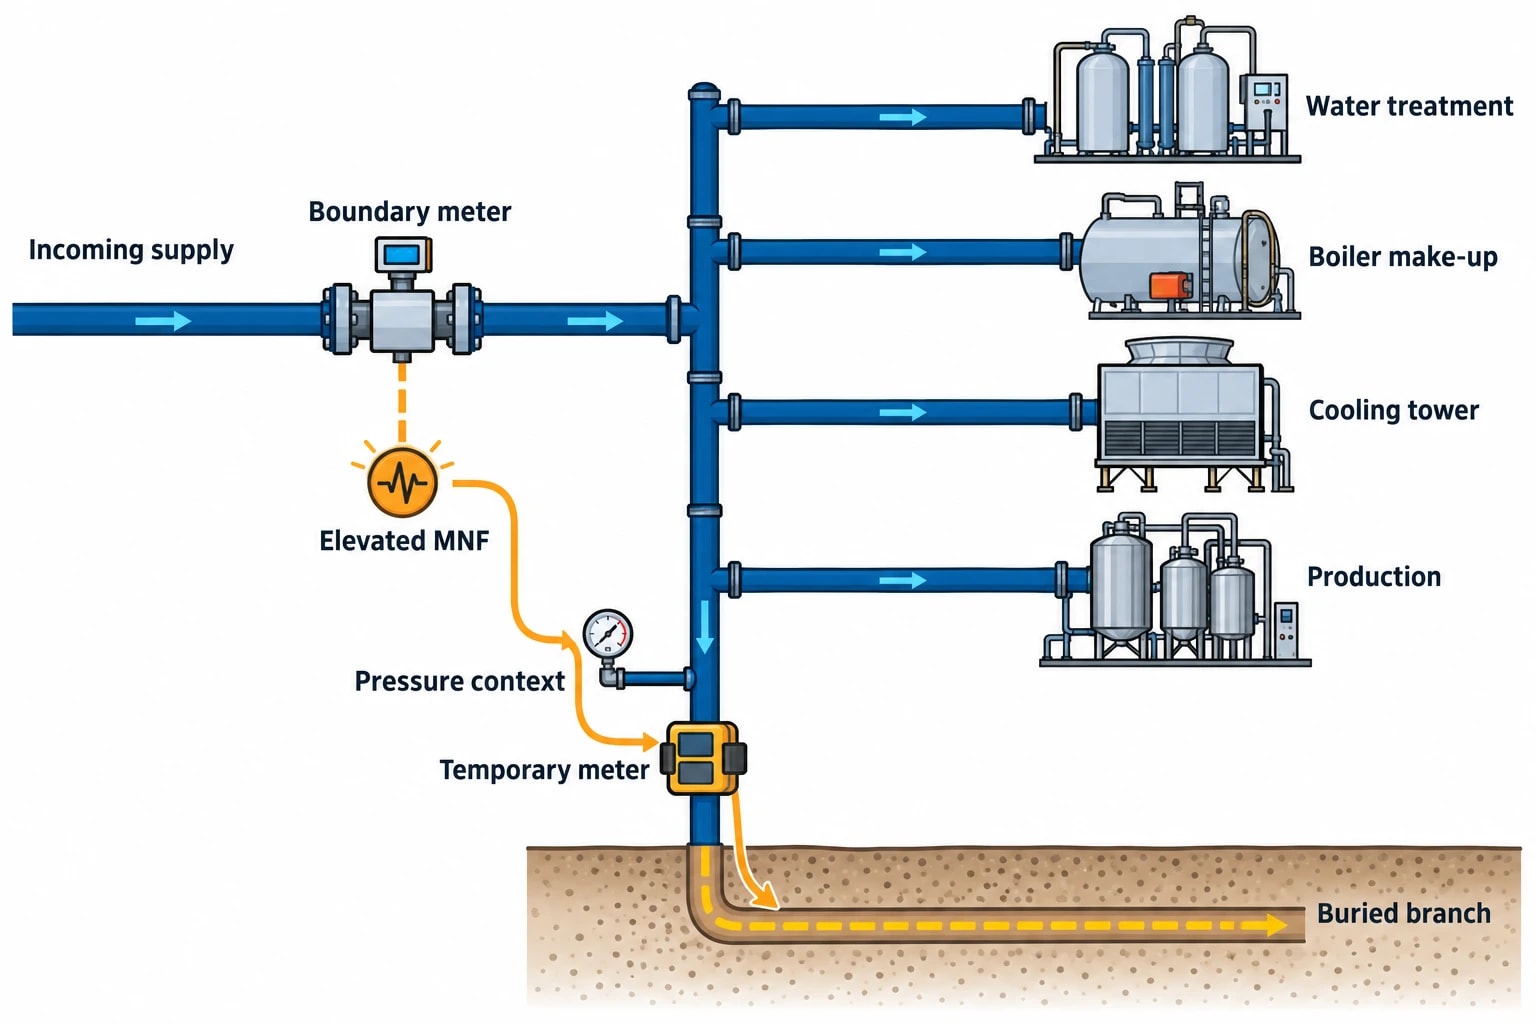
An incoming meter can reveal that a site has a problem. Sub-metering helps identify where it sits. The most useful meter arrangement follows water from supply to major demand centres.
Build a practical industrial water balance
A first-stage metering plan normally includes the incoming mains supply, borehole or abstraction supply, and major utility users. Suitable secondary meter locations may include:
- Water-treatment and storage systems.
- Boiler houses and steam-generation make-up.
- Cooling-tower make-up and blowdown.
- Major production departments.
- Clean-in-place systems.
- Washdown points and hygiene areas.
- Irrigation, external services and welfare facilities.
- Final effluent monitoring points where the process requires them.
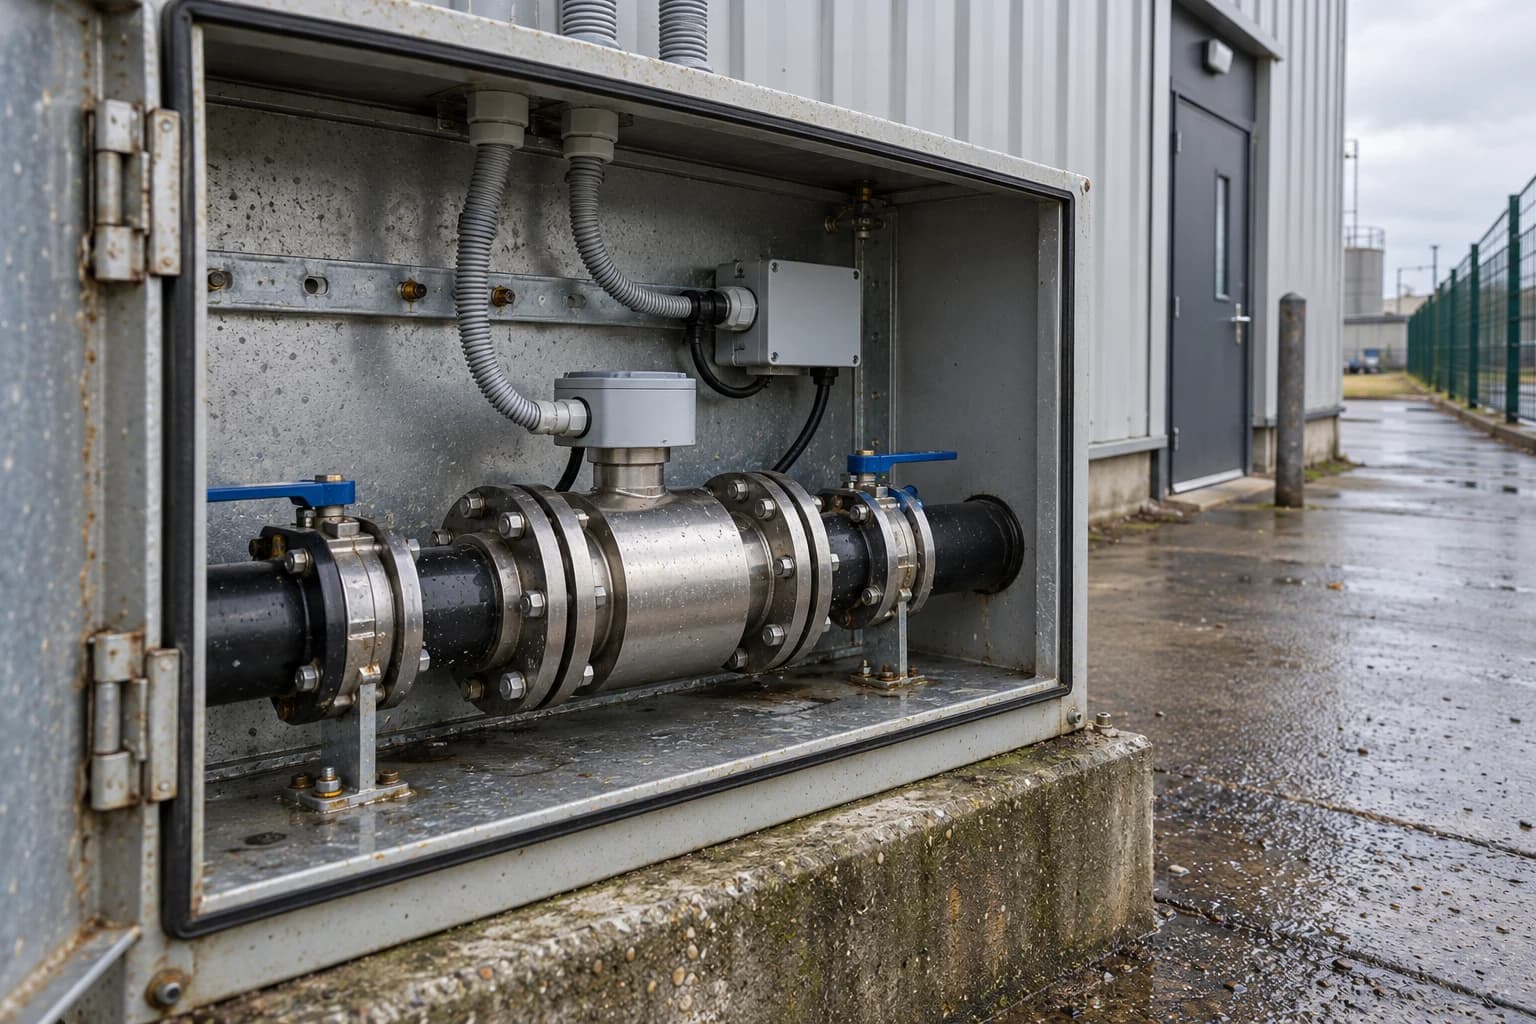
A complete balance is not required before work begins. The incoming supply meter provides the starting point. If MNF rises at that boundary, temporary portable meters or permanent sub-meters can narrow the search to a utility area, process department or buried branch.
Confirm low-flow performance before analysing trends
A flow meter selected for a high process peak may not resolve the small flows that matter at night. Conversely, a meter optimised for very low flow may be unsuitable for peak demand.
Meter selection and commissioning should consider:
- Expected minimum and maximum flow.
- Turndown and measurement uncertainty.
- Pipe material, diameter and installation geometry.
- Water quality and suspended solids.
- Accessible isolation points.
- Timestamp synchronisation across meters.
- Missing-data detection and communication resilience.
Commissioning teams should verify readings against a known operating event where practical. They should also inspect the first weeks of interval data for repeated zeroes, implausible spikes and clock misalignment before adopting a baseline.
Add pressure data where it changes interpretation
Pressure often provides useful context for elevated residual flow. Leakage can rise with pressure, while equipment demand may show a different relationship between flow and pressure.
Pressure data cannot locate a leak by itself. It becomes useful when engineers align it with flow, pump status, valve position, tank levels and operating schedules. A stable pressure with a step rise in flow can point to a new demand. A simultaneous pressure and flow change may indicate a supply or control issue requiring wider review.
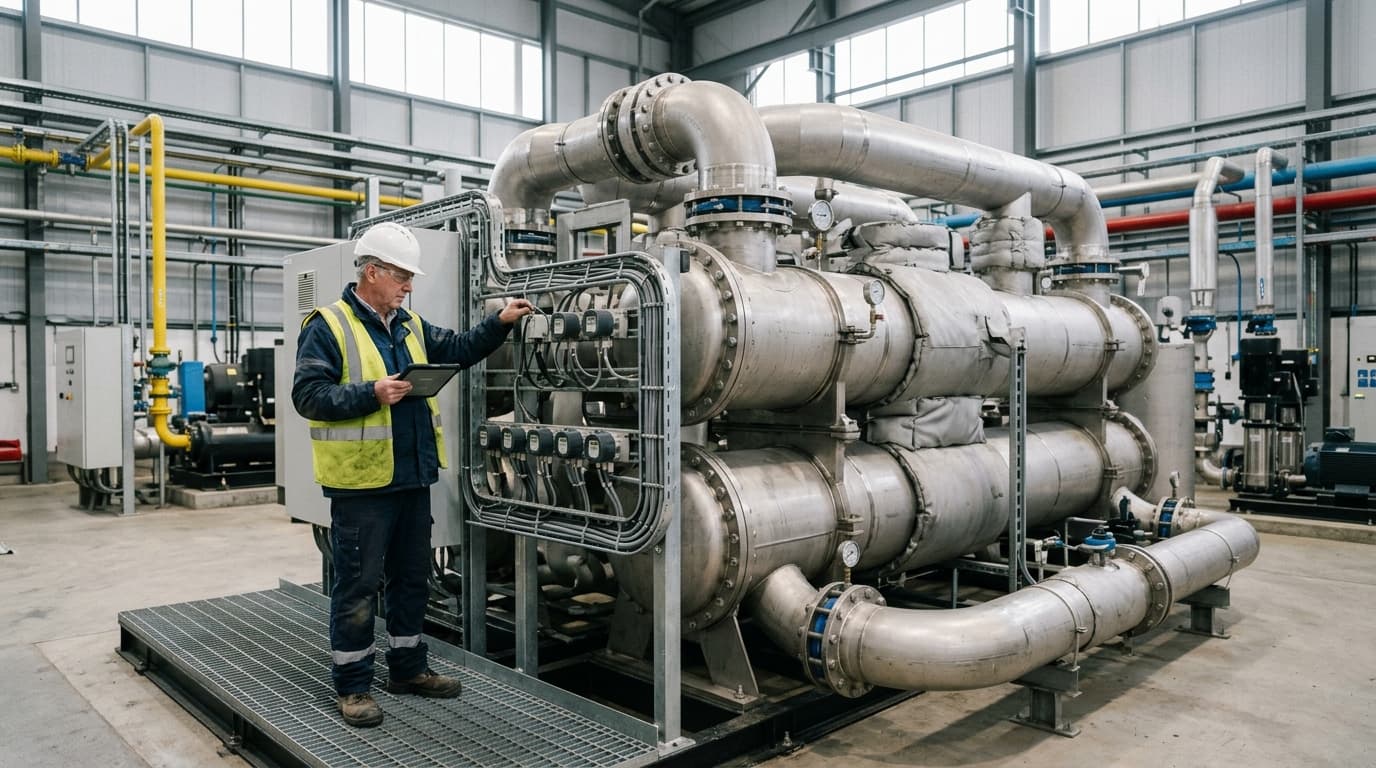
Track energy consumption, emissions, and process parameters with seamless PLC/SCADA integration via Modbus, OPC-UA, and MQTT protocols.
Use a defined anomaly-detection method, not a vague threshold
A fixed threshold can be useful for an obvious burst. It is less reliable when production patterns vary. The alert method should state how it establishes normal behaviour, manages different operating states and triggers escalation.
A practical approach combines time-series segmentation with a modified Z-score test. The method groups comparable MNF values by operating state, such as weekday production, weekend shutdown or scheduled cleaning. It then uses the median and median absolute deviation, known as MAD, to identify values that sit well outside the normal distribution for that state.
The modified Z-score is less influenced by an earlier leak or an isolated high-use night than a mean-and-standard-deviation threshold. Environmental monitoring guidance commonly treats a modified Z-score above 3.5 as an outlier candidate. That is a screening criterion, not a universal declaration that a leak exists.
Set alert criteria that operators can understand
A site should document an alert rule before deployment. One example is to raise an investigation alert when all of the following apply:
- The meter passes data-quality checks.
- The plant is in a recognised low-demand operating state.
- The rolling MNF residual has a modified Z-score above 3.5 against its comparable baseline.
- The condition persists for three consecutive intervals, or a predefined volume is exceeded.
- No tagged cleaning, regeneration, maintenance or production event explains the increase.
The persistence condition filters out short equipment events. The defined volume condition ensures that a large, sudden increase receives attention without waiting for repeated intervals.
Engineers should tune the period length, operating-state groups and escalation limit to the site. A food plant with scheduled nightly cleaning will have a different baseline from a warehouse or metals plant.
Detect sudden failures and developing losses
Leak signatures vary. A step increase may follow pipe damage, a failed valve or a tank overflow. A slow upward trend can arise from degrading valve seats, seal wear or an underground loss that develops over weeks.
The investigation priority should account for rate of change, water source, likely destination of the water, safety exposure and process risk. A small but rapidly increasing residual flow near a production area may warrant faster action than a stable residual at a remote external service.
Close the loop after every repair
An anomaly alert should trigger a controlled field response.
- Confirm the operating state and data quality.
- Check whether the incoming and downstream meters show the same timing and direction of change.
- Review cleaning, regeneration, maintenance and production records.
- Inspect tanks, overflow routes, automatic valves, washdown points and accessible pipework.
- Isolate sections only through approved site procedures.
- Record the fault, repair and confirmed root cause.
- Verify that the next comparable MNF periods return to the prior baseline.
This final verification proves whether the repair reduced the measured residual flow. It can also expose a second issue that daytime observation concealed.
ISO 46001 puts leakage detection into water-efficiency management
ISO 46001:2019/Amd 1:2024 sets out requirements and guidance for water-efficiency management systems. It gives organisations a structure for policy, planning, measurement, performance evaluation and continual improvement.
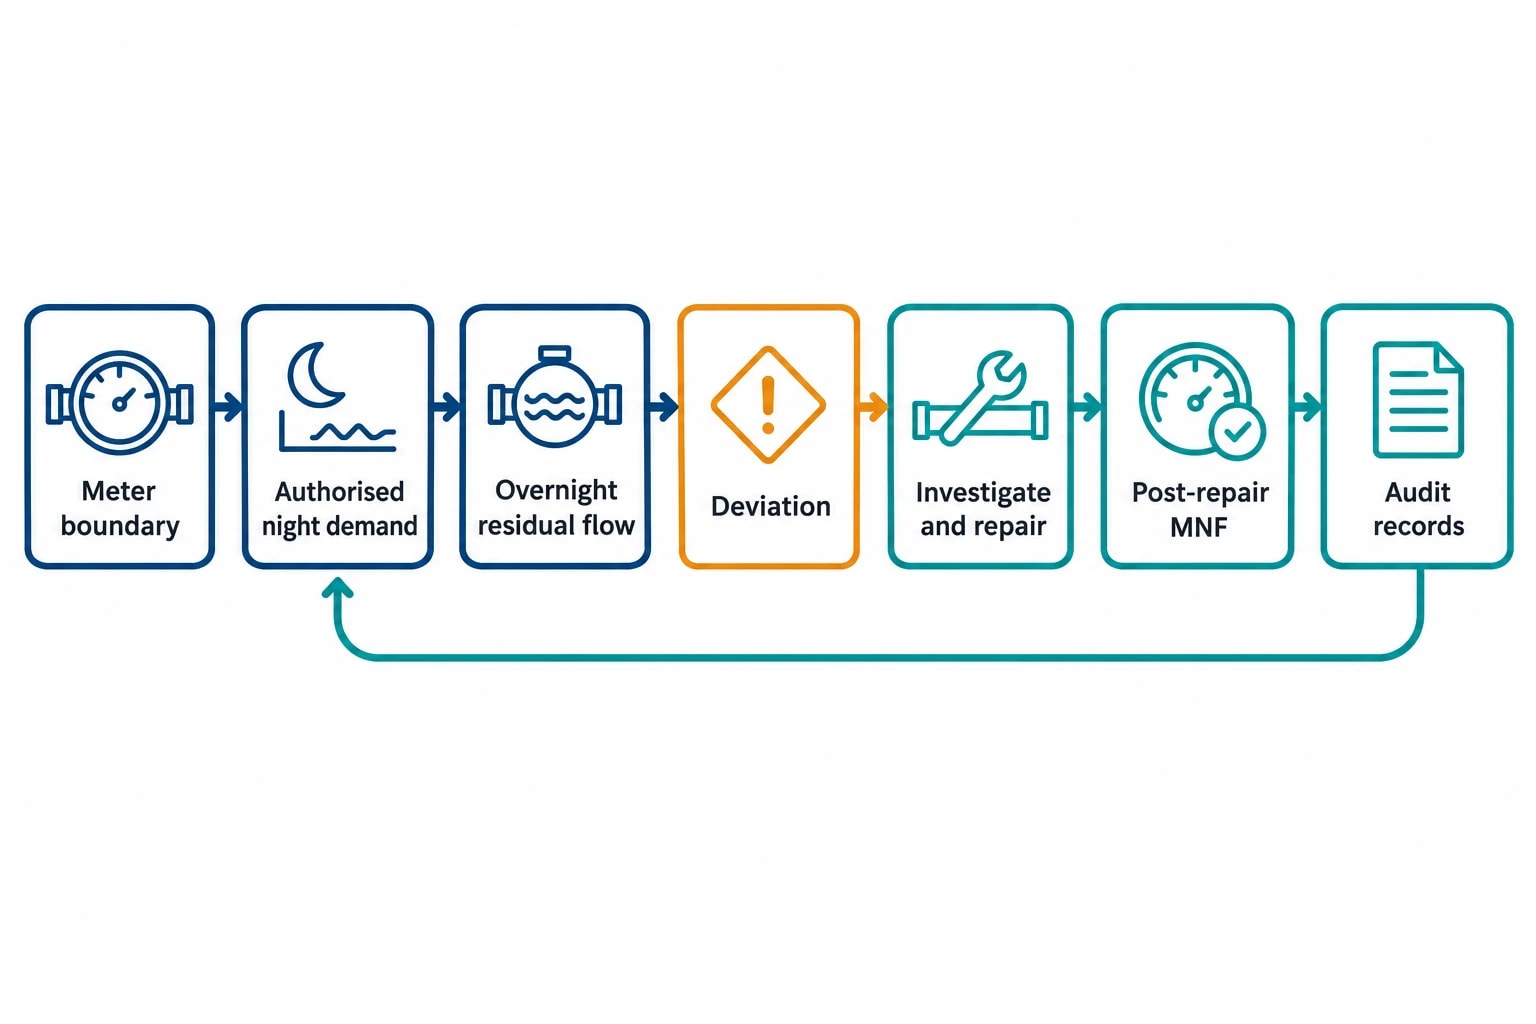
MNF analysis supports that structure because it creates a repeatable control for avoidable water use. It provides evidence that a site has defined a baseline, identified significant water uses, investigated deviations and checked whether corrective action worked.
Choose indicators that reflect the operation
Total cubic metres consumed is essential, but it can mislead when production changes. A stronger reporting set combines absolute consumption with indicators linked to operating activity.
Examples include:
- Water per tonne of saleable product.
- Water per batch.
- Boiler make-up per tonne of steam.
- Cooling-tower make-up per operating hour.
- Overnight residual flow by meter boundary.
- Number of anomaly investigations closed within the agreed response period.
External sector benchmarks may provide context, but internal comparisons usually deliver the strongest leakage signal. Comparing the same meter boundary, production state and night window reveals deterioration that an industry-average figure may conceal.
Retain records that support investigation and audit
A formal water-efficiency programme should retain:
- Meter hierarchy and boundary definitions.
- Meter commissioning and validation records.
- The baseline method and assumptions for authorised night demand.
- Operating-state tags and excluded events.
- Alert records, investigation findings and repairs.
- Post-repair MNF verification.
- Production-normalised consumption trends.
These records allow managers to distinguish a genuine efficiency improvement from reduced output, altered product mix or an unverified assumption.
Abstraction and discharge controls add urgency
In England, a site planning to abstract more than 20 m³ of water a day will generally need an abstraction licence from the Environment Agency. Licence holders must operate within the conditions attached to their authorisation.
Unexplained night use can erode the margin against an internal abstraction budget or licence limit. Interval metering gives operators an earlier warning than monthly reconciliation, supporting timely investigation before excess use becomes material.
Map the route of escaped water
A supply-side loss may soak into ground, enter a building void, reach a drainage system or escape beyond the site boundary. Each outcome has a different operational and environmental consequence.
The Environment Agency regulates activities that could pollute water, affect water resources or require a discharge or groundwater permit. Metering does not replace a permit, drainage plan, risk assessment or physical inspection. It provides time-series evidence that helps teams identify abnormal use, investigate its destination and document the response.
Start with the boundary that matters most
The most effective first deployment is usually the incoming supply or abstraction meter, paired with a clear description of normal overnight demand. It establishes whether the site has a measurable residual-flow issue.
Further metering should follow the evidence. Install or validate meters at the utility plant, department or process line driving the unexplained flow. This staged approach avoids adding instrumentation without a defined investigation purpose.
This article reflects the independent analysis and editorial opinion of EnerTherm Engineering. Product names, trademarks, and brands mentioned belong to their respective owners. EnerTherm Engineering is not affiliated with, endorsed by, or a licensee of any third-party software or product mentioned unless explicitly stated.

Technical Manager — EnerTherm Engineering
John Naranjo is Technical Manager at EnerTherm Engineering, bringing specialist expertise in chemical and environmental engineering. He recently led the implementation of Omni Vision, EnerTherm's real-time energy and utility monitoring platform. He holds an MSc in Environmental Engineering from the University of Huelva and a BSc in Chemical Engineering, with memberships in both the Energy Institute and IChemE.
