AI-Driven Energy Consumption Forecasting Cuts TCR Costs
Applying EPSA AI and ISO 50006:2023 EnPIs to shift chemical loads and reduce costs.
AI-driven energy consumption forecasting is a predictive modelling technique that uses machine learning algorithms and real-time process data to project future industrial utility demands. In energy-intensive sectors like chemical and pharmaceutical manufacturing, operations directors traditionally rely on historical billing data and retrospective spreadsheet models. These retrospective tools fail to capture the complex, non-linear relationships of modern production facilities. Industrial energy consumption is not static. It fluctuates based on ambient temperature, humidity, chemical batch stages, and equipment degradation.
Machine learning models resolve this complexity by continuously ingesting high-frequency data from plant-floor sensors and controllers. By evaluating historical relationships between production volume, ambient conditions, and energy input, the algorithms generate accurate forecasts of electricity, gas, steam, and water consumption. Instead of reacting to utility bills weeks after consumption occurs, plant managers use these predictive insights to schedule energy-intensive operations during optimal periods.
The Shift from Reactive to Proactive Energy Management
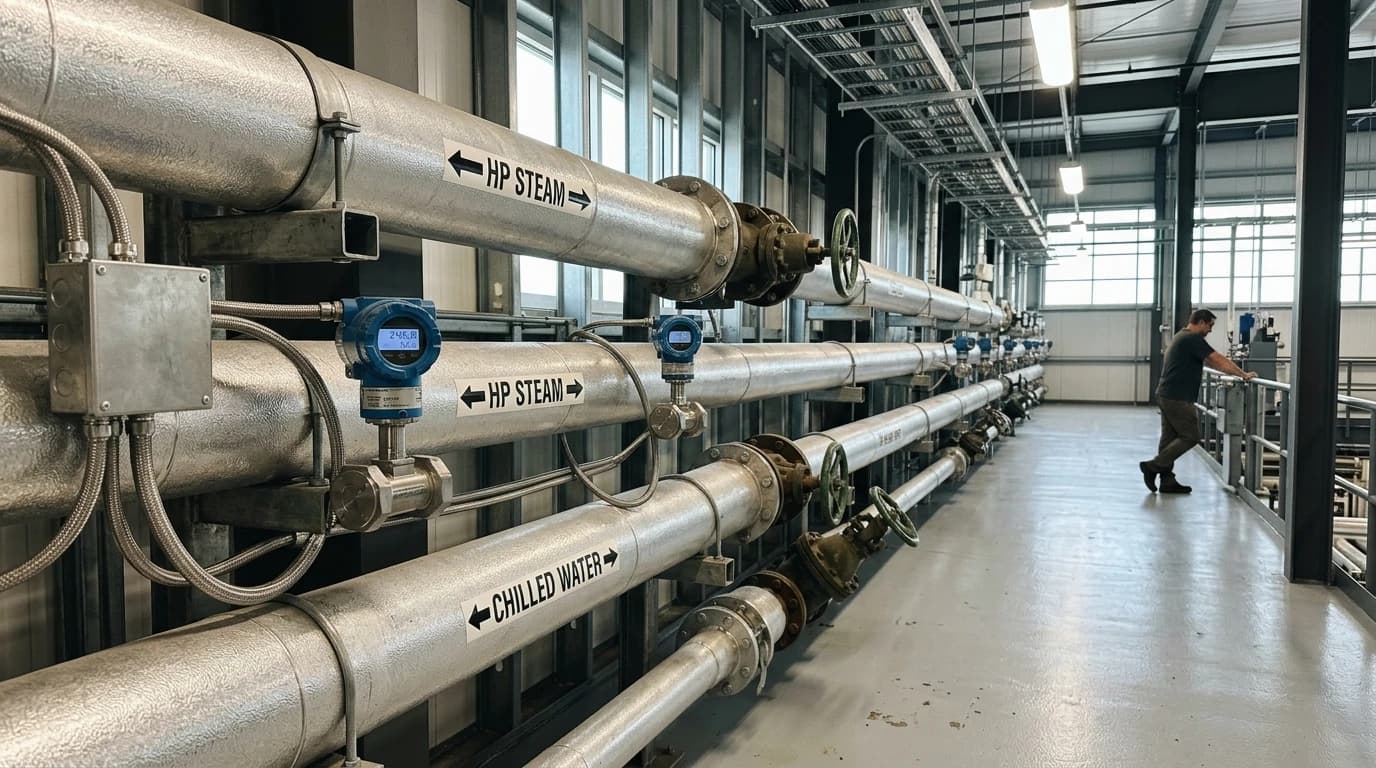
Traditional utility tracking relies on manual entries, usually performed on a weekly or monthly basis. This lag means energy anomalies, such as steam leaks or compressed air drops, persist for days before detection. In contrast, predictive models establish a dynamic baseline of normal operations that adapts to production volumes and ambient conditions. When actual consumption deviates from the predicted model, the system alerts operations teams immediately, preventing energy waste and downtime.
Omni Vision delivers turnkey utility metering, CO2 tracking, and AI-powered production KPI intelligence — giving you real-time dashboards and actionable insights across your entire facility.
The Financial Imperative: Mitigating Rising TNUoS and TCR Costs
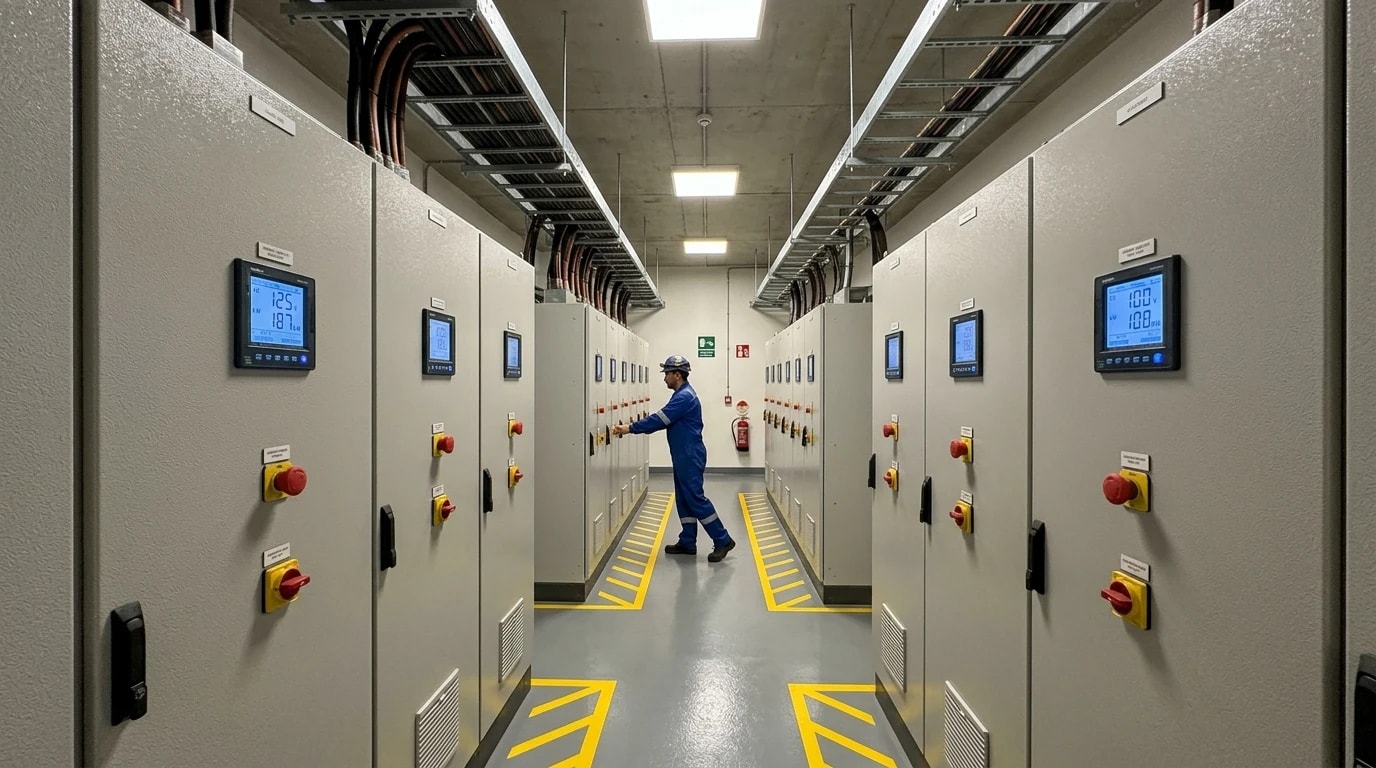
The financial pressure on energy-intensive UK businesses has intensified due to major regulatory adjustments in electricity transmission network charges. According to the National Energy System Operator (NESO) five-year forecast, Transmission Network Use of System (TNUoS) demand residual revenue will rise from £3.84bn in 2025/26 to £7.52bn in 2026/27. This represents an average increase of over 62 per cent. Estimates suggest that these transmission costs will reach £11.75bn by the end of the decade.
The RIIO-ET3 price control framework, running from April 2026 to March 2031, is driving these increases. Under this framework, Ofgem has allocated significant capital to upgrade the national electricity grid to support the UK's transition to clean power by 2030. To recover these infrastructure costs, Ofgem implemented the Targeted Charging Review (TCR). The TCR restructured TNUoS charges, shifting them from consumption-based unit rates to a fixed daily standing charge per meter. These fixed daily charges are based on a site’s connection voltage and its agreed capacity band.
The Cost Allocation Challenge
Industrial facilities are assigned to specific TCR bands based on their historical peak demand. If a chemical plant experiences a single, unmanaged spike in electricity consumption that breaches their agreed capacity limit, the site risks being reallocated to a higher charging band. The updated TCR banding thresholds coming into effect in 2026 will push many industrial sites into higher tariff categories, locked in for years.
Because these charges are billed as fixed daily fees rather than per-unit rates, standard energy efficiency improvements cannot reduce this exposure. Energy managers must prevent peak demand spikes from crossing capacity thresholds. Doing so requires precise, predictive planning of when the facility draws energy from the grid.
| Connection Voltage | Historical Peak Demand Band | TCR Standing Charge Impact |
|---|---|---|
| Low Voltage (LV) | Band 1 to 4 (Sub-100 kW to High Demand) | Minor to Moderate fixed daily increase |
| High Voltage (HV) | Band 1 to 4 (Medium to High Capacity) | High fixed daily increase, threshold sensitive |
| Extra High Voltage (EHV) | Bespoke Allocation | Extreme daily cost risk under RIIO-ET3 |
How AI-Driven Forecasting Mitigates TCR and Triad Volatility
AI-driven energy consumption forecasting enables industrial operators to maintain their demand below critical TCR thresholds through proactive load shifting. Instead of running processes continuously or relying on manual scheduling, operators use predictive algorithms to model grid demand and plant-floor requirements in tandem.
By predicting the exact hours of peak grid stress, which dictate triad periods and high-tariff distribution windows, the software recommends operational adjustments hours in advance. Flexible utility loads can then be shifted to off-peak periods without compromising production volume or product quality.
Optimising Flexible Chemical Processing Loads
Chemical plants feature several utility systems that possess high thermal or operational inertia, making them ideal candidates for predictive load shifting.
- Cooling Towers and Industrial HVAC: Chillers and cooling towers consume vast amounts of electricity. AI models predict periods of peak grid tariffs and recommend pre-cooling routines in advance. This pre-cooling, executed by site operators or the building management system (BMS) during validated change windows, relies on the thermal mass of the system's process water to maintain required temperatures during peak windows, allowing physical equipment to be throttled down.
- Batch Reactors: Batch heating cycles require substantial initial electrical or steam energy. Predictive models identify optimal windows for these high-energy steps, enabling operators to schedule them to avoid peak network tariff periods and spread the energy demand evenly.
- Air Compressors: Compressed air systems often operate with high peak demands. The platform forecasts demand and recommends receiver tank charging during low-tariff hours, allowing operators to ensure sufficient stored capacity is available when grid prices peak.
Track energy consumption, emissions, and process parameters with seamless PLC/SCADA integration via Modbus, OPC-UA, and MQTT protocols.
Integrating with ISO 50006:2023 for Rigorous Performance Validation
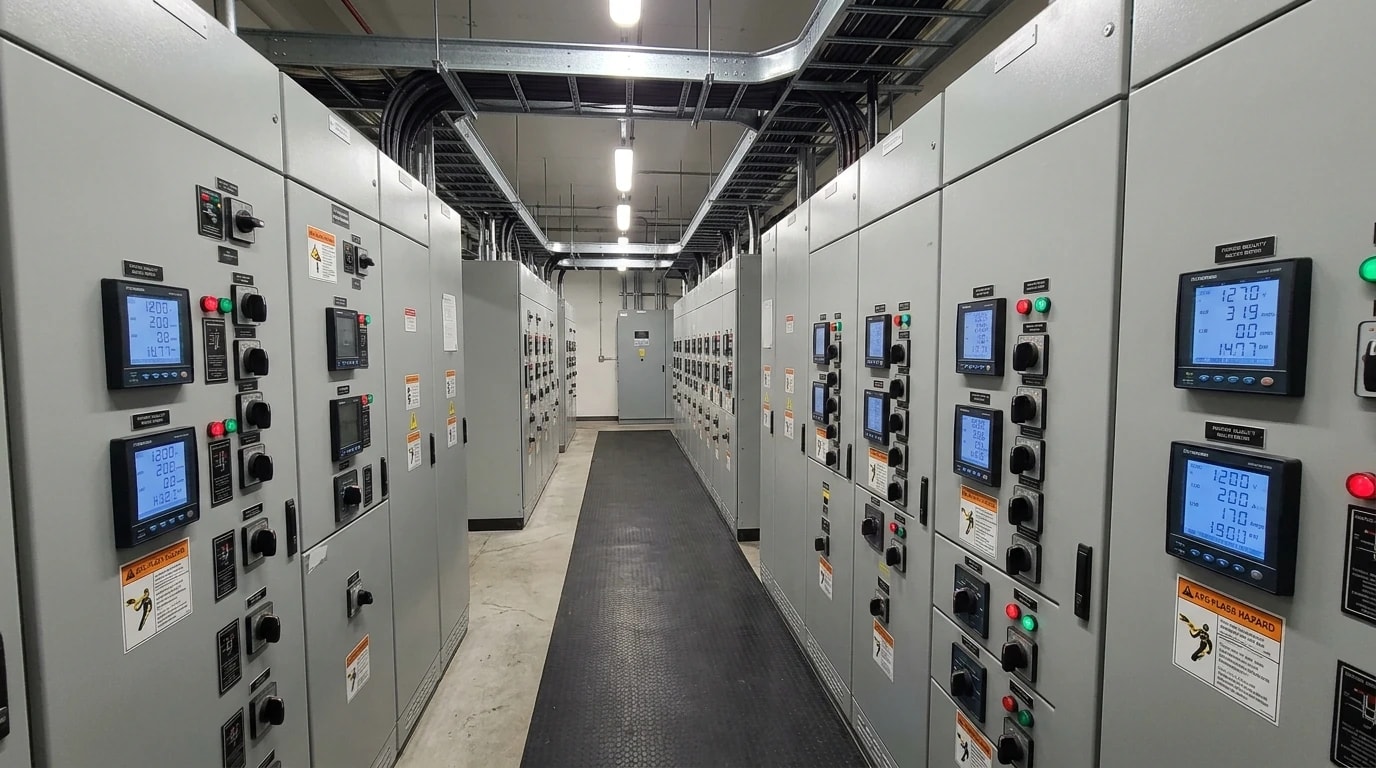
To verify the financial and operational benefits of these predictive adjustments, energy managers require a standardised method for measuring energy performance. ISO 50006:2023 provides the globally recognised framework for evaluating energy performance using energy baselines (EnBs) and energy performance indicators (EnPIs).
Evaluating the success of predictive algorithms requires normalising the energy data against relevant variables. In a chemical plant, energy consumption cannot be measured in a vacuum. It must be compared directly to production outputs and ambient weather conditions.
The fundamental metric of specific energy consumption (SEC) provides the starting point for this analysis:
SEC=PEIn this formula, E represents the total energy consumed by the process or system in kilowatt-hours (kWh). P represents the physical production output, measured in tonnes or specific batch units.
Normalising for Multi-Variable Production Environments
Under ISO 50006:2023, static baselines are insufficient when relevant variables like production throughput or ambient temperature change. For example, a cold winter naturally increases the thermal energy required for reactor heating, while reducing the electricity consumed by cooling towers. Without proper normalisation, these weather variations can mask genuine energy performance improvements or simulate false savings.
AI-driven forecasting models solve this by constructing dynamic EnBs. Using multi-variable regression and machine learning, the platform calculates what the energy consumption would have been under the exact production and weather conditions of the current day. By comparing this dynamic baseline to the actual, lower consumption achieved via load shifting, operators receive an accurate, auditable measure of performance improvement that fully complies with ISO 50006:2023 and ISO 50001:2018.
Architecture of the Omni Vision Energy Intelligence Platform
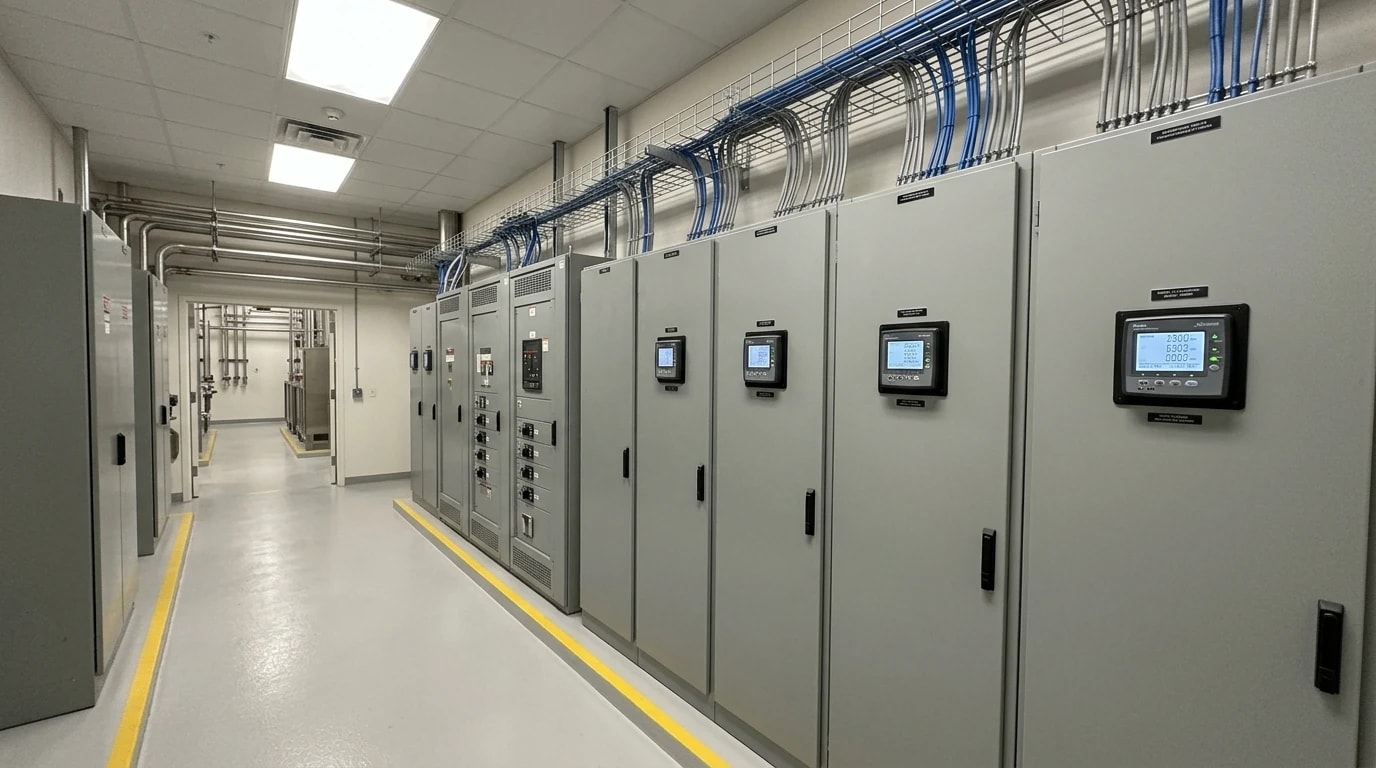
The Omni Vision Energy Intelligence Platform provides a complete, turnkey solution that bridges the gap between physical plant-floor operations and cloud-based predictive analytics. The platform combines precision hardware integration with advanced analytical modelling to deliver a centralised energy intelligence system.
To ensure minimal disruption to existing chemical and pharmaceutical operations, the deployment utilises non-invasive hardware integration. The system connects to existing Programmable Logic Controllers (PLCs) and field devices using standard industrial protocols:
- Modbus (TCP/RTU)
- OPC-UA
- BACnet
- MQTT
This physical architecture guarantees a secure, one-way encrypted data flow from the plant floor to EPSA's cloud-based AI analytics engine. Crucially, the platform maintains zero-write access to plant control systems. This strict data separation preserves the necessary safety and operational standards of sensitive industries, including Good Manufacturing Practice (GMP) for pharmaceutical plants and Hazard Analysis Critical Control Point (HACCP) for food-related chemical processing.
The platform monitors six core utility streams across the entire facility:
- Electricity
- Natural Gas
- Water
- Steam
- Compressed Air
- Fuel Oil
By tracking these utilities at the process level, such as individual distillation columns, batch reactors, or cooling towers, the platform maps utility consumption directly against production outputs. This granular mapping calculates precise process-linked KPIs, including energy per batch and cost per tonne. Implemented through a standardised 8 to 16-week turnkey deployment model, this transition from manual spreadsheet tracking to real-time intelligence typically delivers a 15 to 25 per cent reduction in total energy costs, achieving a sub-12-month ROI.
Secure Data Ingestion and Processing Flow
The following flow diagram illustrates the secure ingestion of physical plant data and its transition into predictive actions for tariff mitigation:
The edge gateway extracts high-frequency measurements from existing plant meters without interfering with active process control loops. Once transmitted to the cloud engine, the AI algorithms process this data alongside external inputs like weather forecasts and grid tariff schedules to update consumption forecasts in real time.
Industrial Decarbonisation: Automated SECR and CSRD Compliance
Beyond mitigating grid-derived financial penalties, AI-driven energy consumption forecasting plays an important role in regulatory environmental compliance. Large chemical and manufacturing organisations operating in the UK and Europe must comply with strict reporting frameworks. These include the UK’s Streamlined Energy and Carbon Reporting (SECR) framework and the EU’s Corporate Sustainability Reporting Directive (CSRD).
These regulations demand transparent and auditable data regarding Scope 1 (direct) and Scope 2 (indirect) greenhouse gas emissions. Manual data collection and estimation methods are no longer sufficient to pass external audits under these modern regulatory regimes.
Transitioning from Estimates to Automated Scope 2 Audits
By mapping real-time, process-level energy consumption to production outputs, the Omni Vision platform automates the calculation of Scope 1 and Scope 2 emissions. Instead of relying on monthly utility invoices, the system utilises high-fidelity data to generate audit-ready emissions reports based on actual energy-to-production ratios.
- Audit Readiness: Every carbon emission calculation is traced directly back to the physical meter and the specific hour of consumption. This granular trace meets the limited and reasonable assurance requirements of the EU CSRD.
- Scope 2 Accuracy: By incorporating grid carbon intensity forecasts alongside plant-floor energy consumption, the system calculates the exact hourly carbon impact of purchased electricity, reflecting the actual grid mix at the time of use.
- Emission Reduction Verification: The dynamic baselines constructed under the ISO 50006:2023 framework provide auditors with verifiable proof of carbon reductions, eliminating any risk of greenwashing allegations.
Transitioning from manual spreadsheets to automated, AI-driven reporting ensures that compliance teams can generate verified, audit-ready data. This systematic approach allows energy-intensive plants to protect themselves from rising grid costs while demonstrating progress toward their net-zero decarbonisation targets.
This article reflects the independent analysis and editorial opinion of EnerTherm Engineering. Product names, trademarks, and brands mentioned belong to their respective owners. EnerTherm Engineering is not affiliated with, endorsed by, or a licensee of any third-party software or product mentioned unless explicitly stated.

Technical Manager — EnerTherm Engineering
John Naranjo is Technical Manager at EnerTherm Engineering, bringing specialist expertise in chemical and environmental engineering. He recently led the implementation of Omni Vision, EnerTherm's real-time energy and utility monitoring platform. He holds an MSc in Environmental Engineering from the University of Huelva and a BSc in Chemical Engineering, with memberships in both the Energy Institute and IChemE.
