How OPC UA Streams Real-Time PLC Data into Chemical Plants
A secure, zero-write architecture for utility and process data streaming
OPC UA real-time PLC data streaming is the controlled delivery of live process and utility values from programmable logic controllers to authorised data applications through OPC Unified Architecture. For chemical manufacturers, it converts information already present in the control environment into time-aligned evidence for utility management, production-normalised KPIs and energy reporting.
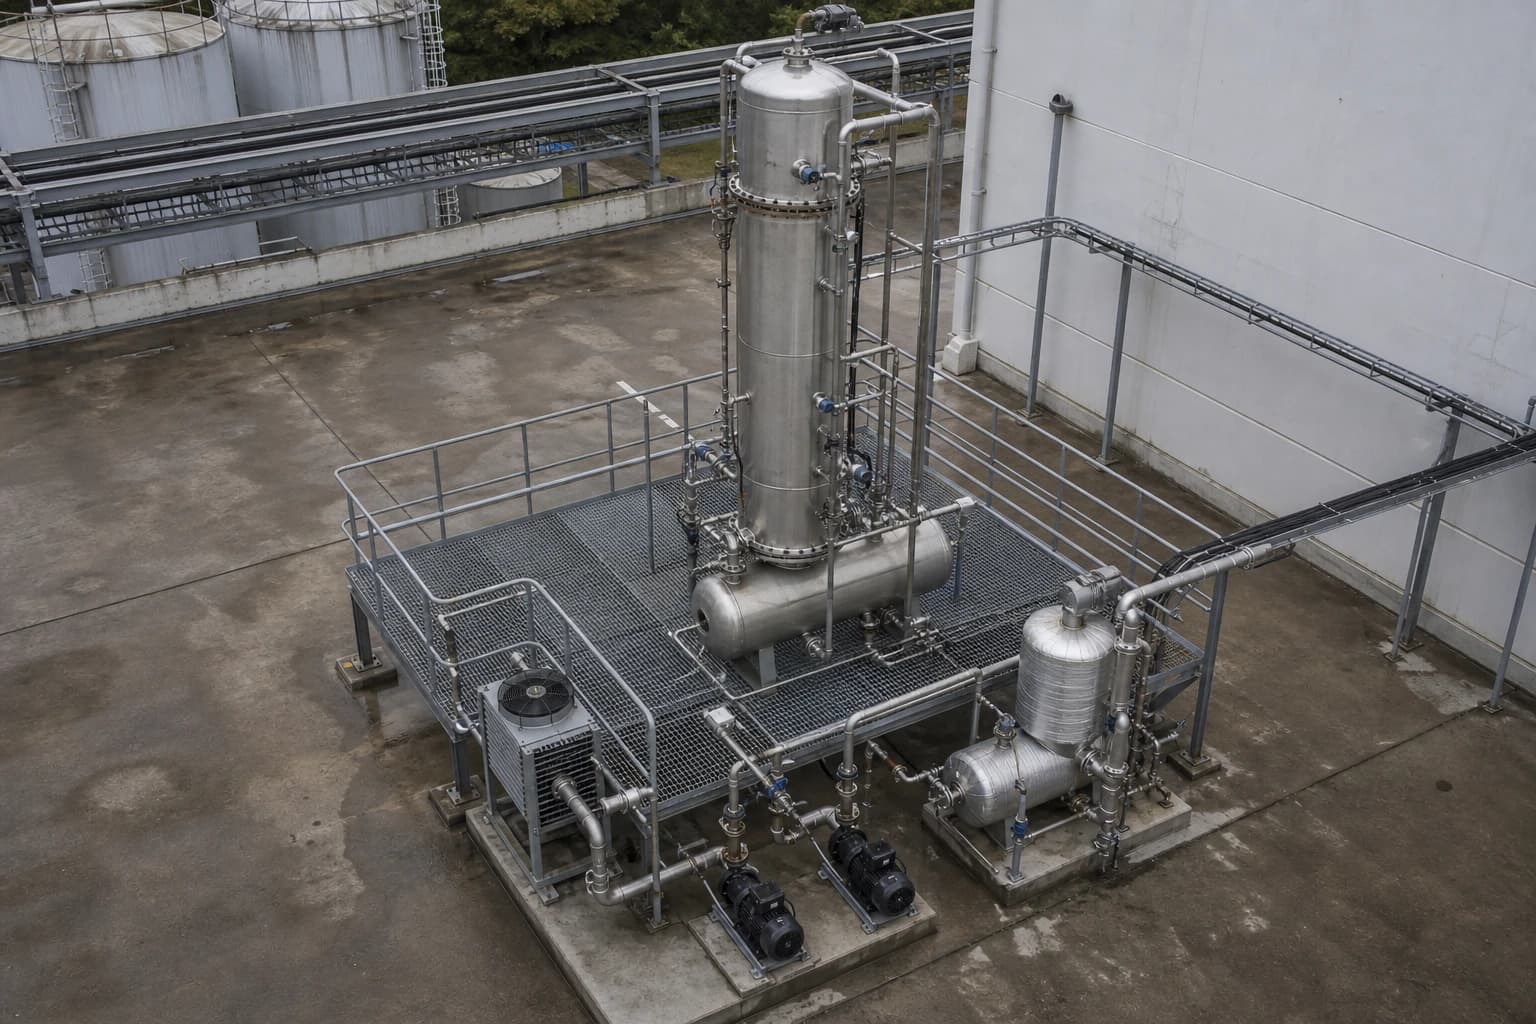
Consider a solvent-recovery train. The control system may already hold steam flow to the reboiler, reflux rate, feed rate, condenser cooling-water flow, pump status and product transfer totals. Separately, an electricity meter may record demand at the motor control centre. If each value remains in a different screen, historian or spreadsheet, engineers cannot reliably test whether a rise in energy use reflects throughput, a grade change, a batch transition or an equipment fault.
OPC UA gives selected PLC and meter data a common, structured route into an energy intelligence platform. The platform reads the values. It does not need to write a setpoint, start a motor or alter a recipe. That separation matters in a chemical plant, where production continuity and process safety take priority over reporting convenience.
“Real time” does not mean forcing every PLC tag to travel at the shortest controller scan interval. It means choosing a data rate, timestamp and quality treatment that support a defined engineering decision.
What real-time PLC data means for chemical utilities
A live data stream should serve the operational timescale of the asset. A compressor load-state change may need prompt reporting. A main electrical demand measurement may need a short interval. A tank level used for inventory allocation may need a slower interval. A fiscal or utility meter total needs its source timestamp, unit and cumulative-register behaviour preserved.
Sending all data at the highest available rate wastes capacity and can obscure the signal that matters. Sampling and reporting requirements should follow the use case.
A usable stream carries context with each value
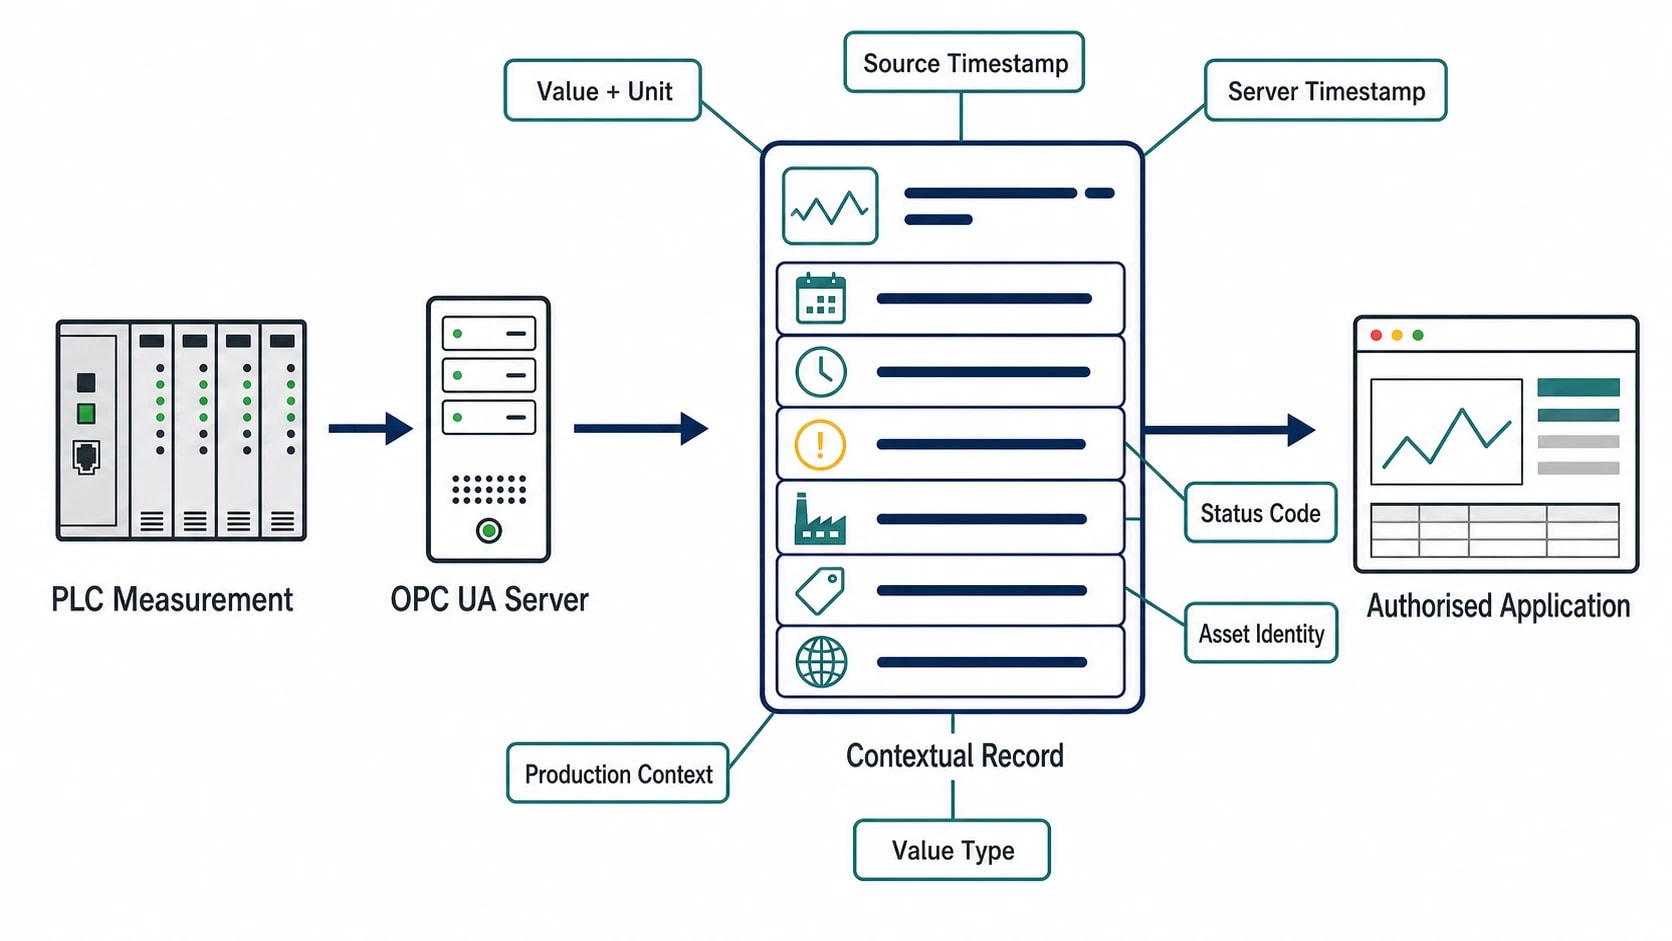
An OPC UA monitored value can include more than a number. A properly specified stream should preserve:
- The value and engineering unit
- The source timestamp
- The server timestamp
- The OPC UA status code
- The tag identity and physical asset
- Whether the value is instantaneous, cumulative or calculated
- Production context, such as product grade, batch identifier, recipe version or phase
The source timestamp records when the originating source applied the time to the value. The server timestamp records when the OPC UA server received the value or knew it remained accurate. That distinction matters when an energy calculation must place consumption within a batch phase or tariff interval.
A cumulative electricity register presents another common issue. A receiving system needs to retain the raw register, recognise planned resets and flag unexpected rollovers. Treating every incoming total as a fresh consumption value can create false energy spikes.
Utility data needs process state
A site-wide steam total can indicate that demand rose. It cannot explain whether the increase was expected.
A distillation column may require more steam during a higher-throughput campaign. A reactor may consume more jacket heating during a particular recipe phase. A cooling tower may run harder because of ambient conditions, condenser duty or an inefficient fan sequence. Process state turns a utility reading into something engineers can assess.
For chemical operations, useful PLC and meter points often include:
- Electricity demand and cumulative consumption at incomers, motor control centres and major drives
- Natural gas use at boilers, furnaces and thermal oxidisers
- Steam generation, pressure reduction, distribution and major process consumers
- Compressed-air compressor state, power and flow
- Cooling-water, chilled-water and process-water flows
- Reactor batch state, agitator load, temperature and product mass
- Distillation feed rate, reflux rate, reboiler steam flow and product rate
The objective is not a vast tag archive. It is a selected operational record that links energy consumption to the equipment and production conditions that caused it.

Omni Vision delivers turnkey utility metering, CO2 tracking, and AI-powered production KPI intelligence — giving you real-time dashboards and actionable insights across your entire facility.
How OPC UA subscriptions collect live PLC values
In the OPC UA client-server model, an authorised application creates a subscription and adds monitored items. Each monitored item identifies a PLC value or server variable to observe. The server samples the underlying source and reports notifications at the negotiated publishing interval.
This removes the need for an external application to repeatedly poll large sets of PLC tags. It also allows engineers to specify collection behaviour for each variable rather than applying one rate to an entire plant.
Sampling interval, publishing interval and queue size
Three settings need distinct treatment.
The sampling interval is the fastest rate at which the server evaluates a monitored value. The publishing interval is the cycle at which the subscription sends available notifications. Queue size controls how many notifications can wait for transmission.
An OPC UA server may return a revised sampling interval if the requested interval is unsuitable for its capabilities or the connected data source. The collector should store the negotiated result as commissioning evidence. A request for one-second data does not demonstrate that the PLC, gateway or server can supply meaningful one-second updates.
Use the engineering purpose to choose an initial configuration:
| Data type | Practical collection approach | Why it matters |
|---|---|---|
| Compressor run status | Report on state change, with a short publishing interval | Captures loaded, unloaded and stopped periods |
| Reboiler steam flow | Fixed interval with an agreed deadband | Supports phase and throughput comparison without recording noise |
| Main electrical demand | Short regular interval | Reveals peaks, demand changes and equipment loading |
| Cumulative meter total | Regular interval, retaining the raw total | Supports reconciliation across shift, batch and reporting periods |
| Batch phase or product grade | Report on change | Creates the production context for allocation |
A deadband filters minor changes that have no operational significance. It must be chosen in the correct engineering unit and tested against normal instrument variation. A deadband that is too wide can hide a developing utility issue. One that is too narrow can create unnecessary traffic and clutter.
Treat quality as part of the measurement
OPC UA data-change notifications include a status code. A quality-aware receiving process should retain that status alongside the value and classify records before using them in KPI calculations.
Records with bad or uncertain quality should not quietly enter a batch total or energy baseline. The system should flag them for review, mark the affected period as incomplete where appropriate, and retain the original observation. OPC UA also provides an overflow indication where a monitored-item queue has discarded notifications. That signal should prompt investigation before engineers rely on the affected sequence.
A sensible data specification defines the response to each condition. For example, a bad steam-flow value may invalidate a fifteen-minute performance interval. A missing batch identifier may prevent allocation to product. An unexpected meter reset may require a meter event record before the cumulative total can be used again.
Choosing subscriptions or OPC UA PubSub for PLC streaming
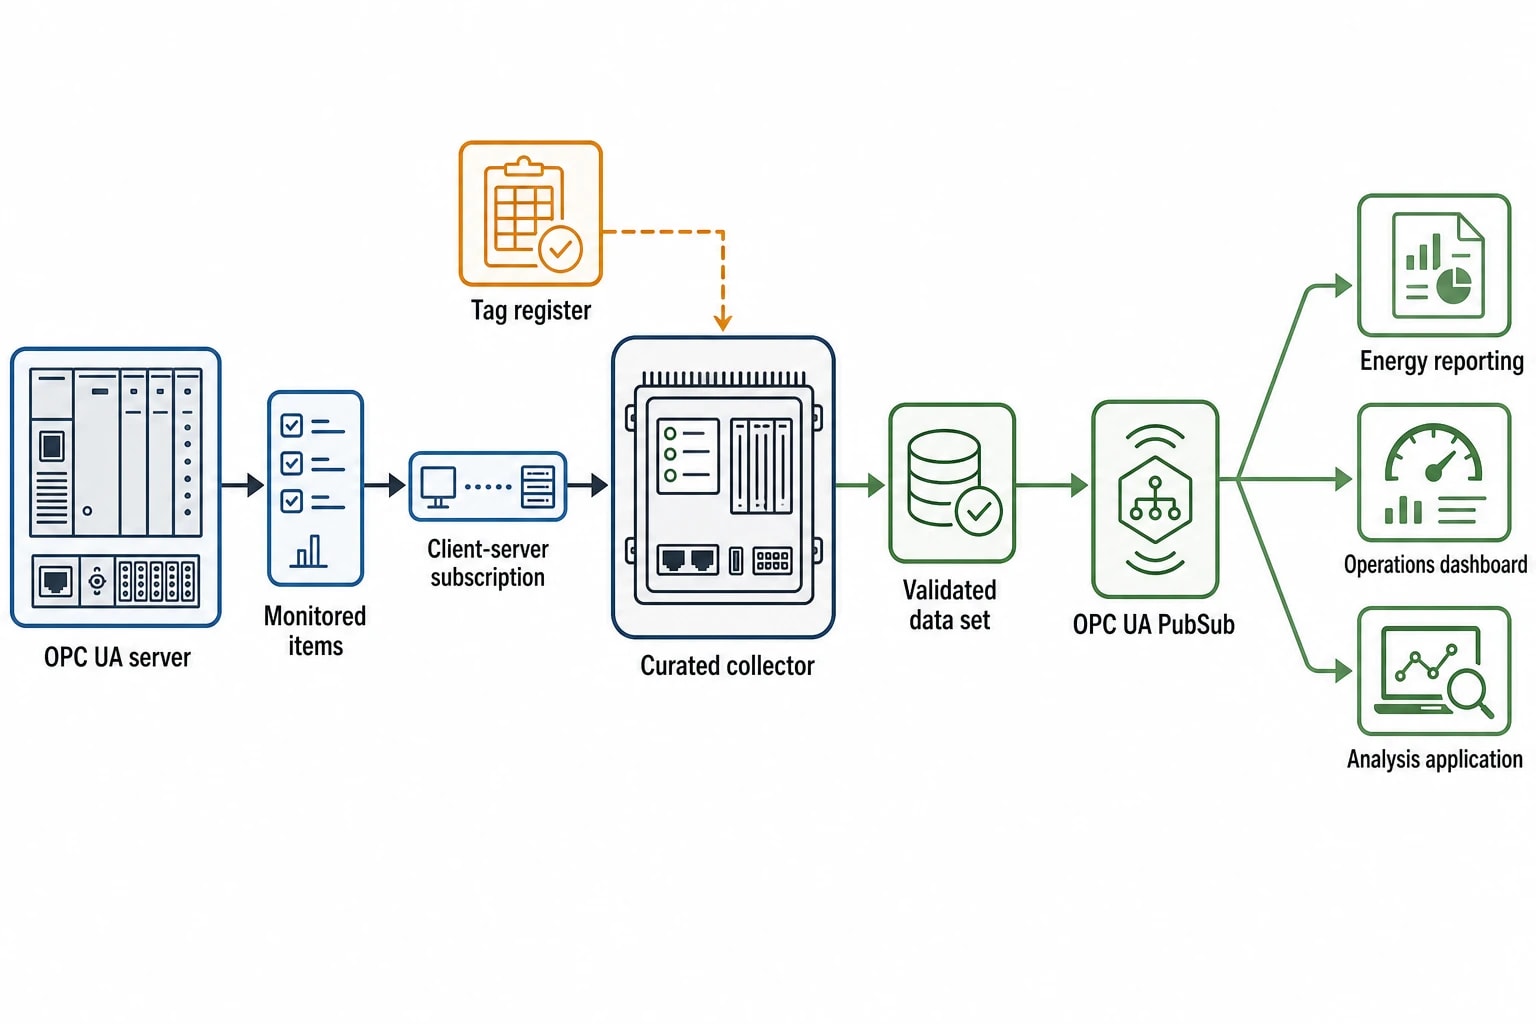
Client-server subscriptions are commonly the most direct method for a local collector to acquire selected values from a PLC, communications processor or OPC UA server. The relationship is explicit: the collector requests approved monitored items and the server reports them.
OPC UA PubSub, defined by IEC 62541-14, is a complementary publish-subscribe model. It can distribute a defined data set to several subscribers. That can be useful after a collector has assembled and validated a plant data set, particularly where several local applications need the same process context.
The key design decision remains at the PLC boundary. Production systems should expose only the approved variables required for energy and operational analysis. A single curated collector avoids separate dashboards, reporting tools and analytical applications each creating their own tag list and collection settings.
Define the PLC-facing tag set before configuring it
A tag register should exist before a subscription is configured. It should identify the PLC source, data type, unit, asset, normal range, collection interval, expected quality behaviour and business purpose.
| Tag | Asset context | Data use |
|---|---|---|
| Boiler gas total | Boiler train B | Fuel consumption by boiler and steam output |
| Reboiler steam flow | Distillation column C-204 | Steam per tonne of recovered product |
| Agitator active power | Reactor R-12 | Electricity per batch and phase |
| Compressor loaded state | Compressor house | Identification of unloaded running |
| Cooling-water flow | Condenser E-208 | Condenser duty investigation |
| Batch phase | Reactor R-12 | Start and end boundaries for energy allocation |
Engineers should use names that operations, maintenance and finance teams recognise. A label such as AI_1034 may be accurate in the PLC programme but remains inadequate as the sole identity in an energy model.

Track energy consumption, emissions, and process parameters with seamless PLC/SCADA integration via Modbus, OPC-UA, and MQTT protocols.
Build a chemical energy data model from PLC tags
Fast collection is only the first stage. The receiving platform must turn tags into a consistent model of utilities, assets and production.
OPC 34100, OPC UA for Energy Management, was published on 1 February 2025. It provides an information model for energy management that can scale from individual devices to complete plants. Its resource definitions include electricity, natural gas, compressed air, saturated steam, superheated steam, chilled water and fuel oils.
That structure helps prevent a familiar integration failure: an analyst receives values with a tag name and timestamp but cannot determine whether they represent mass flow, volume flow, energy total or electrical demand.
Map utilities to assets and production boundaries
Each high-value point should link to a hierarchy that makes sense in a chemical facility:
- Site and utility system, such as boiler house or compressed-air system.
- Area, such as solvent recovery or reactor suite.
- Asset, such as a reboiler, reactor, cooling tower or compressor.
- Measurement point, including its unit, direction and meter type.
- Production boundary, including batch, grade, campaign or throughput source.
A batch-energy record should use the batch-start and batch-complete signals specified by the process owner. It should include the appropriate meter totals or validated interval values, the product mass source and the recipe version. Engineers can then compare batches on an agreed basis rather than relying on shift notes.
Time alignment determines KPI credibility
The collection system should use a single time convention, normally UTC for underlying records, then present local time where operations need it. Clock synchronisation across PLCs, gateways, meters and historians requires commissioning checks. An apparent ten-minute steam lead over a batch phase may be a process clue or a clock discrepancy.
For each KPI, document the allocation rule. Steam consumed during reactor heat-up may belong to the batch. Boiler gas may require allocation across several users. Electricity at a shared motor control centre may need a sub-meter or a stated allocation method. The rule matters as much as the calculated result.
Turn real-time streams into specific energy investigations
A live feed supports repeatable comparison rather than a dashboard that only shows a current total. The method needs a defined peer group, baseline window, threshold and persistence rule.
A fixed method for batch steam performance
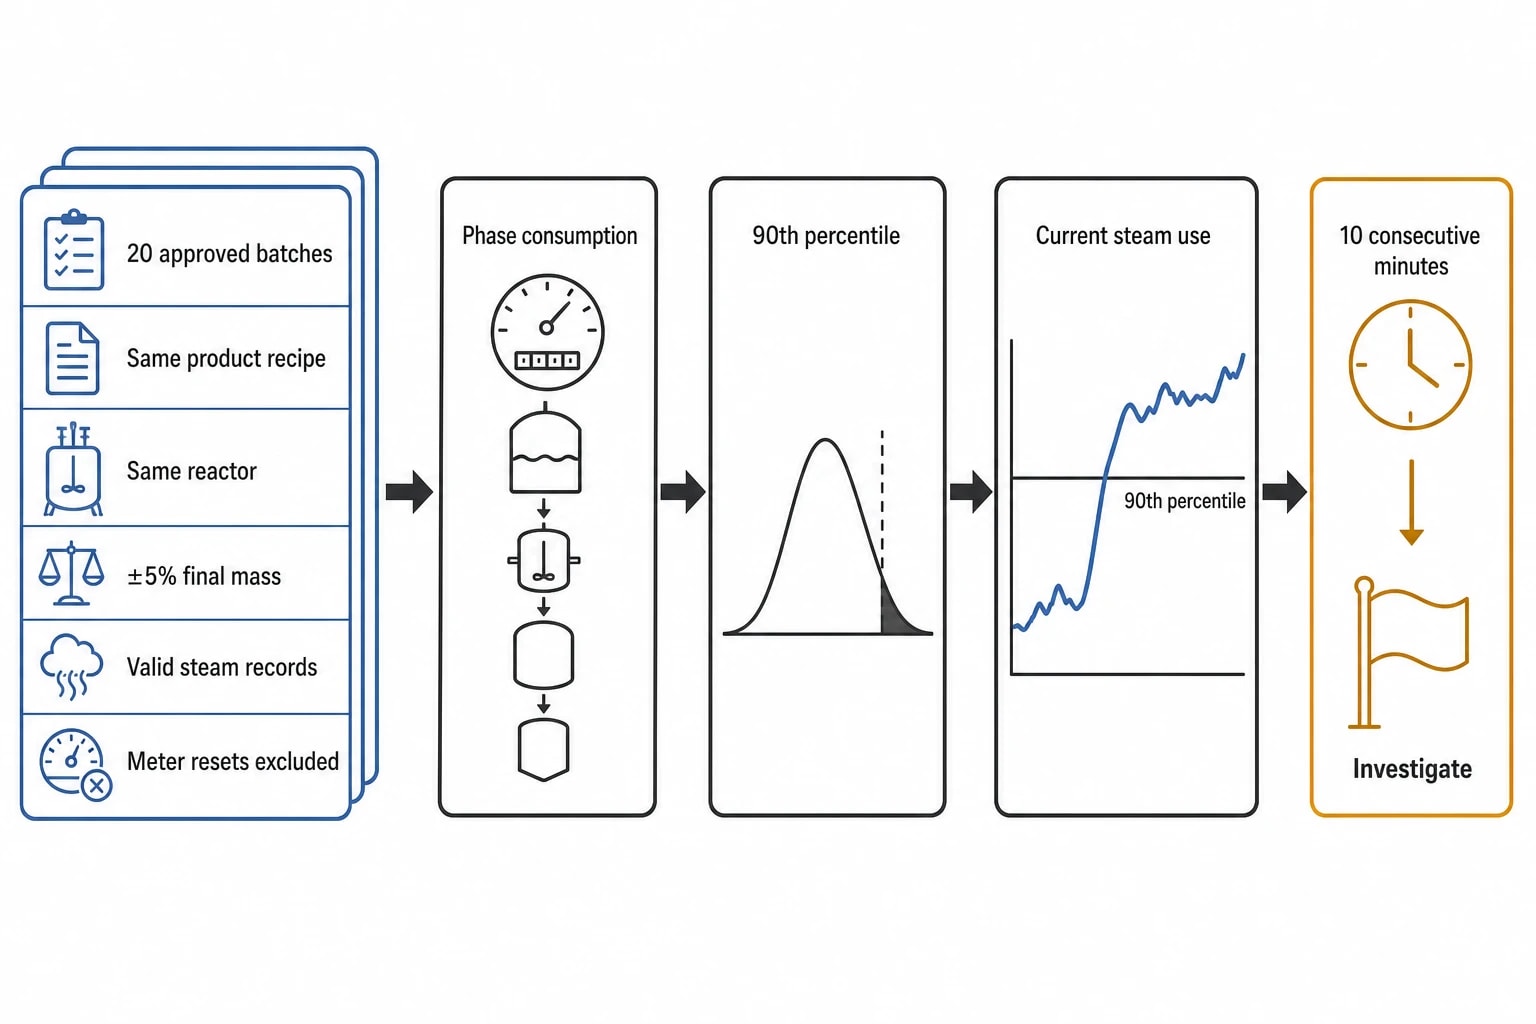
For a batch reactor, create a baseline from the last 20 completed, quality-approved batches that meet all of these conditions:
- The same product and recipe version
- The same reactor
- A final product mass within ±5% of the current batch
- No bad or uncertain steam-meter records during the measured phase
- No recorded utility-meter reset or unplanned shutdown
Calculate phase consumption from the difference between validated cumulative meter totals at phase start and phase end. Store the baseline median and 90th percentile for each recipe phase, such as heat-up, hold and distillation.
An initial alert rule can identify an actionable deviation: flag the current batch when its accumulated steam use exceeds the historical 90th percentile for the same phase and remains above that limit for ten consecutive minutes. The process and utilities teams should set the final threshold during commissioning, because a ten-minute rule may be unsuitable for a short reaction phase or a slow temperature ramp.
The alert should name the reactor, batch, phase, steam source, current consumption, matched baseline and data-quality status. This gives the shift team a starting point for checking steam control, condensate return, agitator behaviour, recipe execution or feed condition.
A fixed method for continuous distillation
For a distillation column, use fifteen-minute intervals and build a baseline from at least 30 production days. Exclude start-up, shutdown, cleaning, known maintenance periods and intervals with poor data quality. Group historical intervals by product grade and feed-rate band within ±5%.
For each group, calculate the median reboiler steam flow and 95th percentile from the retained intervals. Set the platform to flag an investigation when current steam flow remains above the matched 95th percentile for three consecutive fifteen-minute intervals while feed rate remains inside the selected band.
That 45-minute persistence rule filters brief control movements while retaining sustained excess demand. Engineers can then examine reflux, column pressure, feed composition, condenser performance, steam pressure and control-valve position over the same period.
Keep anomalies separate from proof of cause
A comparison rule identifies an exception. It does not diagnose the root cause.
A sustained steam deviation may arise from a steam trap failure, increased reflux, altered feed composition, heat-exchanger fouling, a control problem or a measurement fault. Real-time OPC UA data narrows the time window and assembles supporting evidence. Engineering investigation establishes the cause.
Commissioning real-time PLC data streaming OPC UA
A production-safe deployment begins with a limited, high-value area rather than a site-wide tag import. A distillation train, reactor suite or compressor house can provide enough variety to prove the approach.
Test the data before accepting the KPI
Commissioning should confirm:
- The correct PLC variables and engineering units
- Source and server timestamps
- Negotiated sampling and publishing intervals
- Tag quality transitions during controlled communication tests
- Queue behaviour and overflow indication
- Batch or production-state boundary signals
- Meter-total handling, including planned reset behaviour
- Reconciliation between collected data and local operator displays
Operators should review the asset names, batch boundaries and alert wording. Maintenance teams should review whether the selected data can support a practical fault investigation. Energy managers should approve the KPI allocation method and exclusions.
Reporting depends on traceable source data
ISO 50001:2018 provides the framework for an energy management system. UK Streamlined Energy and Carbon Reporting requires qualifying organisations to disclose energy and greenhouse-gas information, an intensity ratio and energy-efficiency actions.
A governed OPC UA stream supports this work when it preserves the original value, timestamp, unit, quality state and calculation rule. A documented batch-energy calculation can be reproduced. A missing-data period can be identified rather than disguised. An intensity metric such as energy per tonne can be traced back to the plant signals that produced it.
This article reflects the independent analysis and editorial opinion of EnerTherm Engineering. Product names, trademarks, and brands mentioned belong to their respective owners. EnerTherm Engineering is not affiliated with, endorsed by, or a licensee of any third-party software or product mentioned unless explicitly stated.

Technical Manager — EnerTherm Engineering
John Naranjo is Technical Manager at EnerTherm Engineering, bringing specialist expertise in chemical and environmental engineering. He recently led the implementation of Omni Vision, EnerTherm's real-time energy and utility monitoring platform. He holds an MSc in Environmental Engineering from the University of Huelva and a BSc in Chemical Engineering, with memberships in both the Energy Institute and IChemE.
