
Why Chemical Plants Choose Energy Management Software
ISO 50001, ATEX-compliant PLC connectivity and Scope I and II reporting.
UK organisations in scope of ESOS Phase 4 must submit their notification of compliance by 5 December 2027. For chemical manufacturers, that deadline exposes a familiar weakness: utility readings, batch records, production totals and carbon calculations often remain spread across separate spreadsheets.
Industrial energy management software gives those data sources a common operational purpose. It links energy consumption with process output, identifies abnormal demand while production teams can investigate it, and creates a controlled evidence base for energy and emissions reporting.
Chemical sites have little use for a monthly total showing that electricity or gas consumption rose. Plant leaders need to know whether a distillation train consumed more steam because throughput increased, whether a reactor heat-up cycle extended, whether cooling demand changed with ambient conditions, or whether a utility system drifted from expected performance.
That distinction drives the buying decision. The strongest platforms combine process-level metering, production-linked energy KPIs, documented data quality and reporting workflows suited to regulated industrial operations.
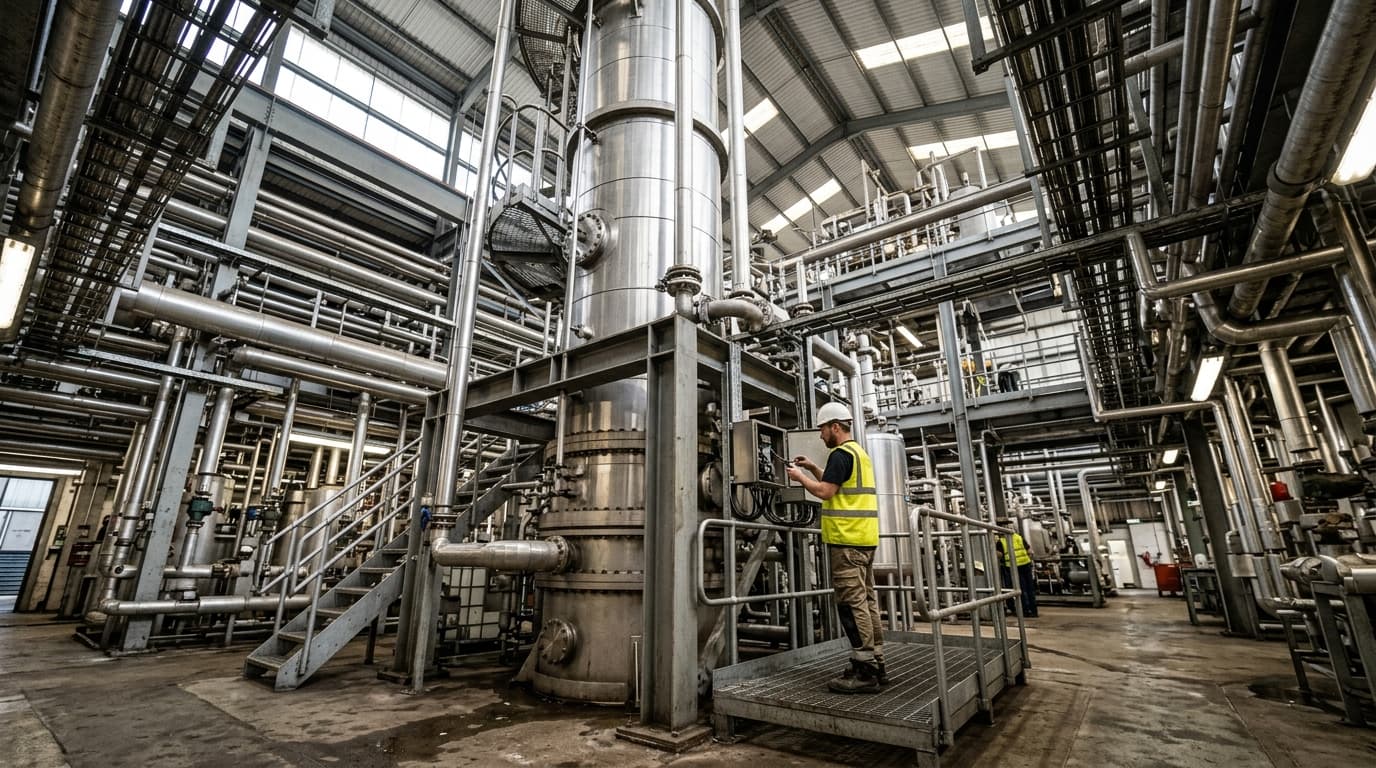
Omni Vision delivers turnkey utility metering, CO2 tracking, and AI-powered production KPI intelligence — giving you real-time dashboards and actionable insights across your entire facility.
Why spreadsheets fail chemical energy management
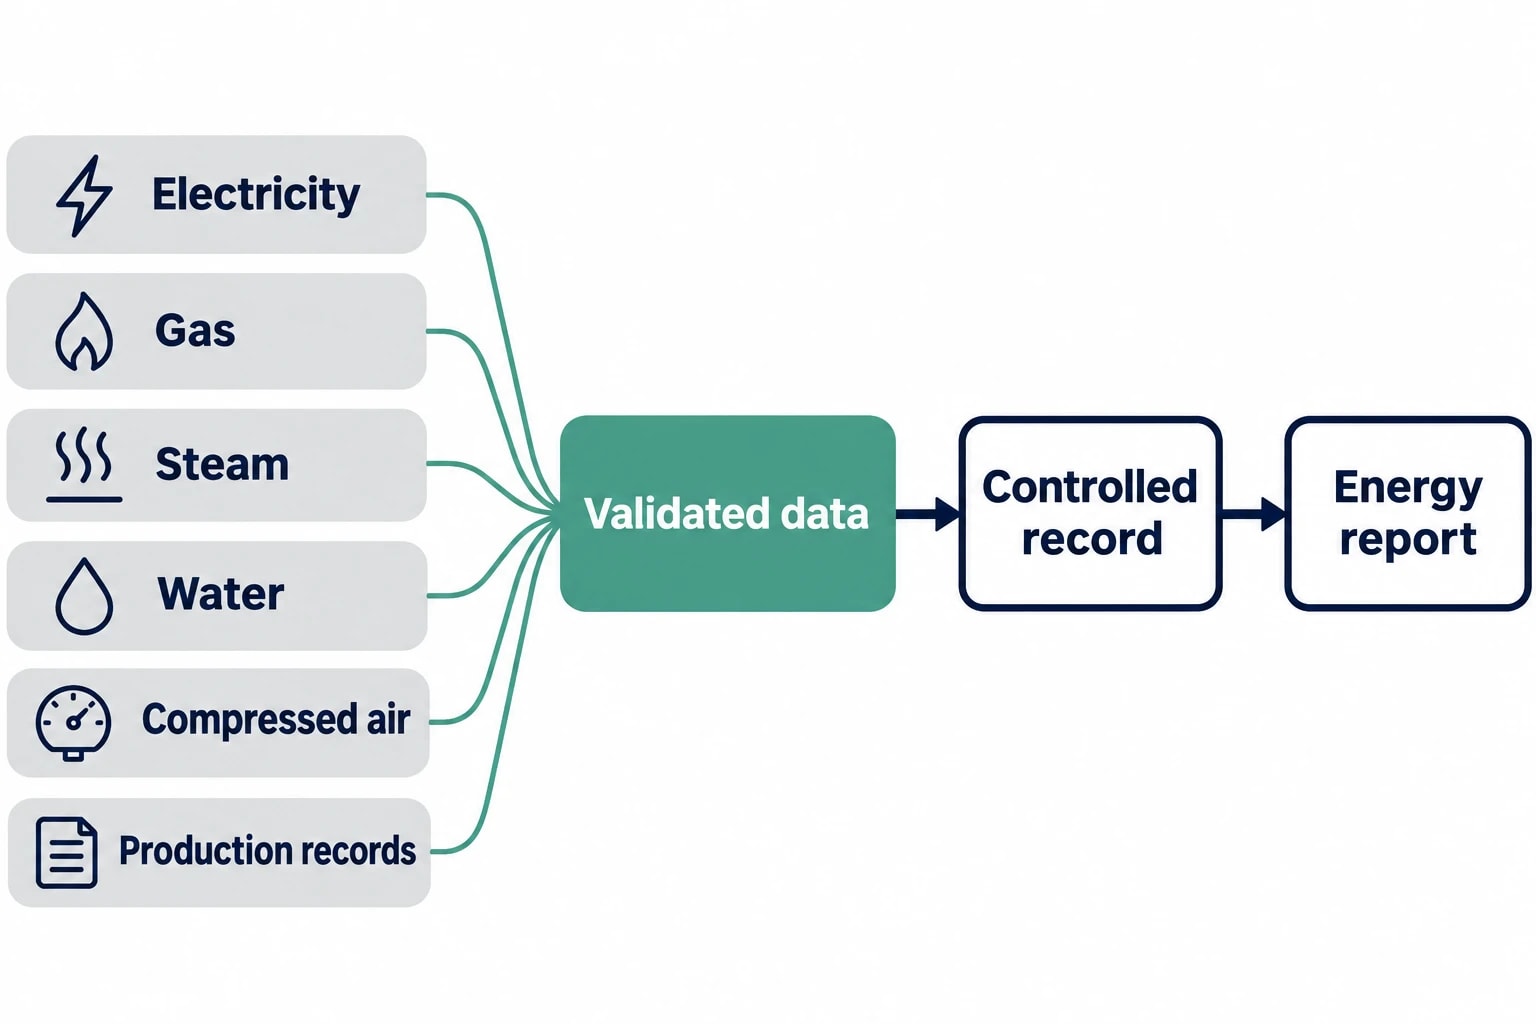
Spreadsheets remain valuable analysis tools, but struggle as the primary record for energy management in a live chemical plant.
A site may receive half-hourly electricity data, gas-meter readings, steam flow data, water consumption, compressed-air electricity use and production records from several systems. Staff must reconcile time periods, units, missing readings, allocation rules and changes in product mix. The workload grows quickly when a site runs campaigns, multiple grades or batch recipes.
The weaknesses appear in routine reporting.
- A site-level utility total can hide a deteriorating reboiler, steam leak, refrigeration problem or compressed-air baseload.
- Monthly reports arrive after the opportunity to investigate a deviation has passed.
- Manual data handling makes it difficult to preserve version control, assumptions and correction history.
- Energy-per-tonne figures become misleading when feedstock, concentration, batch size or production grade changes.
- Different departments can report different values for the same energy period.
- Carbon calculations require controlled emission factors and a clear methodology.
The issue is not spreadsheet arithmetic. It is traceability. A plant needs to show where each reported value came from, which process boundary it covers and how missing or estimated data were treated.
What to compare in industrial energy management software for chemical plants
A useful buying comparison starts with process boundaries and reporting obligations, rather than dashboard design.
Process-level utility coverage
Chemical production depends on several utility streams. Software should collect and contextualise the streams that matter to the site’s significant energy uses.
| Utility stream | Chemical-plant question | Example KPI |
|---|---|---|
| Electricity | Has compressor, pump or refrigeration demand increased? | kWh per tonne |
| Natural gas | Does boiler or thermal-oil demand follow production? | Fuel per tonne |
| Steam | Are reboilers, headers or tracing circuits consuming more than expected? | Steam per batch |
| Water | Has process, cooling or washdown demand changed? | m³ per tonne |
| Compressed air | Is demand continuing outside scheduled production? | kWh per m³ of compressed air |
| Oil | Does thermal demand match dryer or reactor operation? | Fuel cost per batch |
A plant does not need instrumentation on every pipe before it can improve energy performance. It needs a metering plan that prioritises significant energy users. Boiler houses, thermal-oil systems, distillation columns, reactor heating loops, refrigeration plant, large compressors and cooling towers are sensible starting points.
Buyers should establish how a platform handles existing meters, additional instrumentation, shared utilities and estimated values. Data-quality flags distinguish measured data from substituted or calculated figures, preventing false precision in management reports.
Production-linked energy KPIs
Cost per tonne is helpful only when the denominator represents comparable production. Batch operations may need energy per batch, recipe, campaign or unit operation. Continuous plants may need energy per tonne adjusted for grade, concentration and operating rate.
The chosen system should let teams define KPI boundaries that reflect the process. A distillation metric might include reboiler steam, condenser cooling and associated pumping, rather than allocating an entire building’s consumption to one column.
A rise in steam consumption can then be reviewed against throughput, feed condition, reflux ratio, batch duration, downtime and product specification. Process engineers gain a clearer starting point for investigation.
Data evidence and audit trail
Energy management software should provide a defensible route from a dashboard value to the underlying source data. That matters for internal management reviews, environmental permits, ESOS evidence packs and annual carbon reporting.
A procurement team should ask:
- Can users trace a reported figure to its meter, source record and timestamp?
- Does the platform preserve original readings when users correct or estimate data?
- Can teams document meter faults, maintenance events and calculation assumptions?
- Can authorised users review changes to KPIs, emission factors and reporting periods?
- Can records be exported for an energy assessor, finance team or regulator?
These questions reveal whether a system is a reporting display or a controlled management record.
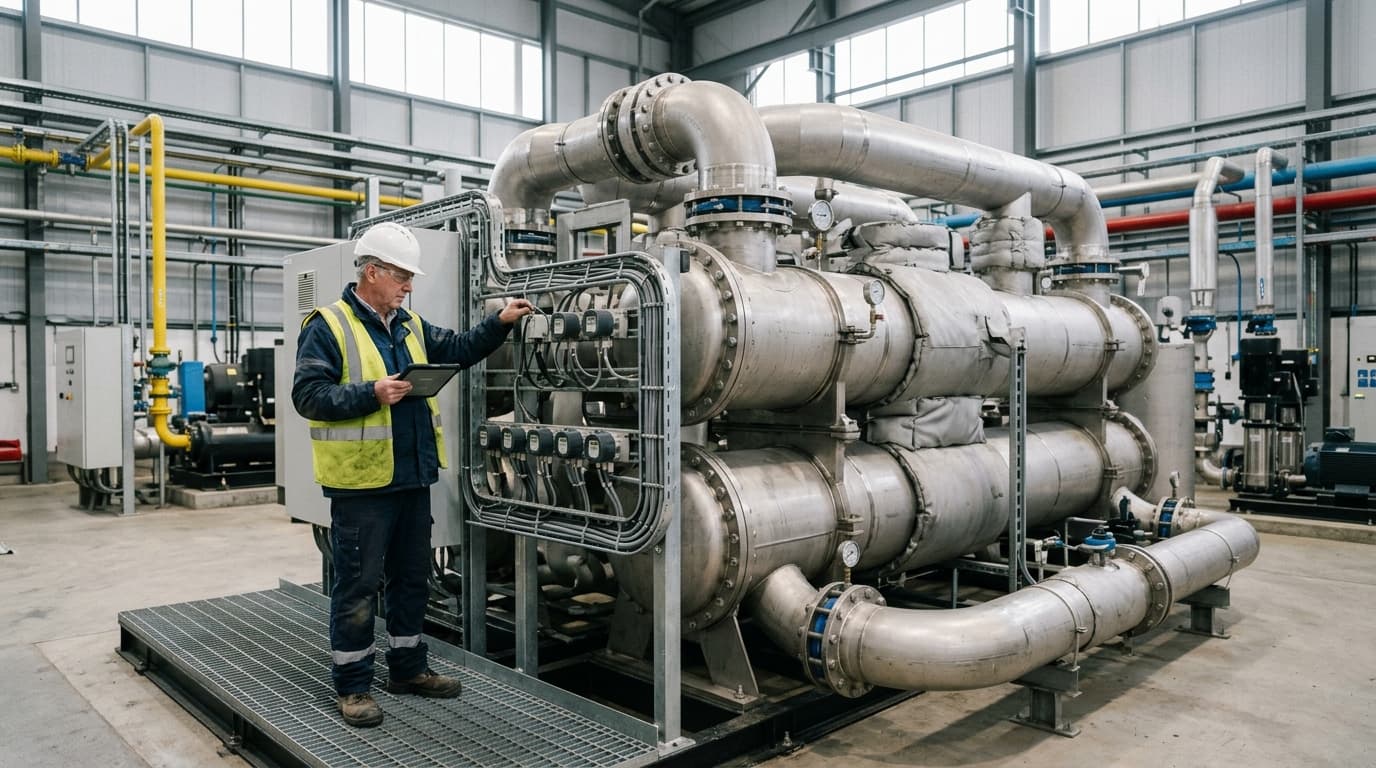
Track energy consumption, emissions, and process parameters with seamless PLC/SCADA integration via Modbus, OPC-UA, and MQTT protocols.
How energy intelligence supports chemical process optimisation
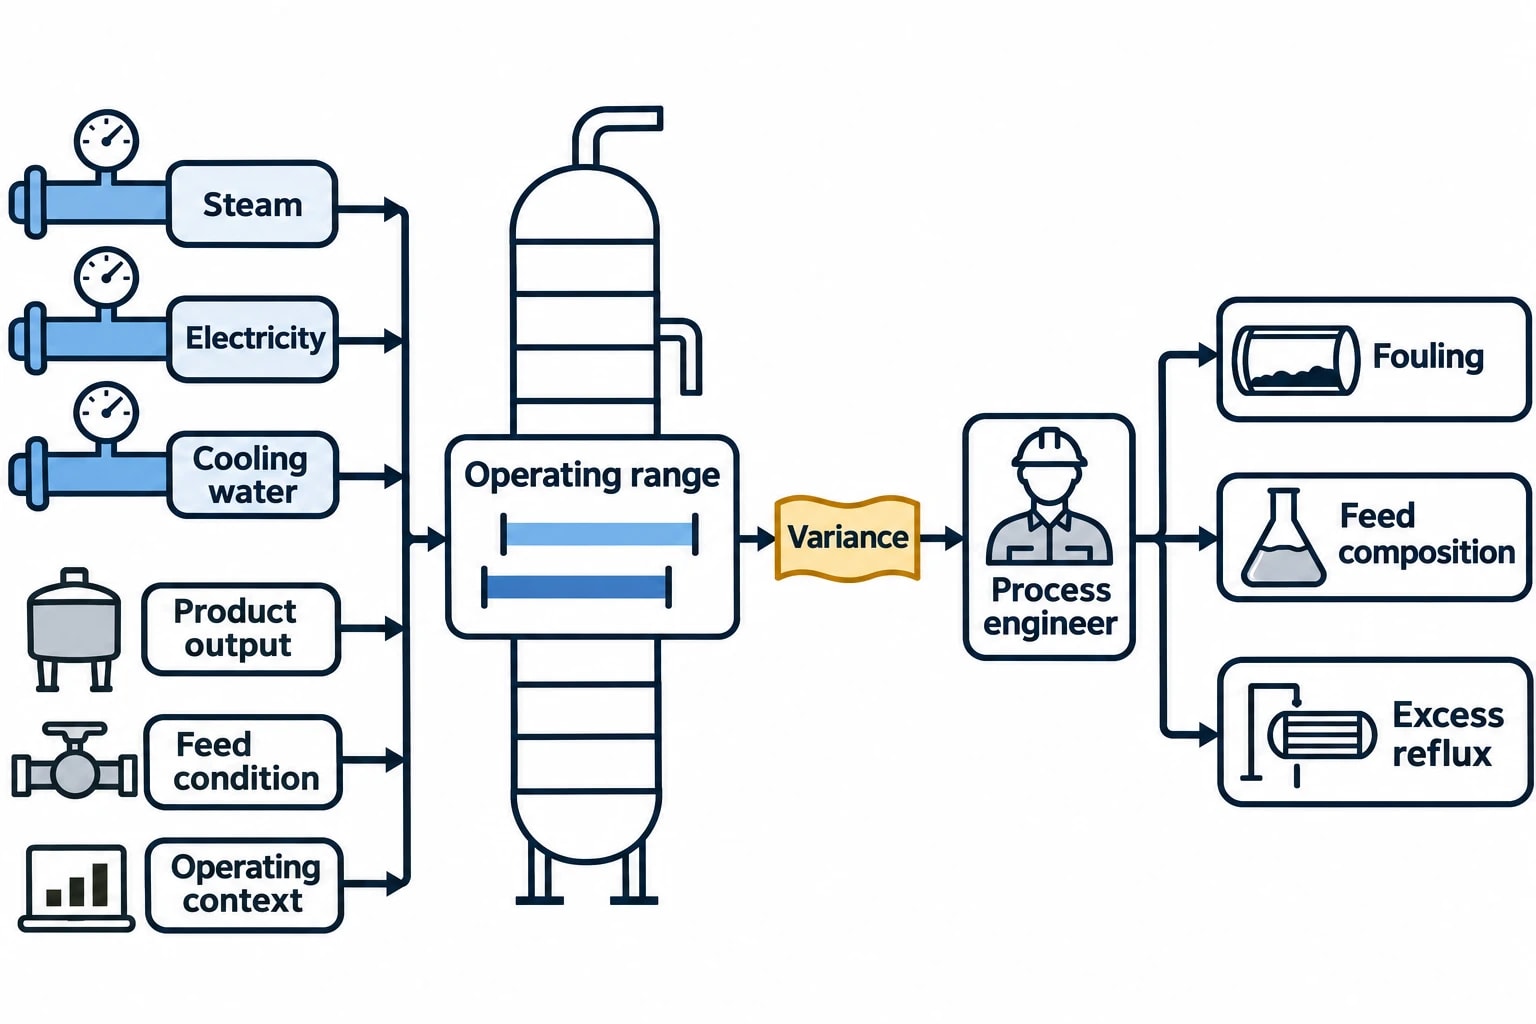
Energy use belongs to the process. A meaningful platform compares utility demand with output and operating context, allowing teams to distinguish expected variation from a performance issue.
Distillation and evaporation
Distillation offers a strong case for granular energy monitoring because thermal and cooling loads are closely tied to separation performance. Steam, electricity, cooling-water demand and output can establish an operating range for a product or campaign.
A departure from that range may prompt investigation into fouling, feed composition, insulation losses, excess reflux, control performance or operating practice. The software identifies a variance and provides context; process engineers determine the cause.
Batch distillation needs care. Energy per batch can vary materially with charge size, feed condition and product specification. Recording those attributes alongside utility consumption produces a fairer comparison across campaigns.
Evaporation systems follow the same principle. Steam consumption requires comparison with feed solids, evaporation duty, operating hours and final concentration. A single monthly gas figure cannot identify which part of that relationship changed.
Reactor heating and thermal systems
Reactor heating may use steam, thermal oil, hot water, electric heaters or direct firing. The energy profile should be reviewed against recipe stage, temperature ramp, hold period, batch mass and cycle time.
A longer heat-up period may arise from different starting conditions, a heat-transfer problem, recipe changes or production scheduling. Production-linked monitoring helps teams test those explanations without assuming that each deviation indicates a utility fault.
Thermal-oil and steam generation also need a wider boundary. A heater can perform acceptably at its own meter while distribution losses, tracing demand or unnecessary circulation increase consumption elsewhere on site. Metering major branches helps separate generation demand from downstream use.
Cooling, refrigeration and compressed air
Cooling towers, refrigeration systems and compressed-air plant can consume significant electricity beyond direct production periods. Interval data can identify overnight demand, weekend baseloads and operation that does not match the production schedule.
Cooling and refrigeration demand should be assessed alongside ambient conditions, process duty, water use and equipment status. This prevents teams from treating weather-driven demand as an equipment defect while making genuine deviations easier to see.
Compressed-air monitoring benefits from the same discipline. A stable baseload during shutdown periods may warrant investigation into leaks, inappropriate uses or equipment scheduling. The relevant KPI depends on plant conditions, but the evidence should connect compressor electricity use with air demand and operating hours.
Reporting requirements make data governance a buying criterion
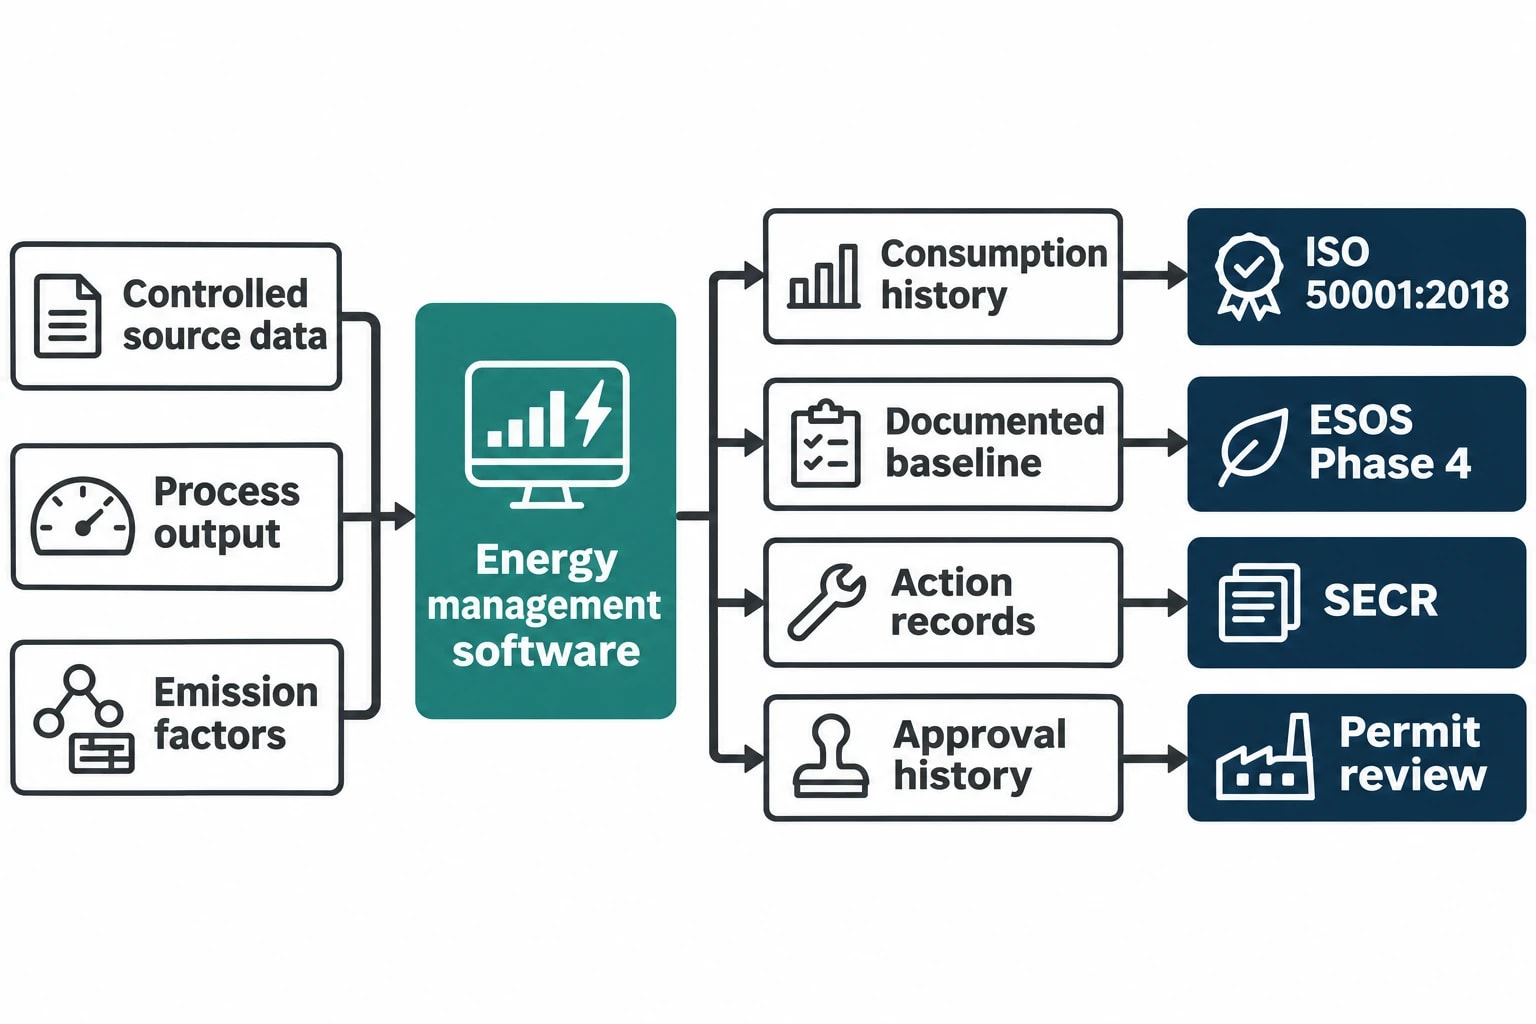
Energy management software does not replace an environmental permit, an ESOS assessment or a board-approved disclosure. It can provide a stronger information base for each obligation.
ISO 50001:2018 and energy performance evidence
ISO 50001:2018 provides a framework for establishing, implementing, maintaining and improving an energy management system. It emphasises energy review, significant energy uses, energy performance indicators, baselines, objectives and continual improvement.
Software supports this work when it gives teams reliable consumption history, process-level KPIs, documented baselines and records of completed actions. Certification remains a separate management-system and assurance process. The platform should make evidence easier to assemble and review.
For chemical plants, the practical value lies in repeatability. A site can assess the same distillation train, steam header or reactor line against an agreed boundary over successive periods, rather than rebuilding calculations for each review.
ESOS Phase 4 requirements
ESOS applies to qualifying large UK undertakings and requires an assessment of energy used in buildings, industrial processes and transport. Significant energy consumption must account for at least 95% of total energy consumption.
Phase 4 also requires participants to report energy savings achieved from implemented measures and explain proposed measures that were not implemented. These requirements increase the value of retained project records, measured energy data and clear baselines.
A central system can provide consumption history, evidence of implemented actions and supporting notes. Qualifying organisations still need to follow the required ESOS route, appoint a lead assessor where required and obtain responsible-officer sign-off.
SECR and Scope 1 and 2 emissions
Streamlined Energy and Carbon Reporting requires qualifying UK companies and LLPs to disclose energy and carbon information in annual reporting. Government guidance requires relevant Scope 1 and Scope 2 emissions disclosures, alongside energy consumption, an intensity ratio, energy-efficiency actions and the methodology used.
Scope 1 emissions include direct emissions from sources owned or controlled by an organisation, such as on-site boiler combustion. Scope 2 emissions arise from purchased electricity, heat, steam and cooling.
A credible workflow requires controlled source data, documented emission factors, clear organisational boundaries and an approval history. Industrial energy management software can aggregate data and automate repeatable calculations, while reporting teams retain responsibility for methodology and completeness.
Environmental permits and industrial emissions
For chemical installations in England, environmental permitting requirements include energy-efficiency measures and best available techniques. The Environment Agency states that operators must demonstrate how they will meet relevant energy-efficiency requirements in environmental permit applications and permit reviews.
The EU Industrial Emissions Directive, Directive 2010/75/EU, as amended by Directive (EU) 2024/1785, bases permit conditions on best available techniques and covers energy and resource efficiency. Chemical businesses operating in the EU should assess applicable permit conditions and sector-specific BAT conclusions.
Energy intelligence software does not demonstrate BAT compliance by itself. It gives operators a reliable record of energy performance, variation and improvement activity that can support permit management.
Where Omni Vision fits in a chemical-plant buying decision
Omni Vision is positioned as an energy intelligence platform for industrial sites moving from manual reporting to centralised energy management. For chemical plants, its usefulness depends on the quality of the metering plan, the relevance of the chosen KPIs and the discipline applied to data validation.
The platform combines utility data for electricity, gas, water, steam, compressed air and oil with production measures such as energy per batch and cost per tonne. Its analytics support anomaly detection, consumption forecasting and Scope 1 and Scope 2 CO₂e reporting.
A deployment should begin with a survey of significant energy uses, available source data and reporting requirements. Teams should then agree KPI boundaries, validate initial data and set operating priorities. Suitable first targets could include:
- Investigating abnormal reboiler steam use.
- Reducing compressed-air demand outside production hours.
- Establishing boiler-house and thermal-oil performance indicators.
- Creating repeatable evidence for ESOS, SECR and internal energy reviews.
- Comparing reactor heat-up performance across comparable batches.
EnerTherm Engineering describes Omni Vision as a turnkey platform delivered over an 8 to 16 week deployment model. Plant teams should validate project timing against the site’s instrumentation condition, production schedule, data availability and governance requirements.
This article reflects the independent analysis and editorial opinion of EnerTherm Engineering. Product names, trademarks, and brands mentioned belong to their respective owners. EnerTherm Engineering is not affiliated with, endorsed by, or a licensee of any third-party software or product mentioned unless explicitly stated.

Simulation Engineer — EnerTherm Engineering
Rajesh Sekar is a Simulation Engineer at EnerTherm Engineering, specialising in computational fluid dynamics (CFD), finite element analysis (FEA), and thermal process simulation. He holds a degree from Cranfield University and brings extensive experience in simulation-based product development from the automotive, aerospace, and energy sectors.
