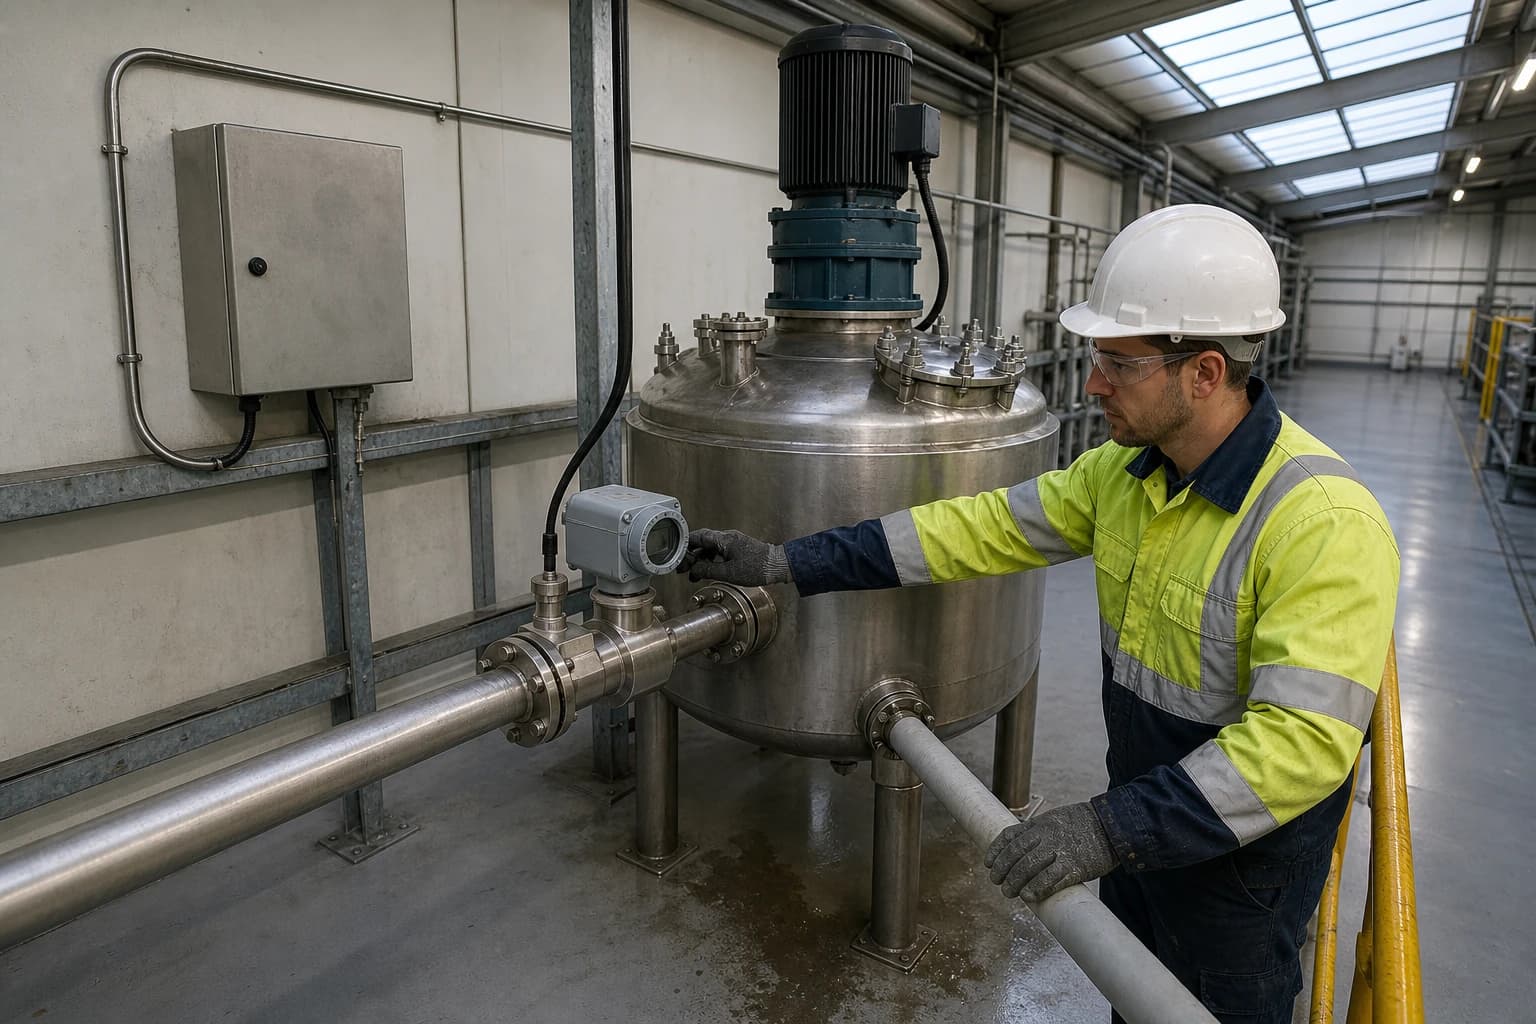
Chemical Reactor Batches Need Energy and Emissions Tracking
Automated steam, gas and electricity metering links batch costs to Scope I and II reporting.
Energy and emissions tracking for chemical reactors measures and allocates utility consumption and associated Scope 1 and 2 emissions to each defined production batch. The Environment Agency requires qualifying organisations to submit their ESOS Phase 4 notification of compliance by 5 December 2027.
A reactor batch can finish in hours or days, while a site utility invoice records a month. That gap leaves process engineers trying to explain a high energy bill after the batch evidence has faded into shift notes, historian records and production reports.
Batch chemical manufacture produces a distinct utility signature. Charging, agitation, heating, reaction hold, cooling, transfer and cleaning each change demand for electricity, steam, gas, water and compressed air. A monthly site total cannot show whether a higher energy bill came from an unusually long heat-up, an extended hold, repeated cleaning, a lower charge temperature or a genuine change in process performance.
The batch identifier should link the production and utility records. This creates measures that production, engineering, finance and sustainability teams can use: energy per batch, cost per batch and CO₂e per batch.
Why energy and emissions tracking for chemical reactors needs a batch boundary
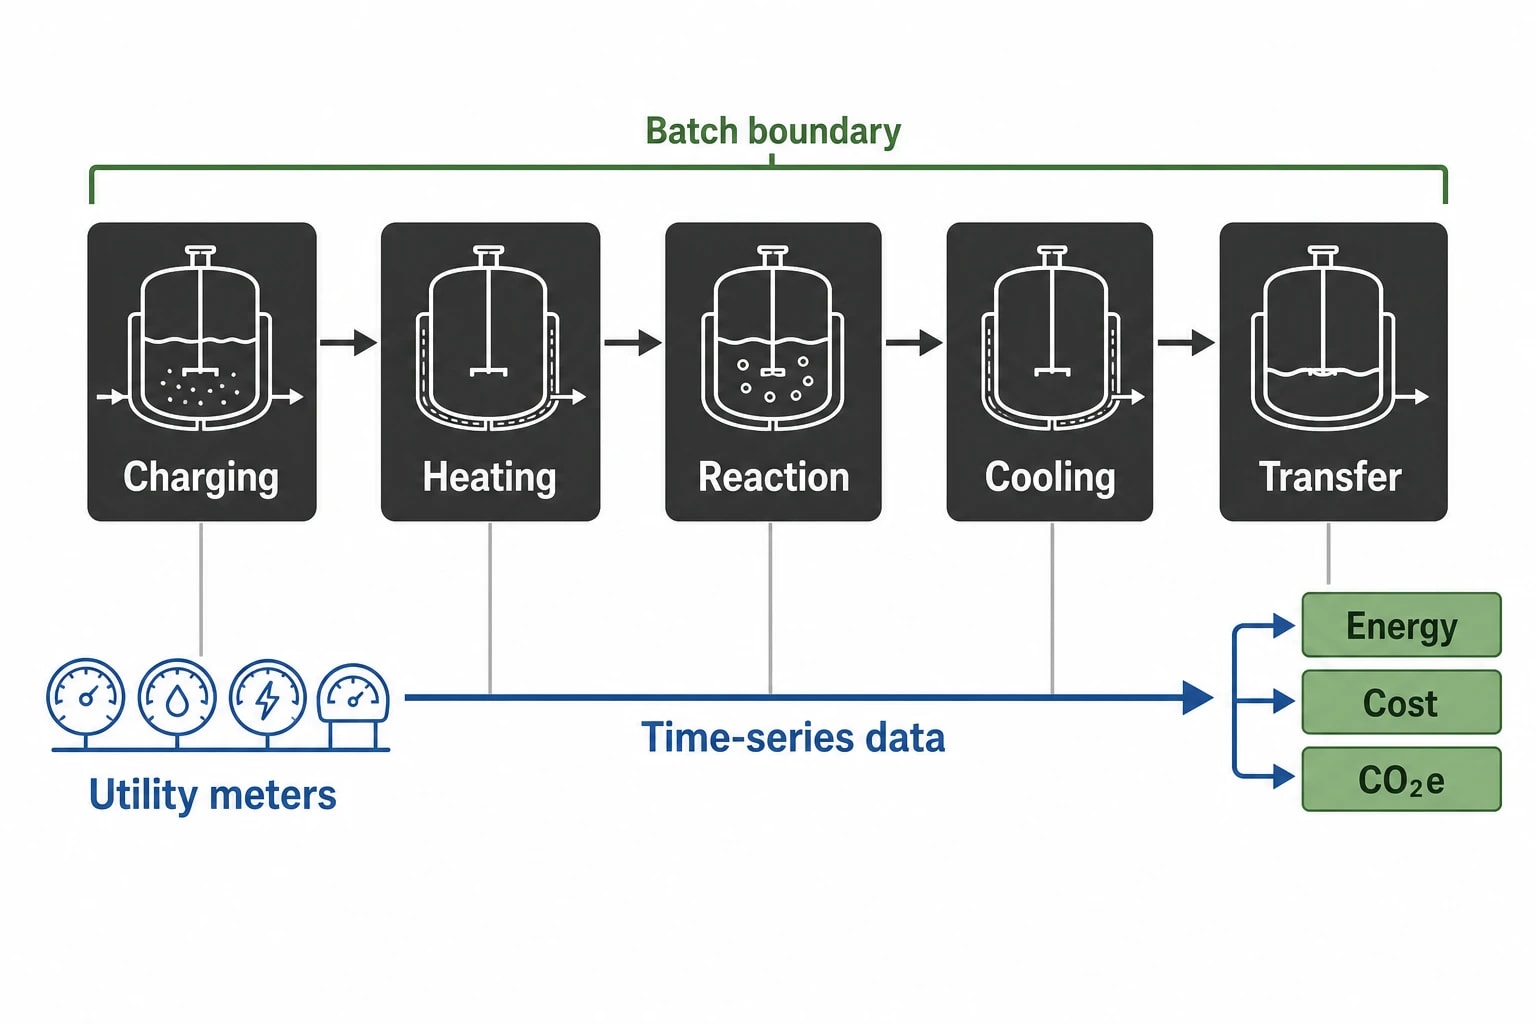
A utility bill measures consumption at a financial boundary. A reactor energy KPI needs an operational boundary. The distinction determines whether a plant can investigate a deviation or merely report it.
A batch has a start, finish and defined product outcome
The first task is to define what belongs within the batch. For most reactors, the boundary begins when the process starts consuming utilities for the batch and ends after transfer, or after a separately defined post-batch activity. Clean-in-place, standby and shared services need explicit treatment rather than assumption.
A sound batch record normally includes:
- Batch identifier, reactor number and product family
- Recipe version and target batch mass or volume
- Stage timestamps for charging, heating, reaction, cooling and transfer
- Actual temperatures and relevant setpoints
- Agitator status and run time
- Yield, rework and quality disposition
- Cleaning-cycle identifier, where cleaning is allocated to production
- Utility-meter identifiers and allocation method
A multi-product facility may set separate boundaries for a polymerisation batch, a neutralisation batch and a solvent-recovery campaign. The important point is consistency within a comparison group.
Site totals flatten the operating sequence
Consider two batches of the same grade. Both meet the same yield target, but one takes an additional hour to reach temperature. The difference may arise from a colder charge, reduced jacket heat transfer, steam-control behaviour, lower steam pressure or a revised operating sequence. A monthly gas total offers no practical route to identify the cause.
The same problem appears during cooling. A reactor can draw heating and cooling utilities at overlapping times when control performance, operating practice or a recipe transition requires review. Metered time-series data aligned with batch stages turns that pattern into an investigation point.
Batch-linked tracking also distinguishes product mix from poor performance. A high-viscosity grade may require more agitation, while an endothermic reaction may require more heat. A smaller batch can have a higher kWh-per-tonne result because fixed losses are spread across less saleable product. Comparing unlike batches produces misleading conclusions.

Omni Vision delivers turnkey utility metering, CO2 tracking, and AI-powered production KPI intelligence — giving you real-time dashboards and actionable insights across your entire facility.
Energy per batch is the reactor performance KPI
Energy per batch is the total energy assigned to a defined reactor run. It can be expressed as kWh per batch, kWh per tonne, kWh per m³, utility cost per batch or CO₂e per batch. Each metric answers a different production question.
Choose the denominator that matches the decision
Total kWh per batch helps a production manager compare repeat runs of the same recipe. kWh per tonne is useful where batch mass varies. CO₂e per tonne links energy performance to emissions reporting and product-level improvement work.
A plant should not force several products into one target. Group comparable batches by variables that materially affect demand, including product family, reactor, batch-size band, recipe revision and, where relevant, seasonal cooling conditions.
| KPI | Primary use | Useful comparison |
|---|---|---|
| Total kWh per batch | Identify whole-batch outliers | Same product and reactor |
| Steam per batch | Review thermal duty and heat-up performance | Same charge temperature and recipe |
| Electricity per batch | Review agitation, pumping and vacuum demand | Same product and batch mass |
| Gas per batch | Track direct-fired demand or allocated boiler fuel | Same utility boundary |
| Cost per batch | Support production costing | Same tariff period and product group |
| CO₂e per batch | Monitor Scope 1 and 2 intensity | Same reporting-factor year |
A single total can hide the reason for a change. Splitting the KPI by utility creates a clearer diagnostic picture. Higher steam with stable electricity points to thermal demand. Higher electricity with stable steam may require review of agitation, vacuum, pumps or auxiliary equipment.
Track stages as well as totals
The most useful comparisons separate the batch into operational stages. A reactor can meet its total energy target while showing poor control at one stage that becomes costly during a larger campaign.
Typical review questions include:
- Did steam demand fall once the reactor reached the temperature setpoint?
- Did agitation continue through a production delay?
- Did cooling demand rise during a hold period?
- Did the heat-up profile lengthen across successive campaigns?
- Did cleaning consume more hot water or steam than comparable completed batches?
- Did lower yield increase energy per tonne of saleable product?
Process teams should investigate deviations with the process record, not treat them as automatic waste. Safety constraints, quality requirements and altered feedstock properties can justify a higher energy input. The KPI provides a disciplined route to record the reason and decide whether action is required.
Metering boundaries determine the quality of the reactor KPI
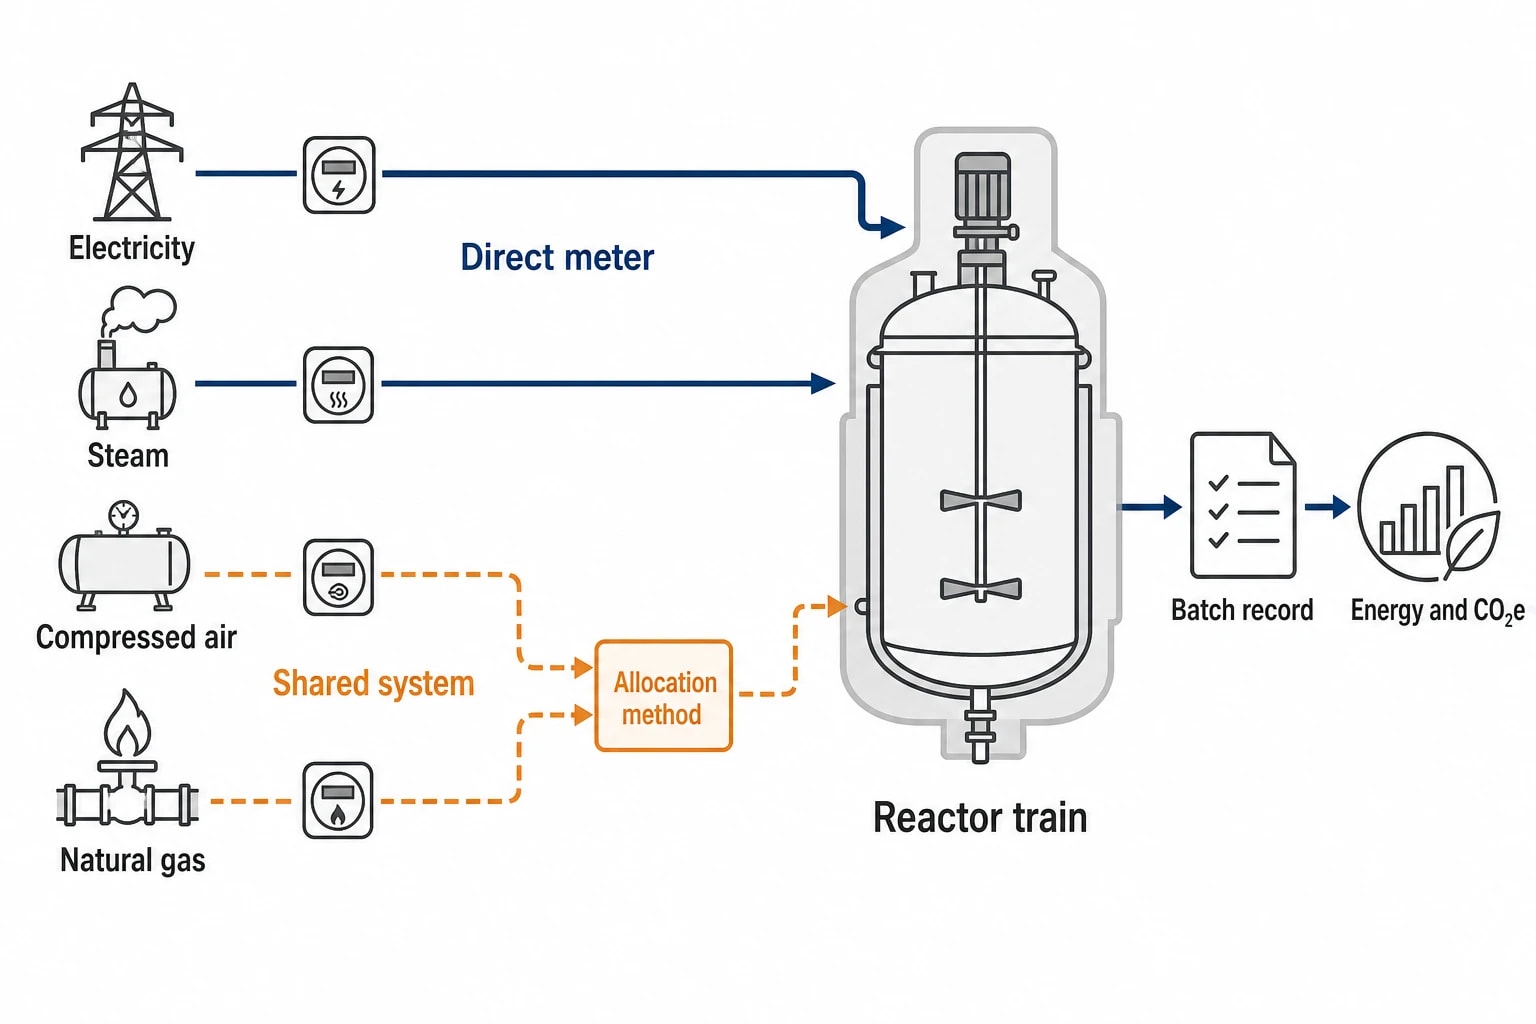
A batch energy figure is only as credible as its measurement boundary. Measuring a reactor motor alone may identify agitation load, but it will not capture circulation pumps, vacuum systems, trace heating or a shared cooling skid. Measuring only boiler-house fuel presents a different issue: it captures generation energy but needs a documented allocation route to the reactor.
Map each utility to its physical role
Chemical reactor areas commonly need a combination of the following streams.
| Utility stream | Reactor activity represented | Energy and emissions use |
|---|---|---|
| Electricity | Agitators, pumps, vacuum equipment and auxiliaries | Scope 2 activity data where purchased |
| Natural gas | Direct-fired equipment or boiler fuel | Scope 1 activity data where fuel is combusted on site |
| Steam | Jacket heating, distillation duty and cleaning | Thermal performance and fuel allocation |
| Water | Cooling, washing and cleaning | Process and cleaning performance |
| Compressed air | Pneumatic valves and instruments | Utility demand linked to batch activity |
| Thermal oil or fuel oil | Heating systems, where used | Energy allocation and Scope 1 activity data where combusted on site |
Steam requires particular care. Steam mass flow at the reactor jacket does not automatically represent useful heat transferred to the batch. Supply pressure, condensate return, flash steam, control-valve behaviour and the agreed energy boundary affect interpretation. A thermal review should establish what the meter represents before setting a target.
Direct measurement is stronger than broad allocation
Direct utility measurement at the reactor or reactor train provides the clearest evidence for a batch KPI. Shared systems often require allocation, particularly boiler plant, central chilled water, compressed air and common clean-in-place services.
An allocation method should be documented and retained with the calculation. Suitable methods include measured steam flow to a reactor train, a heat-meter reading, a defined share based on verified operating hours, or a mass-based approach where direct measurement is impractical. Review the method when the utility arrangement, recipe or production configuration changes.
A weak method does not become reliable through repeated use in a spreadsheet. The control lies in naming the source meter, defining the boundary, preserving the calculation and recording assumptions.

Track energy consumption, emissions, and process parameters with seamless PLC/SCADA integration via Modbus, OPC-UA, and MQTT protocols.
Scope 1 and 2 reporting needs traceable reactor activity data
The Streamlined Energy and Carbon Reporting framework requires energy and greenhouse-gas reporting from UK quoted companies, and from qualifying large unquoted companies and limited liability partnerships. Large unquoted organisations and LLPs fall within scope when they meet at least two relevant thresholds for employees, turnover and balance-sheet total, subject to applicable exemptions.
Reactor-level tracking does not replace organisation-wide annual disclosure. It provides activity data to explain reported consumption, test calculations and identify the process areas behind a change in emissions.
Keep Scope 1 and Scope 2 activity data separate
Scope 1 covers direct emissions from sources owned or controlled by the reporting organisation. For a chemical plant, this includes fuel combustion in an owned or controlled boiler, furnace or direct-fired process heater. Metered natural-gas use can therefore support allocation of boiler-related fuel emissions to reactor batches.
Scope 2 covers purchased electricity, heat, steam and cooling consumed by the organisation. Electricity measured at a reactor panel, pump skid or vacuum system can support Scope 2 activity data where it is purchased. Purchased steam and purchased cooling also belong within Scope 2.
A reactor energy dashboard should not combine these categories without retaining their origin. A kilogram of CO₂e assigned to a batch needs a clear route back to the energy quantity, utility source, reporting scope and conversion factor applied.
Energy monitoring will not quantify all direct chemical-process emissions. Where a reaction releases greenhouse gases, the site needs a separate measurement or calculation method. Treating fuel consumption as a proxy for those process emissions would misstate the Scope 1 inventory.
Apply current government conversion factors with version control
The Department for Energy Security and Net Zero publishes annual greenhouse-gas conversion factors for company reporting. The 2026 factors support calculation from activity data including fuel volumes and purchased electricity in kWh, and are relevant to SECR reporting.
For each reporting period, the batch-level record should retain:
- The meter identifier and metered energy quantity.
- The reactor, batch identifier and time interval.
- The utility source and Scope 1 or Scope 2 classification.
- The government conversion-factor set applied.
- The allocation method for shared generation or services.
- Corrections, approvals and the reason for each change.
This structure allows a sustainability team to trace an annual reported value to a physical measurement and the production event that used the energy. It also prevents applying a new conversion factor to historical activity data without retaining the factor used for the earlier disclosure.
ISO 50001 makes energy baselines useful to production teams
ISO 50001:2018 remains current. The standard sets out an energy-management framework and uses energy performance indicators, known as EnPIs, and energy baselines to monitor energy-performance improvement.
A site-wide kWh figure may suit annual reporting, but it gives little control over variable batch processes. A reactor-level EnPI can connect energy performance to the operating variables that drive demand.
Build the baseline from comparable completed batches
A reactor baseline should use a defined historic population of comparable batches. The site should document inclusion criteria, data exclusions and variables that affect consumption. A batch interrupted by a planned shutdown, an exceptional quality event or unusual feedstock conditions may remain part of the record but should not distort the normal operating baseline.
The baseline needs review after material change, including:
- A recipe or raw-material change
- A new batch-size range
- Repaired or modified heat-transfer equipment
- A changed steam, cooling or vacuum arrangement
- A change in the definition of saleable output
- A revised meter boundary or allocation method
The goal is a stable reference that recognises justified production variation. A target based on unrelated grades can encourage poor operational decisions, including pressure to shorten a heat-up or hold that the process requires.
Make review part of batch close-out
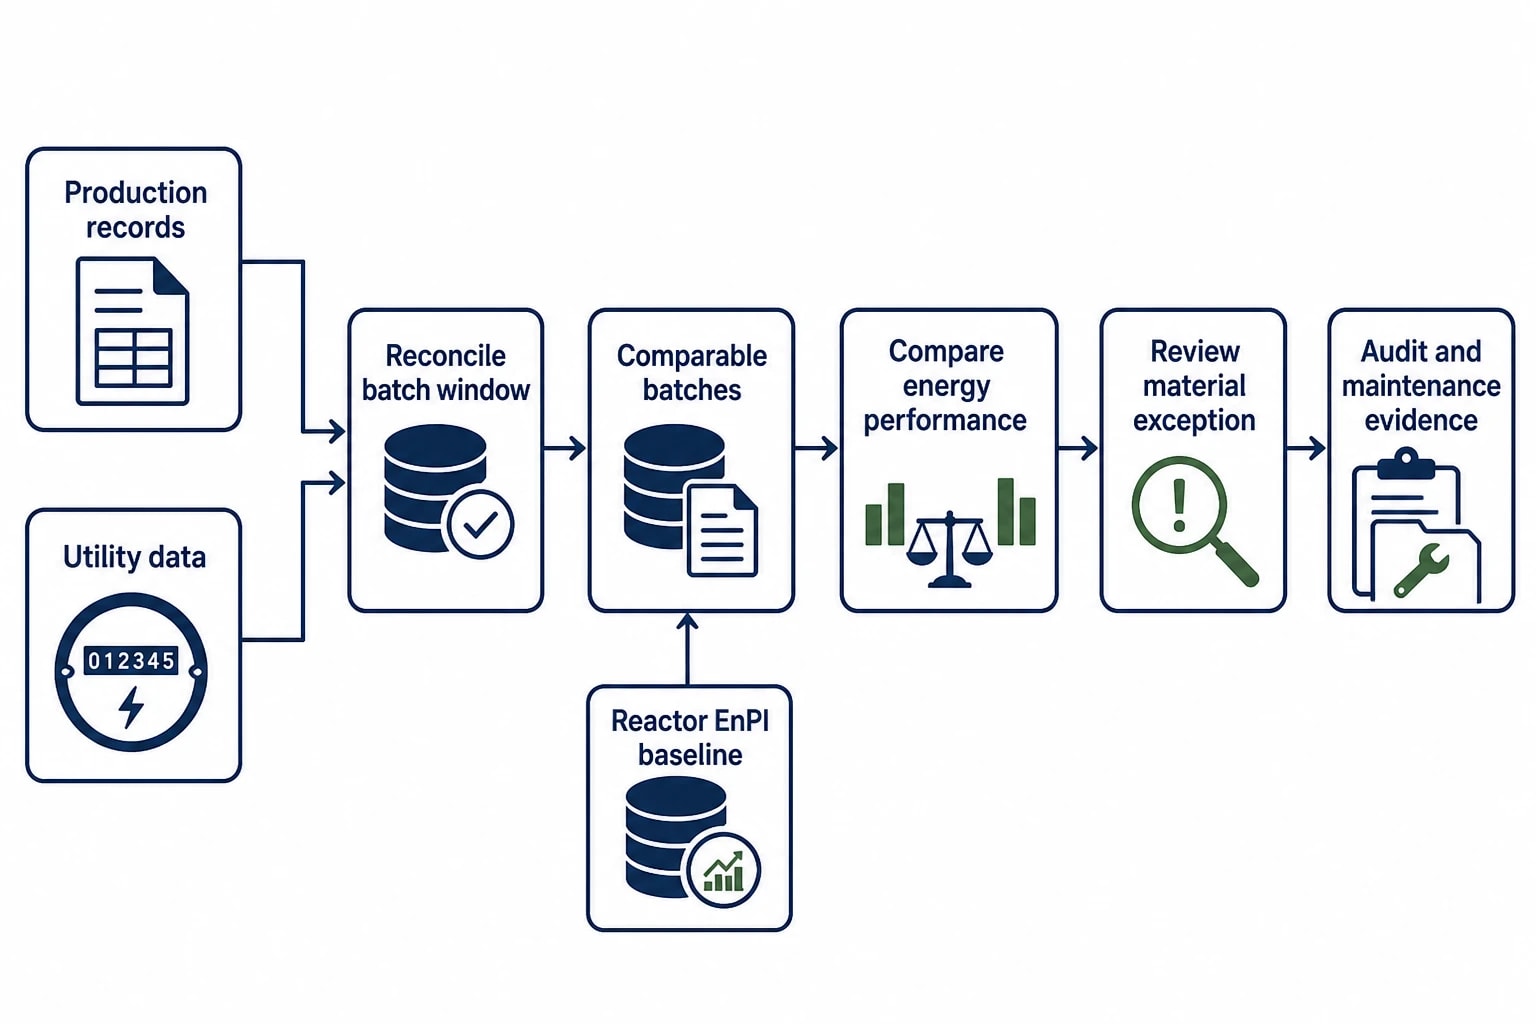
A practical control process places energy review alongside batch reconciliation. At batch close-out, production records completed mass, yield, product grade and batch status. The agreed utility data is then reconciled to the batch time window, with shared utilities allocated under the documented method.
An engineer reviews material exceptions against the comparable-batch baseline. The team records whether an exception arose from planned operating conditions, a process problem, a utility-system issue, a data-quality issue or an unresolved cause. That history supports later audits and gives maintenance teams evidence for targeted work.
ESOS Phase 4 raises the value of measured reactor savings
ESOS is a mandatory UK energy-assessment scheme for qualifying large undertakings. Under the Environment Agency’s Phase 4 guidance, participants must report progress against action-plan commitments in their ESOS assessment. The report and notification of compliance must include achieved energy savings, implemented measures, the level of savings achieved and the category for each saving.
Batch evidence improves before-and-after comparisons
A chemical site may identify an opportunity to repair insulation, improve condensate return, revise a heating sequence, reduce unnecessary agitation or improve cleaning performance. Annual site totals may move for many reasons, including product mix and production volume. Comparable batches provide a more relevant basis for assessing a measure.
The evidence should define the period before the change, the period after the change, the products included and the operating variables that differed. Where an expected saving does not appear, teams can check commissioning records, recipe changes, operator practice and meter quality before presenting the outcome as an ESOS saving.
Phase 4 also allows reduced obligations for participants that comply solely through certified ISO 50001, where certification covers total or significant energy consumption as applicable. That route increases the importance of credible EnPIs and baselines for significant energy uses such as chemical reactor systems.
This article reflects the independent analysis and editorial opinion of EnerTherm Engineering. Product names, trademarks, and brands mentioned belong to their respective owners. EnerTherm Engineering is not affiliated with, endorsed by, or a licensee of any third-party software or product mentioned unless explicitly stated.

Technical Manager — EnerTherm Engineering
John Naranjo is Technical Manager at EnerTherm Engineering, bringing specialist expertise in chemical and environmental engineering. He recently led the implementation of Omni Vision, EnerTherm's real-time energy and utility monitoring platform. He holds an MSc in Environmental Engineering from the University of Huelva and a BSc in Chemical Engineering, with memberships in both the Energy Institute and IChemE.
