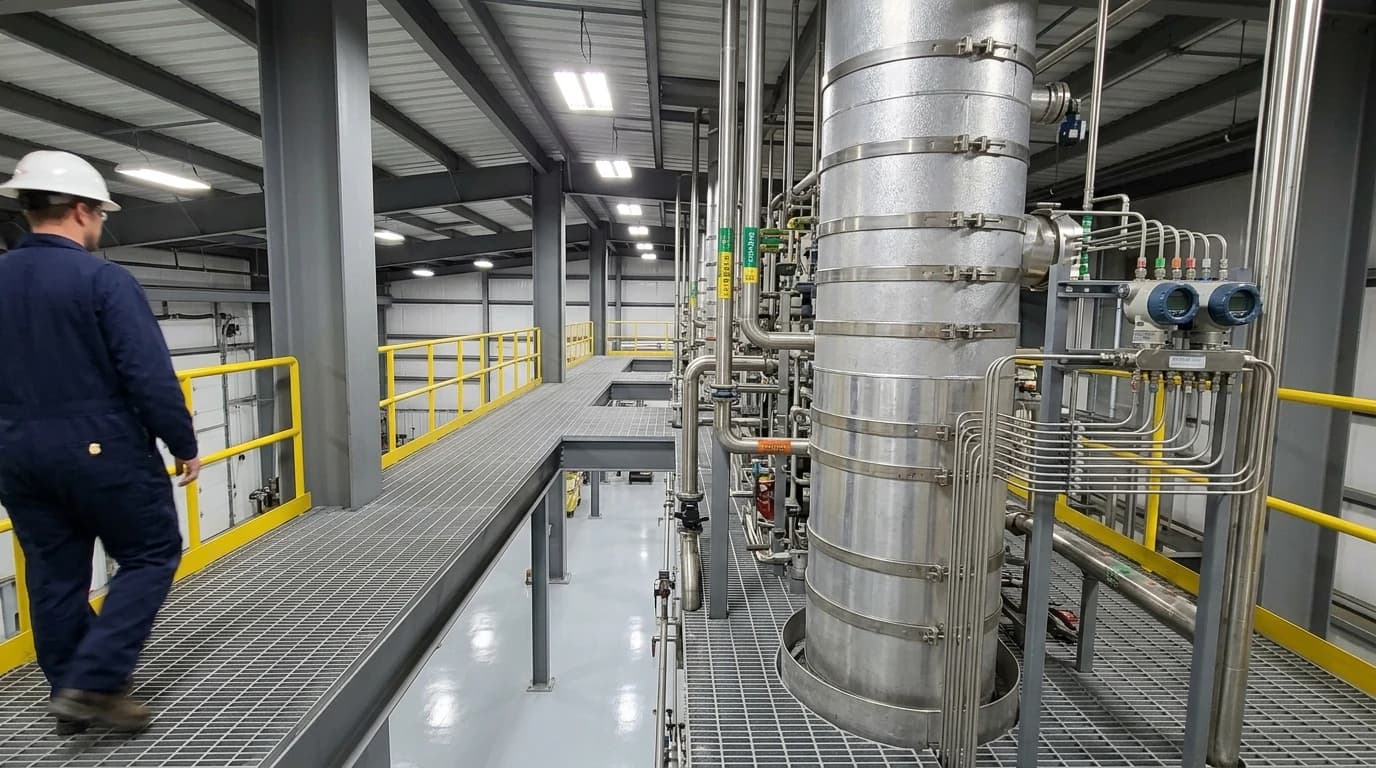
Energy Management System for Distillation Columns
Tracking specific energy consumption per batch to cut chemical utility costs by 15-25%.
An energy management system for distillation columns is an integrated hardware and software architecture designed to monitor, analyse, and identify opportunities to optimise utility consumption in real time across fractional distillation processes. Fractional distillation represents one of the most energy-intensive separation methods in chemical manufacturing, often accounting for up to 40 per cent of the total thermal utility demand of a chemical plant. Traditional energy tracking typically relies on boundary meters that measure total site-wide gas, steam, or electricity. This macro-level view fails to isolate thermal losses, thermodynamic inefficiencies, or component fouling within individual columns, leaving operations teams with a severe blind spot. An asset-specific energy management system bridges this operational gap. It integrates process telemetry directly with cloud intelligence to provide chemical process engineers and operations directors with granular insight into how steam, electricity, and thermal oil are consumed relative to physical product yields.
Under the Omni Vision Energy Intelligence Platform, the specialised Omni Vision for Chemical Industry module targets these exact points of waste. By tracking utility streams directly at the asset level, the system enables chemical plant managers to transition from retrospective spreadsheet analysis to real-time, actionable decision-making.
Thermodynamic Profiles of Distillation Columns and WGC BREF Guidance

Distillation columns require massive thermal energy inputs in the reboiler to vaporise liquid feeds, alongside equivalent cooling capacities in the condenser to liquefy overhead products. Thermodynamic inefficiencies arise from thermal losses in uninsulated piping, poorly regulated reflux ratios, reboiler fouling, and fluctuating feed compositions.
The Best Available Techniques (BAT) Reference Document for Common Waste Gas Management and Treatment Systems in the Chemical Sector (WGC BREF, 2023) emphasises energy efficiency in separation processes. While this document primarily governs emissions, it highlights that thermal efficiency is an essential component of waste gas prevention. Optimising the energetic profile of a column directly reduces the volume of off-gases generated from utility boilers and heat-generation units, aligning facilities with stringent environmental permits.
Reflux Optimisation and Liquid-Vapour Balance
Maintaining an optimal reflux ratio is a delicate balancing act. An excessively high reflux ratio results in pure product but demands immense thermal energy in the reboiler and cooling water in the condenser. Conversely, an under-refluxed column fails product purity specifications, leading to costly reprocessing batches.
Process engineers often struggle to map the real-time thermal cost of these reflux adjustments. Real-time digital monitoring helps pinpoint the exact thermodynamic equilibrium, recommending adjustments that help operators maintain the lowest possible energy input without compromising product purity.
Reboiler Fouling and Heat Transfer Impedance
Reboilers typically rely on saturated utility steam to drive the heat transfer process. As heat exchanger surfaces experience chemical fouling over time, the overall heat transfer coefficient decreases. To compensate, operators frequently increase steam pressure or flow rates to maintain the column's bottom temperature.
Without localised, continuous thermal monitoring, this degradation goes unnoticed until the asset requires an unscheduled shutdown. An integrated energy management system tracks the real-time thermal transmission efficiency, alerting maintenance teams before critical fouling thresholds are reached.

Omni Vision delivers turnkey utility metering, CO2 tracking, and AI-powered production KPI intelligence — giving you real-time dashboards and actionable insights across your entire facility.
Calculating Process-Specific Energy KPIs: SEC and Batch Costs
To measure column efficiency accurately, plants must move beyond raw consumption metrics and adopt process-linked Key Performance Indicators (KPIs). The most vital metric is Specific Energy Consumption (SEC) per unit of distillate. This normalises energy usage against throughput, ensuring that fluctuations in production volume do not distort performance analysis.
The Specific Energy Consumption (SEC) Equation
Calculating the SEC requires compiling the total thermal energy delivered by the steam loop and the total electrical power consumed by auxiliary pumps, vacuum systems, and control valves. The core relationship is expressed as:
SEC=MdistillateEthermal+Eelectricalwhere: SEC is the Specific Energy Consumption expressed in kilowatt-hours per tonne of compliant distillate (kWh/tonne), Ethermal is the total thermal energy input to the column reboiler (kWh), Eelectrical is the total electrical energy consumed by auxiliary column systems (kWh), Mdistillate is the total mass of the compliant distillate or final product recovered during the run (tonnes).
Normalising utility consumption against product yield ensures that changes in feed rate or operational downtime do not distort energy performance evaluations.
Dynamic Cost-per-Batch Calculation
In batch distillation processes, establishing the precise financial cost per batch is crucial for commercial pricing and operational analysis. Process engineers can calculate this dynamic utility cost using the following formula:
Costbatch=(Pelec×T×Relec)+(Msteam×Δh×Rthermal)where: Costbatch represents the total utility cost per batch (£), Pelec is the average electrical power demand (kW) captured by the PLC sub-metering system, T is the active batch run time (hours), Relec is the real-time electrical tariff rate (£/kWh), Msteam is the steam mass flow delivered to the column reboiler (kg), Δh represents the specific enthalpy difference of steam across the heating loop (kWh/kg), Rthermal is the unit cost of thermal energy (£/kWh).
Using this dynamic model, chemical plants can assign exact utility costs to individual production campaigns, exposing hidden variances between different product recipes and operating shifts.
| Process Asset Parameter | Physical Sensor Type | Primary Mapped KPI |
|---|---|---|
| Reboiler Steam Feed | Clamp-on Ultrasonic Flowmeter (Steam) | Thermal Energy Input (kWh) |
| Condensate Line | Clamp-on Ultrasonic Flowmeter (Liquid) + Temp | Heat Recovery and Condensate Return Efficiency |
| Distillate Yield | In-line Electromagnetic or Ultrasonic Flowmeter | Product Mass (tonnes) for SEC Normalisation |
| Auxiliary Pumps and Vacuum | Electrical Power Meter (CTs at MCC) | Electrical Energy Input (kWh) |
| Column Pressure Drop | Differential Pressure Transmitter | Column Internals Fouling and Flooding Index |
Non-Invasive Metering and ATEX/DSEAR Compliance in Hazardous Zones
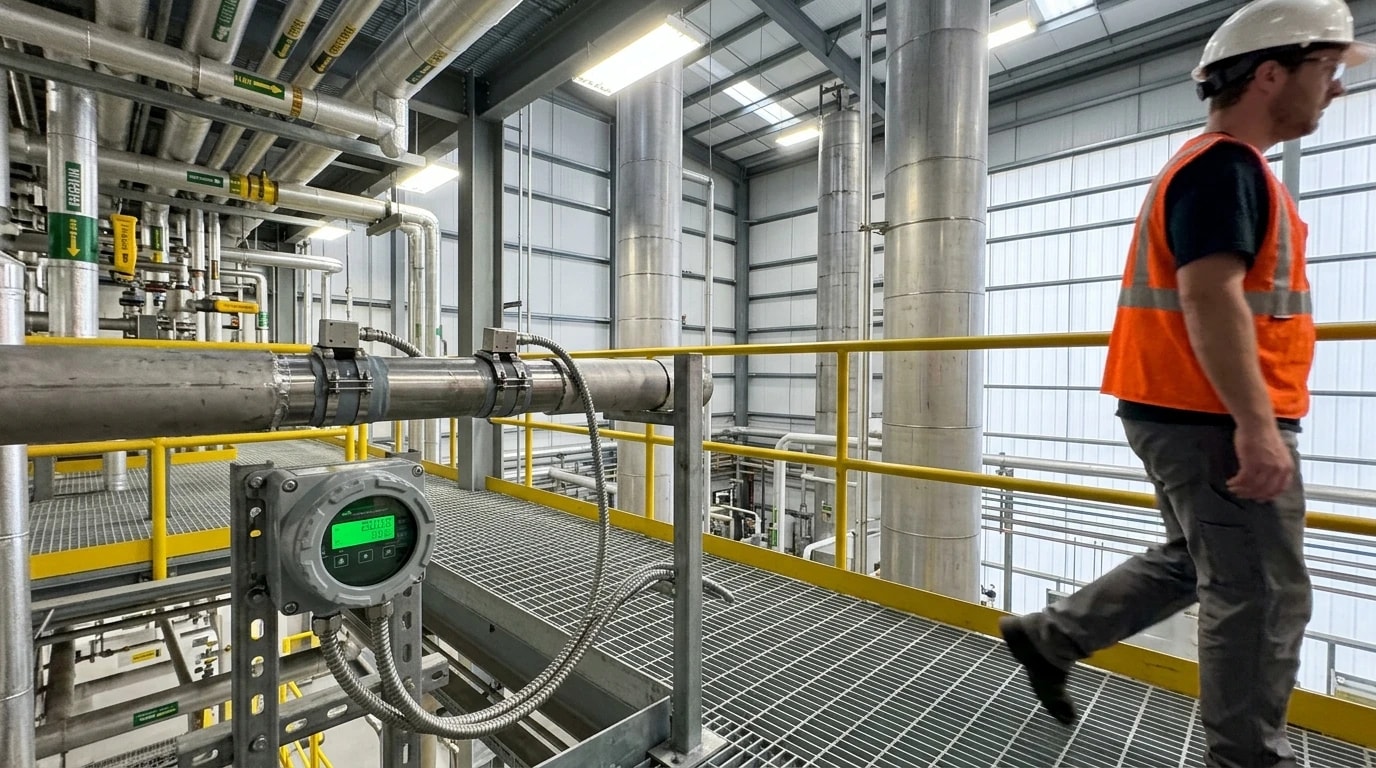
Chemical manufacturing environments are subject to strict safety standards, notably the Dangerous Substances and Explosive Atmospheres Regulations 2002 (DSEAR) in the UK and ATEX directives in the EU. Installing in-line flowmeters typically requires cutting pipes, welding, and halting production, which introduces risks of toxic or flammable chemical leaks.
To comply with ATEX/DSEAR Zone 1 and Zone 2 safety requirements, process design teams frequently specify non-invasive clamp-on ultrasonic flowmeters.
How Clamp-On Ultrasonic Meters Work on Steam and Condensate
These flowmeters use the transit-time difference method, where ultrasonic transducers are clamped directly onto the external wall of the pipe. Sound waves are transmitted through the pipe wall and the fluid, measuring flow velocity without any physical contact with the process medium.
For distillation columns, monitoring both the high-pressure steam entering the reboiler and the hot condensate returning to the utility loop is essential. Industrial engineers often utilise ATEX-certified clamp-on flowmeters, such as the Emerson Flexim FLUXUS series or Panametrics AquaTrans instruments, to secure highly accurate mass flow data without risking hazardous chemical releases.
Avoiding Process Disruption and Pressure Drops
A key advantage of non-invasive sensors is that they cause zero pressure drop. Traditional in-line meters, such as orifice plates or vortex meters, introduce a physical restriction into the flow path. This restriction causes a permanent pressure drop, forcing upstream boilers or pumps to work harder and consume more energy. Furthermore, because clamp-on meters can be installed while the column is fully operational, plants avoid the massive financial losses associated with process shutdowns and production restarts.

Track energy consumption, emissions, and process parameters with seamless PLC/SCADA integration via Modbus, OPC-UA, and MQTT protocols.
Edge-to-Cloud Integration and Cyber Security Architecture
The physical sensors and meters are only as valuable as the data network that connects them. The Omni Vision Energy Intelligence Platform employs a secure, non-invasive data extraction architecture designed specifically for the strict protocols of chemical plants.
PLC Connectivity and Protocol Support
To bypass the need for costly new cabling, the system interfaces directly with existing plant Programmable Logic Controllers (PLCs) and Distributed Control Systems (DCS). It supports standard industrial communication protocols:
- Modbus TCP/RTU for direct electrical sub-metering and sensor integration.
- OPC UA for secure, platform-independent data exchange with the plant's DCS.
- MQTT for lightweight, real-time data transmission to the edge gateway.
Unidirectional Data Flow and Zero-Write Access
In chemical manufacturing, cybersecurity is paramount to prevent unauthorised overrides of hazardous process controls. The Omni Vision platform utilises physical and software-defined unidirectional gateways. This architecture guarantees a one-way, highly encrypted data flow from the plant floor up to the cloud analytics system.
Importantly, the system maintains zero-write access to plant PLCs. It cannot transmit commands or change setpoints back to the physical machinery, ensuring the operational integrity and safety standards remain completely isolated from the internet.
Cloud-Based AI Analytics
Once the raw utility data (steam, electricity, condensate, and thermal oil) is securely transmitted, cloud analytics platforms, such as the EPSA cloud-based AI analytics engine, process the telemetry. The AI runs predictive forecasting algorithms and real-time anomaly detection. By continuously analysing the relationship between column temperature, feed rate, and steam consumption, the platform can isolate performance degradation, such as tray fouling or heat exchanger scaling, from normal process adjustments.
Regulatory Integration: ISO 50001, SECR, and EU ETS Compliance
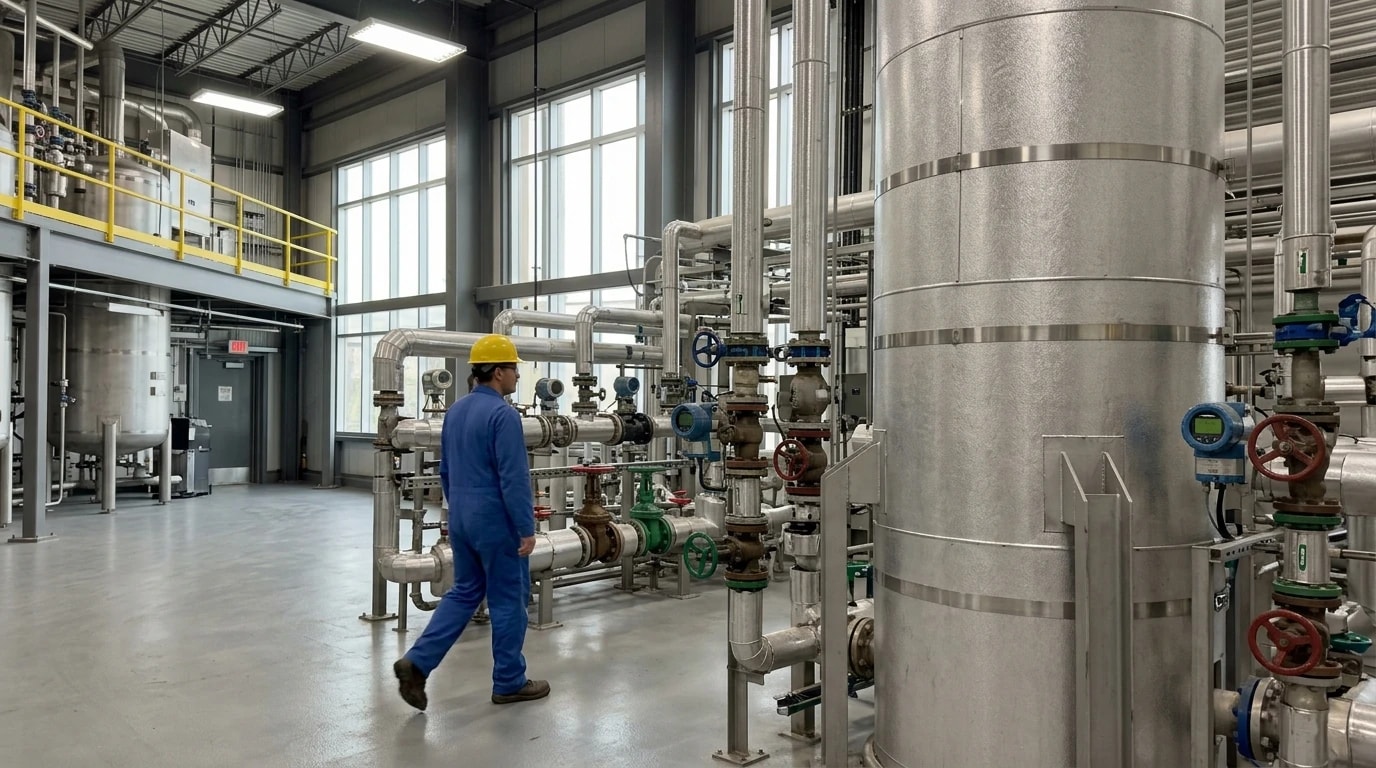
For chemical manufacturers operating energy-intensive separation processes, regulatory compliance is no longer a voluntary reporting exercise. The Omni Vision for Chemical Industry module automates the collection of audit-ready data.
Supporting the ISO 50001:2018 Energy Management Standard
Maintaining certification for ISO 50001:2018 requires factories to establish a clear energy baseline and prove continuous energy performance improvements. Traditional spreadsheet-based tracking is prone to human error and relies on historical, lagged billing data. The platform automates this by establishing live Energy Performance Indicators (EnPIs) for individual distillation columns, feeding directly into the mandated Plan-Do-Check-Act cycle with transparent, high-fidelity data trails.
Streamlined Energy and Carbon Reporting (SECR) in the UK
Under the UK's SECR framework, large chemical operators must report their annual energy consumption and associated greenhouse gas emissions. The system automates the collation of this data across the core utility streams. By mapping physical production logs to electrical and thermal consumption, environmental compliance teams can generate SECR-compliant reports quickly and accurately.
EU ETS and Reducing Scope 1 Emission Uncertainty Factors
Under the EU Emissions Trading System (EU ETS), facilities must account for their Scope 1 direct emissions. For chemical sites, a major portion of Scope 1 emissions comes from steam boilers. Historically, standard reporting methodologies allowed for high uncertainty factors when calculating the volume of fuel burned to generate steam for specific processes.
By utilising non-invasive clamp-on flowmeters and digital pressure monitoring on the steam lines feeding individual distillation columns, plants can calculate the exact thermal energy consumed in real time. Replacing generic, static emission factors with precise, monitored thermal data significantly reduces the uncertainty factor in Scope 1 emissions calculations. This precision prevents plants from over-reporting emissions, potentially saving thousands of pounds in EU ETS carbon allowances.
Turnkey Deployment Methodology and Industrial ROI Benchmarks
The traditional hurdle for industrial energy management systems is the complexity and duration of deployment. Many plant managers hesitate to initiate projects that risk taking months of engineering time and disrupting production schedules.
The 8 to 16 Week Turnkey Deployment Model
To eliminate these deployment friction points, the platform is delivered via a standardised 8 to 16 week turnkey deployment model. This model covers the entire lifecycle of the integration:
- Weeks 1 to 4: Site assessment, sensor mapping, and procurement of non-invasive clamp-on instruments.
- Weeks 5 to 8: Physical installation of clamp-on flowmeters, requiring zero process downtime, and integration of PLC data streams.
- Weeks 9 to 12: Provisioning of the secure edge gateway and establishing the encrypted one-way cloud connection.
- Weeks 13 to 16: Configuration of the cloud-based AI analytics dashboard, establishing baseline KPIs, and training plant personnel.
Achieving 15 to 25 per cent Energy Savings and Sub-12-Month ROI
Once active, the platform routinely identifies hidden inefficiencies, such as steam trap failures, bypass leakage, excessive reflux ratios, and sub-optimal column pressure profiles. By identifying inefficiencies to guide real-time corrective actions and predictive maintenance schedules, the platform helps chemical plants consistently achieve 15 to 25 per cent energy cost reductions.
Given the high utility costs of operating industrial-scale distillation columns, these savings translate to a sub-12-month ROI, making it a highly attractive capital expenditure for operations and financial directors alike.
This article reflects the independent analysis and editorial opinion of EnerTherm Engineering. Product names, trademarks, and brands mentioned belong to their respective owners. EnerTherm Engineering is not affiliated with, endorsed by, or a licensee of any third-party software or product mentioned unless explicitly stated.

Technical Manager — EnerTherm Engineering
John Naranjo is Technical Manager at EnerTherm Engineering, bringing specialist expertise in chemical and environmental engineering. He recently led the implementation of Omni Vision, EnerTherm's real-time energy and utility monitoring platform. He holds an MSc in Environmental Engineering from the University of Huelva and a BSc in Chemical Engineering, with memberships in both the Energy Institute and IChemE.
