Cutting Industrial Energy Costs by 15-25% via PLC Data
Map steam, water, and compressed air flows for automated ISO 50001 and SECR compliance.
UK manufacturing facilities lose up to 30% of their energy intake through avoidable system inefficiencies, with compressed air leaks, unbalanced steam, and unmonitored water flows accounting for the bulk of this waste. Historically, plant engineers tracked these utilities through legacy spreadsheets, leaving a vast lag between detection and corrective action. With energy representing up to 15% of industrial operational costs, this blind spot creates a substantial financial drain.
The data needed to eliminate these losses already resides within the facility, locked inside programmable logic controllers (PLCs) on the production floor. By mapping real-time telemetry from these existing controllers to specific production shifts and processes, manufacturers can reduce utility costs by 15% to 25%. This non-invasive data integration establishes precise cost-per-tonne metrics without halting production or investing in expensive new machinery.
Beyond immediate savings, this automated approach provides the verifiable dataset required to meet rigorous UK compliance frameworks. Operations face growing pressure to provide auditable evidence of carbon reduction for ESOS audits, SECR filings, and ISO 50001 certifications. Transitioning from manual audits to automated, PLC-driven reporting transforms compliance from a resource-heavy administrative burden into a natural by-product of daily operational efficiency.
Transitioning from Legacy Spreadsheet Tracking to Centralised Energy Intelligence
Industrial facilities across the United Kingdom face unprecedented pressure to curb carbon emissions while protecting operating margins. Traditionally, plant managers track energy consumption using manual spreadsheets compiled from monthly utility invoices. This retrospective approach introduces a major blind spot. Bills show aggregated consumption but fail to reveal the dynamic energy demands of individual production shifts, specific batches, or anomalous operational events. While a site-wide Energy Audit can pinpoint immediate engineering faults, sustaining those savings requires continuous data streams.
| Operational Metric | Manual Spreadsheet Tracking | Omni Vision Platform |
|---|---|---|
| Data Ingestion Frequency | Weekly or monthly manual entries from utility invoices. | Continuous, real-time telemetry from physical submeters. |
| Production Context | Disconnected from batch numbers or raw material inputs. | Real-time synchronisation with MES and ERP databases. |
| Baseline Accuracy | Static historical averages that ignore variable factors. | Dynamic baselines aligned with ISO 50006:2023. |
| Protocol Interoperability | Non-existent; data remains locked in regional silos. | Native integration via OPC UA and Modbus protocols. |
| Regulatory Compliance | High manual administrative overhead for submissions. | Automated compliance reports for ESOS Phase 4 and SECR. |
EnPI Alignment with ISO 50006:2023
Establishing reliable energy metrics is a prerequisite for complying with the UK's Energy Savings Opportunity Scheme (ESOS) Phase 4 and the Streamlined Energy and Carbon Reporting (SECR) framework. Manual spreadsheet records struggle to satisfy the strict requirements of ISO 50006:2023, which establishes guidelines for creating, using, and maintaining energy performance indicators (EnPIs) and energy baselines (EnBs). To evaluate efficiency gains objectively, manufacturers must isolate fixed energy consumption, such as cleanroom HVAC baseloads, from variable consumption tied directly to production volumes.
Operations managers and production engineers in pharmaceutical and food processing plants need to track energy intensity per unit of output. Without automated, production-linked energy KPI software, operators struggle with transcription errors and data gaps. The Omni Vision Energy Intelligence Platform bridges this gap by integrating Manufacturing Execution Systems (MES) and Enterprise Resource Planning (ERP) platforms. Operating via standard interoperability protocols like OPC UA, the platform synchronises batch-level telemetry with active energy draw. This allows teams to map energy use directly to individual production batches or cost-per-tonne performance, securing the precise traceability needed for GMP and HACCP compliance.
Algorithmic Triggers and Operator Alerts
Rather than merely logging data, the platform uses Omni Vision for Energy Consumption modules to apply automated analytics to incoming telemetry. The system employs three mathematical triggers to identify waste:
First, cumulative sum (CUSUM) algorithms monitor minor, progressive deviations from the baseline. This identifies creeping inefficiencies, such as steady compressed air line decay or boiler tube scaling, long before they trigger standard high-limit alarms.
Second, the platform applies Statistical Process Control (SPC) limits to energy-per-batch metrics. When a cleanroom HVAC or process reactor cycle exceeds 1.5 standard deviations from the historical mean, the system flags the batch as an energy anomaly.
Third, predictive regression models calculate expected energy usage by analysing production load, ambient humidity, and temperature.
When the system detects a deviation, it routes real-time warnings to local operator HMIs and SCADA systems. Each alert includes step-by-step remediation advice, such as "Refrigeration Loop 3 coefficient of performance has dropped to 2.8; inspect expansion valve calibration." Because the platform maintains a zero-write, read-only architecture to protect GMP and HACCP process integrity, it does not directly adjust valve states or boiler schedules. Instead, it equips human operators with the exact insights required to perform targeted Process Optimisation interventions.
Financial Returns and Turnkey Integration
Moving from manual logging to centralised intelligence delivers a documented 15% to 25% reduction in facility energy costs. These savings result from immediate operator response to identified anomalies, compressed air leaks, and sub-optimal boiler sequencing.
EnerTherm Engineering delivers the entire system as a standardised 8-to-16-week turnkey deployment. By incorporating physical meters and secure edge gateways with EPSA's cloud-based AI analytics engine, the deployment avoids plant downtime. This rapid implementation, combined with operational savings, secures a sub-12-month return on investment (ROI). This transition from manual tracking to centralised intelligence converts energy from an unmanaged overhead into a controllable, batch-linked variable. However, unlocking this data requires traversing complex operational technology (OT) landscapes.

Omni Vision delivers turnkey utility metering, CO2 tracking, and AI-powered production KPI intelligence — giving you real-time dashboards and actionable insights across your entire facility.
Establishing Secure OT Cybersecurity and Non-Invasive Data Flows from Legacy PLCs
Non-Invasive Data Ingestion from Legacy Controllers
Extracting granular telemetry from legacy plant controllers without causing operational downtime or introducing cybersecurity risks is a primary engineering hurdle. In high-value manufacturing environments, unplanned outages result in raw material waste and lost production revenue. To bypass these risks, facility teams employ physical tap-ins and protocol translation gateways that operate independently of active operational logic. This allows for retrofitting energy monitoring in chemical plants without downtime.
This non-invasive ingestion relies on external secondary sensors and passive tap-ins rather than invasive PLC code modifications. Engineers install split-core current transformers on existing power cables and clamp-on ultrasonic meters on water pipes. For legacy PLCs, hardware translation gateways connect directly to secondary serial or auxiliary Ethernet ports.
These gateways convert raw, native data streams at the machine level:
- Modbus RTU and TCP: Ingests unencrypted registers from older PLCs, gas meters, and main steam headers over physical RS-485 or local copper networks.
- BACnet MS/TP and IP: Captures environmental data from building management systems, ensuring that ancillary energy consumers like cleanroom HVAC are fully mapped.
Once captured, this raw telemetry must be standardised and encrypted before leaving the local operational environment.
Unified Data Structures via OPC UA and MQTT Sparkplug
To bridge legacy plant systems with cloud analytics, raw data registers must be transformed into structured, context-rich data models. Implementing a native OPC UA energy monitoring integration achieves this. Standardised globally under the IEC 62541 series, OPC UA uses Information Modelling to create standardised energy data structures. This allows plant teams to map variables like electrical power, fluid flow, and thermal energy to standardised companion specifications. This structured telemetry serves as a vendor-neutral single source of truth, facilitating automated ISO 50001 reporting and precise Scope 1 and Scope 2 emissions tracking without modifying the underlying PLC logic.
While OPC UA serves as a local, structured client-server communication method, transmitting high-frequency data to cloud analytics engines demands an event-driven solution. Integrating the MQTT protocol for industrial energy IoT via the ISO/IEC 20237 Sparkplug B specification addresses this requirement.
Sparkplug B adds state management and standardised payload schemas to basic MQTT implementations. Its report-by-exception mechanism reduces network bandwidth by transmitting data only when process variables exceed a predefined deadband threshold. This is essential for energy monitoring networks managing thousands of high-frequency PLC data points. Furthermore, MQTT Sparkplug B integrates TLS 1.3 transport-layer encryption and X.509 certificate-based mutual authentication, ensuring that the data flow complies with IEC 62443 industrial control system standards.
OT Cybersecurity and Secure Cloud Push Architecture
Relaying real-time energy telemetry to cloud-based AI analytics requires separation between corporate networks and active physical control systems. Implementing OT cybersecurity for energy cloud connectivity prevents the security risks associated with direct internet access, such as command injection or unauthorised remote access. To maintain security, plants must establish a dedicated secure one-way cloud data push architecture using specialised software development and secure gateways.
This architecture enforces network segmentation based on the Purdue Enterprise Reference Architecture (PERA), isolating Level 3 (Operations Support) from Level 4 and 5 (Enterprise and Cloud) environments. Telemetry flows exclusively in one direction.
| Cybersecurity Control | Implementation Method | Compliance Standard Alignment |
|---|---|---|
| Data Directionality | Outbound-only TLS 1.3 connections; zero inbound listening ports open on the OT firewall. | IEC 62443-3-3 (System Security Requirements) |
| Authentication | Mutual X.509 certificate-based authentication on gateways and cloud brokers. | NIST SP 800-82 Rev. 3 (OT Security Guide) |
| Write Enforcement | Read-only protocol drivers at the gateway layer (zero-write access to PLCs). | ISO 27001 & UK NCSC Cyber Assessment Framework |
| Network Isolation | Unidirectional gateways separating Level 3 OT from Enterprise IT networks. | IEC 62443-3-3 & PERA Level 3/4 Boundary |
This outbound-only architecture ensures that if corporate cloud systems are compromised, an external threat cannot traverse back down the network stack to command, schedule, or modify PLC registers. This maintains plant safety, process validation, and operational uptime while paving the way for rapid submetering deployment.
Deploying Submetering and Mapping Telemetry to Production Shifts in Under 8 Weeks
Relying on periodic assessments to reduce operational expenditure often results in overlooked inefficiencies. A key distinction in the industrial energy audit vs real-time monitoring comparison is that static audits under ISO 50002-1:2025, which represent traditional manufacturing plant energy auditing, provide only a historic baseline. They cannot detect operational drift or capture dynamic load fluctuations between audit cycles. Conversely, continuous submetering solutions for manufacturing plants establish the persistent data streams mandated by the ISO 50001:2018 standard. For organisations focused on decarbonising industrial operations and complying with UK Streamlined Energy and Carbon Reporting (SECR) alongside ESOS Phase 4 mandates, moving from retroactive spreadsheets to active tracking is essential. Implementing turnkey energy solutions for manufacturing allows operators to target non-productive baseload consumption. This "baseload creep," defined as preventable utility draw during weekends or idle periods, accounts for 10% to 30% of industrial waste. Eliminating this waste is a primary methodology for how to reduce industrial energy costs.
Rapid Deployment and Physical Interfacing Matrix
To avoid production halts or extensive validation cycles, turnkey energy management solutions employ a structured, parallel-path deployment model. The table below outlines this phased execution timeline over an eight-week schedule:
| Phase | Duration | Technical Scope | Physical & Data Deliverables |
|---|---|---|---|
| 1. Site Survey | Weeks 1–2 | Conduct physical Process Evaluation; trace SLDs (Single Line Diagrams); identify critical distribution nodes. | P&ID update; sensor mounting plan; local gateway placement maps. |
| 2. Physical Integration | Weeks 3–4 | Mount non-invasive split-core CTs on main MCC feeds and clamp-on flow meters on steam/air lines. | Physical installation; serial RS-485 cabling to local junction boxes. |
| 3. Gateway Configuration | Weeks 5–6 | Establish serial RS-485 2-wire half-duplex daisy chains to local edge gateways. Map Modbus registers. | Modbus register schema map; local gateway testing; WAN connectivity. |
| 4. Cloud Mapping | Weeks 7–8 | Deploy MQTT Sparkplug B broker payload definitions. Synchronise telemetry with active shift schedules. | Interactive dashboard deployment; automated shift reporting; active anomaly detection. |
Technical Execution: Modbus to MQTT Cloud Mapping
The physical interface relies on wiring local submeters in a multi-drop daisy chain (RS-485 A, B, and Shield wires) back to an edge-to-cloud translation gateway. To transition from Modbus to cloud data transmission, the gateway extracts and converts raw 16-bit register values locally into structured engineering units.
For example, a standard 3-phase compressor power meter maps active electrical parameters to the following Modbus holding registers, using 32-bit floating-point values spanning two consecutive 16-bit registers:
- Register 3001–3002 (0x0BB9): Active Power (P), scaled in kW.
- Register 3003–3004 (0x0BBB): Cumulative Active Import Energy (E), scaled in kWh.
- Register 3005–3006 (0x0BBD): Volumetric Flow Rate (Q), scaled in m³/min from an inline air flow meter.
To construct a secure Modbus MQTT energy monitoring integration, the edge gateway polls these registers every 1,000 milliseconds, packages the values, and publishes them as a binary payload using the Sparkplug B specification over TLS 1.3. Below is the decoded JSON telemetry payload representation, which maps the raw PLC-derived values to specific ERP-defined production shift metadata:
{
  "timestamp": 1781258400000,
  "metrics": [
    { "name": "Compressor_01/ActivePower", "alias": 20, "dataType": "Float", "value": 132.4 },
    { "name": "Compressor_01/ActiveEnergy", "alias": 21, "dataType": "Float", "value": 451829.7 },
    { "name": "Compressor_01/AirFlow", "alias": 22, "dataType": "Float", "value": 14.8 },
    { "name": "Context/ShiftID", "alias": 23, "dataType": "Int32", "value": 2 },
    { "name": "Context/ActiveBatch", "alias": 24, "dataType": "String", "value": "F-8091" }
  ],
  "seq": 104
}
This structural mapping enables energy consumption mapping for production shifts, allowing the platform to dynamically group utility data by active, changeover, or idle machine states.
Shift-Based Optimisation and Compressed Air Efficiency
Using this data, plant teams can deploy targeted energy efficiency strategies for plant managers. Aligning high-resolution electricity and flow metrics with specific shift boundaries reveals shift-by-shift performance anomalies. Calculating the energy-per-unit metric for each shift allows management to identify and correct poor shutdown discipline. This process underpins how to reduce manufacturing energy costs by systematically eliminating off-shift baseload waste.
This granular visibility is particularly impactful when applying compressed air energy cost reduction strategies. Compressed air is historically the most expensive manufacturing utility, accounting for 10% to 30% of an industrial facility's total electrical footprint. Standard system assessments under ISO 11011:2013 establish that leaks frequently consume 20% to 50% of total generated volume.
Continuous compressed air energy efficiency monitoring tracks the Specific Energy Requirement (SER), quantified in kW per m³/min, as the core KPI. Evaluating this ratio under idle shift states exposes passive downstream leaks. Integrating flow and power telemetry enables AI-driven predictive maintenance manufacturing. The platform detects performance drift, such as a pressure drop over clogged inline filters, allowing maintenance teams to intervene before a compressor trips. Resolving these localised drop points allows the facility to reduce the main compressor operating setpoint. For every 1 bar reduction in system discharge pressure, total compressor electricity consumption drops by 7%, delivering direct utility cost reductions and facilitating compliance with ESOS energy-saving recommendations. For energy-intensive chemical processing, this mapping must drill down to individual process assets.
Optimising Chemical Industry Distillation and Reactor Yields via Cost-per-Tonne Metrics
Instead of relying on aggregate site billing, process engineers must map utility consumption directly to chemical throughput. The formula below shows how to calculate energy cost per tonne (CT) for an individual distillation column or chemical reactor by combining electrical and thermal utility streams into a single financial metric:
CT=Mproduct(Pelec×T×Relec)+(Msteam×Δh×Rthermal)Where:
- Pelec represents the average electrical power demand (kW) that the PLC submetering system captures.
- T is the active batch run time (hours).
- Relec is the real-time electrical tariff rate (£/kWh).
- Msteam is the steam mass flow (kg) that the utility line delivers to the column or reactor.
- Δh represents the specific enthalpy difference of steam across the heating loop (kWh/kg).
- Rthermal is the unit cost of thermal energy (£/kWh).
- Mproduct is the mass of compliant product (tonnes) that the PLC records.
To calculate this dynamically, plants deploy process-level energy monitoring systems that pull real-time telemetry from existing instruments.
Mapping PLC Data to Distillation and Reactor Columns
Implementing a continuous energy management system for distillation columns or establishing precise energy and emissions tracking for chemical reactors requires engineers to map physical sensor telemetry directly to high-level KPIs. By utilising PLC data integration for energy management, factories can extract these variables without disrupting active control loops.
The table below outlines how raw telemetry translates into actionable performance metrics within a unified industrial energy efficiency dashboard:
| Process Asset | Physical Sensor Type | Primary PLC Protocol | Target KPI / EnPI |
|---|---|---|---|
| Distillation Reboiler | Clamp-on ultrasonic thermal energy meter | Modbus RTU / TCP | Specific Steam Consumption (kg steam per kg of distillate) |
| Reflux Pump | Split-core current transformers on motor drives | OPC UA | Specific Electrical Intensity (kWh per tonne) |
| Reactor Heating Jacket | Insertion temperature and pressure transmitters | Modbus TCP | Specific Thermal Energy (MJ per batch) |
| Reactor Agitator | Variable speed drive frequency and torque logs | MQTT | Mixing Energy Intensity (kWh per batch hour) |
For plants integrating thermal recovery equipment, such as condensers for chemical processing, these live measurements ensure that heat recovery systems operate at their designed thermal efficiency. With this granular mapping, plant operators bypass retroactive spreadsheet approximations. Routing these streams through a secure gateway establishes real-time utility monitoring for manufacturing operations. This foundation supports automated carbon footprint reporting for factories by directly feeding high-fidelity data into Scope 1 and Scope 2 emissions reporting software, replacing manual monthly calculations with audit-ready trails that satisfy the Greenhouse Gas Protocol Corporate Standard and SECR regulations.
Resolving Hidden Losses via AI-Driven Anomaly Detection
To isolate performance degradation from normal process variability, modern plants integrate AI-driven energy anomaly detection in manufacturing environments. Distillation columns and reactors operate under highly dynamic conditions where feed compositions, ambient temperatures, and chemical kinetics fluctuate. Static baseline methods fail to distinguish these normal operational shifts from genuine equipment failures.
By aligning with the BS ISO 50006:2023 standard, the Omni Vision platform establishes multi-variable energy baselines (EnBs) and energy performance indicators (EnPIs). Machine learning models continuously compare real-time utility consumption against these dynamic baselines. This statistical comparison allows the platform to identify thermal and mechanical losses, including:
- Fouled Reboiler Heat Exchangers: A gradual increase in steam consumption per unit of distillate under steady-feed conditions.
- Failing Steam Traps: Sudden increases in condensate return temperatures, indicating live steam bypass.
- Reactor Thermal Insulation Degradation: Uncharacteristic heat loss during exothermic reactions.
By deploying non-invasive energy monitoring solutions, such as clamp-on ultrasonic meters that comply with the ATEX Directive 2014/34/EU and DSEAR regulations for hazardous zones, engineers capture telemetry safely. Eliminating these hidden losses accelerates an industrial energy optimisation ROI to under 12 months, as verified across numerous process manufacturing deployments.
Proactive Load Shifting and Peak Tariff Avoidance
Chemical plants face severe financial penalties during high-demand intervals on the electrical grid. In the UK, changes introduced under the Targeted Charging Review (TCR) alongside traditional Triad periods have increased the volatility of peak network charges. To mitigate these risks, facilities use AI-driven energy consumption forecasting to shift flexible, energy-intensive loads to off-peak periods.
By linking production schedules to predictive weather models and historical process data, the forecasting algorithms predict when the plant is likely to breach peak demand thresholds. Plant operators utilise this forecasting capability as an automated peak tariff avoidance software for manufacturing. For example, plant managers can reschedule non-continuous batch reactor heating or adjust the operation of ancillary cooling towers and vacuum systems around peak tariff windows.
This foresight does more than reduce immediate operating costs. The high-fidelity, automated data generated by Omni Vision for Chemical Industry feeds directly into Scope 1 and Scope 2 emissions reporting software. By providing auditable, real-time records of energy-to-production ratios, chemical manufacturers satisfy Streamlined Energy and Carbon Reporting (SECR) guidelines and EU ETS obligations without the operational friction of manual reporting. Similar operational discipline is required in the food and beverage sector, where utility tracking must co-exist with strict hygiene regimes.

Track energy consumption, emissions, and process parameters with seamless PLC/SCADA integration via Modbus, OPC-UA, and MQTT protocols.
Maintaining HACCP Compliance and Boiler Efficiency in Food Processing plants
Food and beverage manufacturers must reduce high-intensity utility costs across refrigeration, steam, and compressed air systems while strictly adhering to food safety standards. Deploying a unified energy management system for food and beverage industry facilities helps resolve this conflict. Under benchmarks from the UK Food and Drink Federation (FDF) Net Zero Handbook, thermal processing and refrigeration systems represent 60% to 70% of a food facility's total energy demand. Improving energy efficiency in food processing plants requires integrating physical telemetry without disrupting clean zones or risking product contamination. Implementing AI energy optimisation for food processing plants provides the necessary data-driven oversight to achieve these reductions.
The following matrix contrasts traditional measurement hazards against hygienic, non-invasive alternatives:
| Utility Stream | Traditional Monitoring Hazard | Hygienic Non-Invasive Alternative | Primary Standard / Regulation |
|---|---|---|---|
| Steam & Water | Intrusive inline turbine installation (risk of fluid contamination or piping breaches) | Clamp-on ultrasonic flow meters and surface-mounted temperature sensors | BRCGS Issue 9 (Clause 4.6.2) |
| Electricity | Panel downtime and physical cable modifications during sensor installation | Split-core current transformers (CTs) installed without conductor alterations | ISO 22000:2018 |
| Process Heat | Direct immersion sensors with thread sealants (potential bacterial dirt traps) | Pt100 RTDs inside hygienic thermowells with smooth welds | BS EN 60751:2008 |
Sanitary Sensor Integration and HACCP Safety
Deploying energy monitoring equipment within food processing environments mandates strict compliance with the Codex Alimentarius Commission’s General Principles of Food Hygiene (CXC 1-1969, 2023 revision) and the British Retail Consortium (BRCGS) Global Standard for Food Safety (Issue 9). Clause 4.6.2 of BRCGS Issue 9 explicitly dictates that equipment design must prevent foreign-body, microbiological, or allergen contamination. To avoid biological hazards from piping breaches, operators deploy HACCP compliant energy monitoring systems using the non-invasive instrumentation detailed above. For thermal processes, such as baking, pasteurisation, or when implementing industrial Dehydrators for Food Processing, temperature monitoring utilises Pt100 resistance thermometers built to BS EN 60751 standards inside sealed, hygienic thermowells, ensuring utility tracking preserves Critical Control Points (CCPs) under ISO 22000:2018.
Steam System and Boiler Efficiency Optimisation
Establishing precise boiler efficiency monitoring food processing loops requires operators to balance thermodynamic performance with food-contact steam quality. Under BS EN 12952-15:2003 and the Pressure Systems Safety Regulations 2000 (PSSR), maintaining thermal efficiency requires real-time monitoring of flue gas temperatures, fuel feed rates, and condensate recovery. Excess blowdown and steam trap failures represent primary energy losses in food processing steam loops. Excessive blowdown discharges treated, high-temperature feedwater to manage dissolved solids, while insufficient blowdown allows scale build-up, degrading heat transfer efficiency. To resolve these losses, the Omni Vision platform acts as an energy intelligence platform for manufacturing, monitoring pressure and temperature differentials across the steam loop. This approach supports steam system energy optimisation as outlined in ISO 50001:2018 energy management guidelines. Operators can integrate flue gas recovery units, such as Condensers for Food Processing, to reclaim heat and water while monitoring feedwater chemistry to protect pasteurisation steam quality.
Refrigeration and Compressed Air Management
Industrial refrigeration typically accounts for 40% to 60% of a food facility’s electricity load, making industrial refrigeration energy optimisation a high-priority operational target. Managing these systems must comply with BS EN 378:2016+A1:2020. By applying automated predictive maintenance for food and beverage manufacturing using compressor PLC telemetry (via OPC UA or Modbus), operators identify performance drift caused by compressor valve degradation or refrigerant leakage. This form of predictive maintenance for industrial refrigeration addresses refrigerant leakage and compressor degradation before they trigger emergency alarms. A smart factory energy management platform generates AI-driven refrigeration load-balancing recommendations to align cooling cycles with ambient temperature fluctuations and production schedules, preventing peak-demand surges. To capture compressed air energy saving food industry opportunities, which account for 10% to 30% of site electricity, operators must address system leaks and inappropriate pressure settings that waste 20% to 30% of total output. By aligning compressed air auditing with ISO 11011 (Compressed air - Energy efficiency - Assessment), operators identify system leak profiles and pressure drops during non-production windows.
Normalising Energy Performance via Production-Batch KPIs
To evaluate improvements systematically under ISO 50001:2018, operators must transition from raw consumption figures to normalised metrics. The Omni Vision platform automatically maps real-time PLC data against active production shifts and batches to calculate energy intensity metrics for food production. It calculates the Specific Energy Consumption (SEC), an industry-standard metric recommended by the Carbon Trust and expressed as kWh per tonne of finished product in compliance with ISO 50006. Normalising utility consumption against production throughput allows sustainability officers to generate audit-ready energy data. These verified data streams support annual UK Streamlined Energy and Carbon Reporting (SECR) and ESOS Phase 4 mandates, facilitating transparent food industry sustainability reporting. For comprehensive carbon footprint reduction strategies for food plants, facilities configure the Omni Vision for Environmental Monitoring module to map Scope 1 and Scope 2 CO₂ emissions directly from plant telemetry, satisfying mandatory sustainability disclosures. While food plants navigate hygiene codes, pharmaceutical facilities must reconcile energy efficiency with stringent Good Manufacturing Practice (GMP) standards.
GMP-Compliant Pharma Cleanroom HVAC Optimisation and Data Integrity
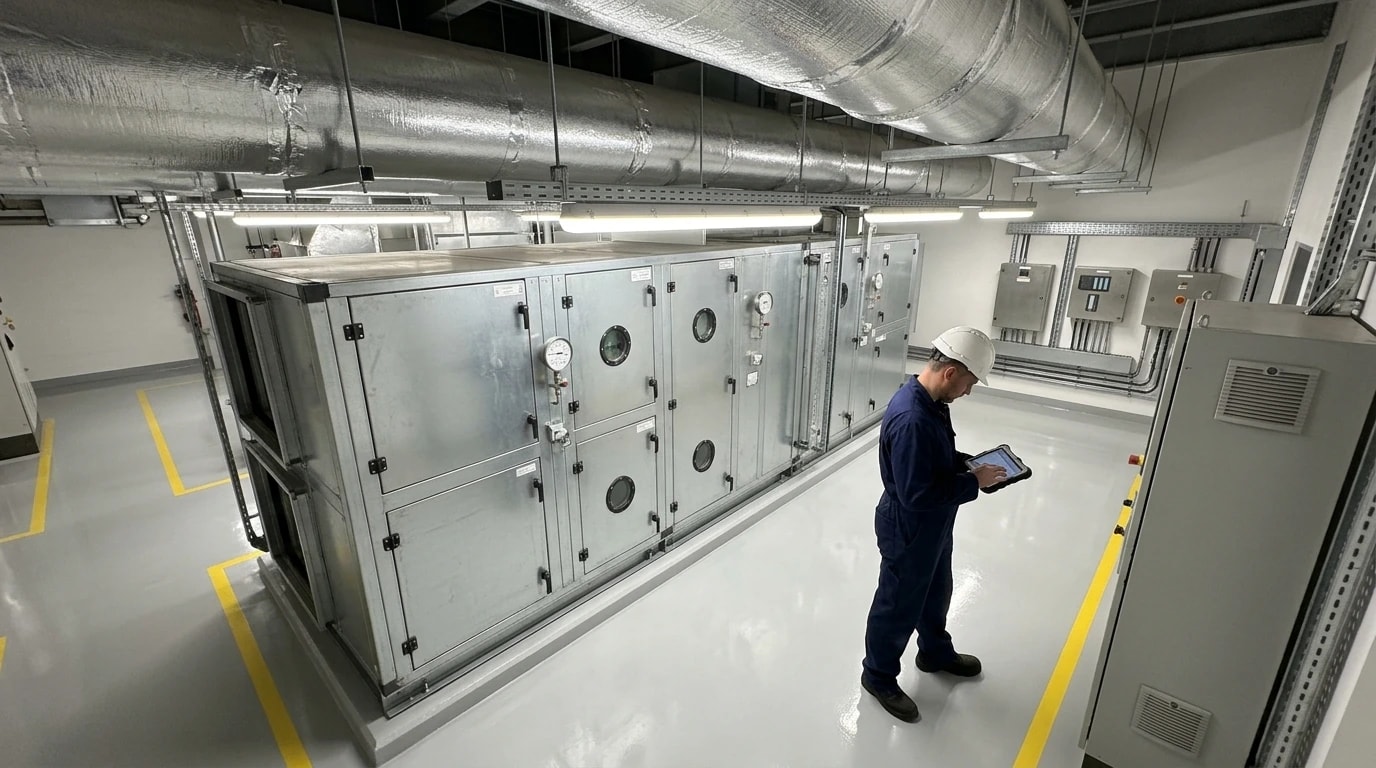
Cleanroom heating, ventilation, and air conditioning (HVAC) systems represent 50% to 80% of total energy consumption in a pharmaceutical manufacturing facility. Reducing this energy demand requires precise interventions that must not compromise the validated state of GxP-regulated cleanrooms. Under the strict requirements of BS EN ISO 14644-16:2019, manufacturers must balance airflow rates with contamination control. The Omni Vision platform implements non-invasive energy data acquisition to enable cleanroom HVAC energy optimisation without violating sterile thresholds or requiring extensive GAMP 5 revalidation.
Balancing Airflow Optimisation with EU GMP Annex 1
Traditional cleanroom designs rely on fixed, conservative air change rates (ACR) to maintain environmental classifications defined by ISO 14644-1:2015. However, maintaining maximum ACR during unoccupied periods generates immense energy waste. To safely implement cleanroom energy efficiency strategies, facilities must adopt demand-controlled ventilation (DCV) guided by real-time telemetry.
The platform integrates with existing SCADA and Building Management Systems (BMS) through read-only protocols to capture ambient particle counts, differential pressures, and relative humidity. Utilising AI-driven energy analytics for pharma plants, the platform identifies opportunities for pharmaceutical cleanroom airflow optimisation during non-operational shifts. By analysing historical recovery times under BS EN ISO 14644-3:2019, the software informs operators when they can safely lower fan speeds without breaching EU GMP Annex 1 (2023 revision) contamination control boundaries. Detailed methodologies for adjusting these parameters are explored in the article optimising cleanroom airflow under EU GMP Annex 1 compliance.
Rather than executing direct control, the platform provides actionable recommendations to plant engineers. This read-only integration prevents unauthorised writes to validated PLC systems, protecting critical utility monitoring for GMP facilities from software-induced drift. Engineers can evaluate the mechanics of these reduced flows in the guide why pharmaceutical cleanrooms are reducing air change rates now.
Data Integrity and ALCOA+ Principles
Integrating industrial IoT compliance pharmaceutical manufacturing solutions requires strict adherence to data integrity. The MHRA GxP Data Integrity Definitions and Guidance for Industry dictates that any computerised system capturing regulatory data must satisfy ALCOA+ (Attributable, Legible, Contemporaneous, Original, and Accurate) standards.
The Omni Vision platform achieves this via a secure, non-invasive architecture:
- Attributable: The system maps each telemetry point and automated log entry to specific physical hardware and user sessions with immutable cryptographic signatures.
- Legible and Contemporaneous: The platform records raw data from PLC nodes, current transformers, and steam flow meters in real time, complete with UTC timestamps that the sensor interface generates.
- Original: Read-only OPC UA and Modbus TCP configurations extract telemetry directly from primary physical instruments, preserving the original data state.
- Accurate: The platform maintains software calibration records and physical submeter certifications within the system to ensure compliance during a pharmaceutical facility energy audit.
Under GAMP 5 (Second Edition) guidelines, this read-only energy data acquisition pharma secure strategy classifies the platform as a Category 4 (Configured Product) system. By avoiding write protocols to validated systems, quality assurance teams can bypass the exhaustive, multi-month revalidation cycles typically required for OT interventions. This preserves the operational integrity of critical cleanroom HVAC setups, water for injection (WFI) plants, and dehydrators for pharmaceutical production.
Audit-Ready Compliance for ISO 50001 and SECR
Maintaining an active ISO 50001 certification pharmaceutical industry standard requires a documented Plan-Do-Check-Act cycle. The platform streamlines this process by replacing manual spreadsheet calculations with continuous, secure energy data audit trails for regulated pharma.
The system maps raw utility flows directly to production schedules, enabling precise batch level energy tracking. Process engineers can view the exact energy footprint (kWh of electricity, kilograms of clean steam) required for each manufactured batch. These granular metrics enable engineers to calculate precise energy performance indicators (EnPIs) as required by ISO 50006:2023.
This granular data underpins both pharmaceutical CO₂ emissions reporting and mandatory Scope 1 and 2 carbon reporting pharmaceutical. By automating calculations in accordance with the GHG Protocol Corporate Standard, the platform outputs audit-ready datasets. These reports simplify compliance with the UK’s Streamlined Energy and Carbon Reporting (SECR) framework and ESOS Phase 4, providing third-party auditors with verified, unmodifiable data trails.
For advanced facilities seeking thermal recovery, linking this automated reporting to condensers for pharmaceutical applications ensures that recovered energy is fully documented and accounted for in the annual carbon disclosure. The article automating scope i and ii co2 reporting in pharma facilities provides a detailed breakdown of the automated calculations for carbon intensity metrics. This data-driven reporting sits at the heart of broader compliance automation.
Automating Regulatory Environmental Reporting: ISO 50001, ESOS, and SECR
Converting raw electrical, gas, and steam telemetry from plant-floor PLCs into compliance reports requires a structured data pipeline. The telemetry system automates this pipeline directly, bypassing manual spreadsheet consolidation through four distinct phases:
- Edge Acquisition: An edge gateway pulls raw data at sub-second intervals from legacy PLCs using non-invasive communication protocols.
- Local Validation: The analytical engine verifies raw readings against ISO 14064-1:2018 standards to identify sensor drift or communication dropouts.
- Carbon Conversion Engine: The platform multiplies validated volumes of fuel and electricity by current government-approved emission factors.
- Report Generation: The software formats output metrics directly into audit-ready tables matching statutory reporting templates.
ISO 50001:2018 Compliance and Baseline Verification
Achieving compliance with the ISO 50001:2018 standard requires continuous, verifiable improvement of energy efficiency. Clause 9.1 mandates that organisations establish systematic methods to monitor, measure, and analyse energy performance indicators (EnPIs) against historical energy baselines (EnBs). Traditional auditing methods fail this requirement because monthly utility bills cannot isolate the performance of individual assets.
Using modern ISO 50001 compliance software, plant engineers replace manual spreadsheets with automated EnPI tracking. Through PLC energy monitoring integration, high-resolution telemetry maps precise energy profiles for heavy machinery under varying load conditions. For example, evaluating the electrical draw of condensers for general manufacturing or tracking the supplementary fuel used by thermal oxidisers allows managers to identify exact process anomalies. Incorporating real-time energy monitoring systems enables plants to calculate continuous energy performance ratings, satisfying the verification demands of external ISO registrars during annual surveillance audits.
Simplifying ESOS Phase 4 Audits
Under the UK Energy Savings Opportunity Scheme (ESOS) Phase 4, qualifying organisations face a compliance deadline of 5 December 2027, based on corporate data captured on the 31 December 2026 qualification date [1]. The Environment Agency requires participants to present high-quality energy audits built on primary, metered consumption data, specifically penalising reliance on historical estimations.
Deploying dedicated ESOS compliance software helps large undertakings automate this data collection. Because the scheme accepts a certified ISO 50001 energy management system as an alternative compliance route, a continuous metering framework serves as a permanent passport to compliance. This continuous extraction of telemetry operates under the NAMUR Open Architecture (NOA) concept. By keeping data collection completely separate from control-loop execution, plants maintain automation safety while feeding analytical engines. In alignment with industrial security standards like IEC 62443 and the National Cyber Security Centre (NCSC) Cyber Assessment Framework, this setup implements outbound-only OPC UA Pub/Sub over MQTT to establish secure industrial IoT energy monitoring, removing the risk of external write access to active PLCs.
SECR and Scope 1 and 2 Carbon Disclosures
The UK Streamlined Energy and Carbon Reporting (SECR) framework, established under the 2018 Regulations, requires large and quoted entities to disclose annual energy use, associated greenhouse gas emissions, and production-related intensity ratios. Financial Reporting Council (FRC) thematic reviews consistently point out that companies must replace vague estimations with auditable, direct-metered data trails to secure reasonable assurance during audits.
Adopting PLC data integration for environmental monitoring provides the foundation for this precision. Dedicated Scope 1 and 2 emissions tracking software processes direct combustion data (Scope 1) from natural gas and fuel oil alongside purchased electricity data (Scope 2). This calculation pipeline utilises the principles of ISO 14064-1:2018 to convert raw telemetry into carbon equivalent figures.
When running as SECR reporting software, the platform correlates energy flows with real-time manufacturing volume data to generate mandatory intensity ratios, such as kilograms of carbon dioxide equivalent per tonne of product. These automated sustainability reporting tools compile records that satisfy the rigorous uncertainty thresholds of industrial emissions monitoring systems under the EU Emissions Trading System (EU ETS) Monitoring and Reporting Regulation.
When implementing an industrial energy management system UK facilities require platforms that provide proactive insight alongside retrospective reporting. By layering predictive energy analytics for industry, operators can forecast energy demand patterns to avoid peak tariffs and Triad charges under the UK Energy Act 2023. This turns compliance from an administrative cost into an active driver of operational cost reductions.
This article reflects the independent analysis and editorial opinion of EnerTherm Engineering. Product names, trademarks, and brands mentioned belong to their respective owners. EnerTherm Engineering is not affiliated with, endorsed by, or a licensee of any third-party software or product mentioned unless explicitly stated.

Managing Director — EnerTherm Engineering
Dr. François Pierrel is Managing Director of EnerTherm Engineering with over two decades of expertise in thermal design, heat transfer, and industrial energy optimisation. He holds a PhD in Heat Transfer from Cranfield University and a Post-Doctorate from Heriot-Watt University.
