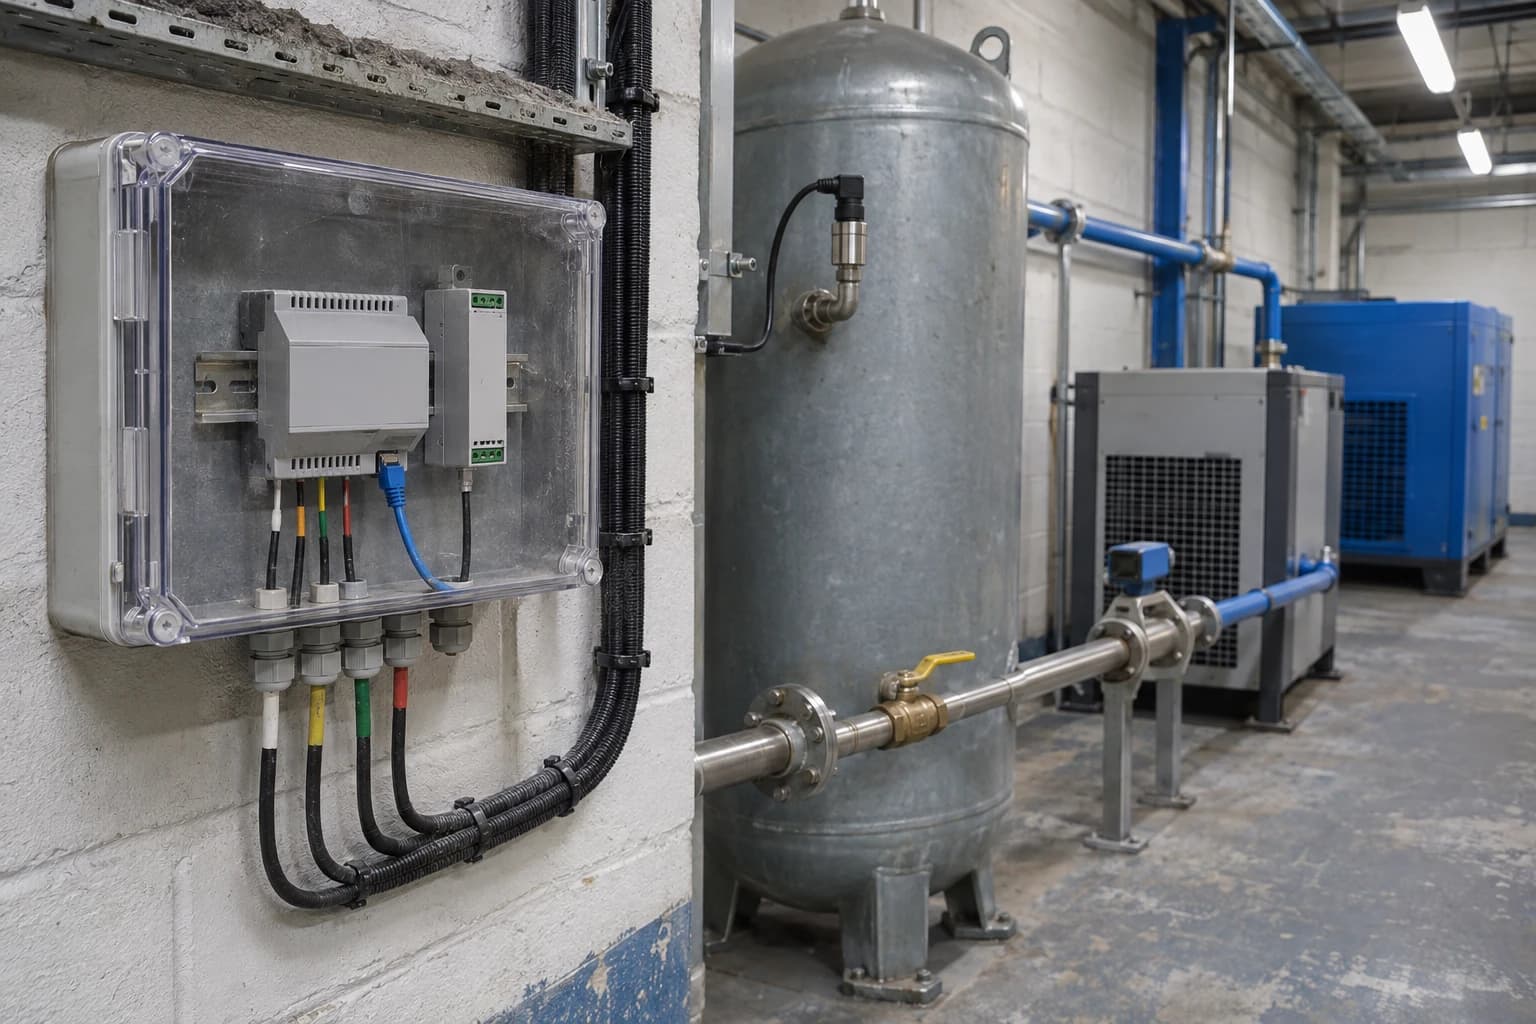
Industrial IoT Energy Gateway Finds Compressed-Air Losses
Read-only telemetry can expose compressed-air leaks without changing PLC or BMS controls.
An industrial IoT energy gateway is a read-only device that collects utility and operating data from meters, PLCs, BMS and SCADA systems, then transfers approved information to an energy-management platform for analysis. The US Department of Energy reports that compressed-air leaks can waste 20 to 30% of compressor output, making air losses a material electricity cost for many industrial sites.
Compressed air often becomes an unmanaged overhead because its waste is hard to see. A compressor continues to load, electricity use remains elevated and pressure may appear adequate at the compressor room. Meanwhile, leaks, open blow-offs, unisolated machinery and poorly controlled end uses consume air across the distribution network.
An industrial IoT energy gateway gives engineers a continuous view of that demand. It aligns compressed-air flow, system pressure, compressor electricity and production state in one record. This creates evidence for targeted leak repair, better isolation and more informed compressor-control decisions without altering existing process control.
For UK manufacturing and process sites, the practical challenge is integration. Plants may already have power meters, compressor controllers, pulse-output gas and water meters, BMS points and PLC data. Useful information sits in separate systems, carries inconsistent timestamps or reaches the energy team only through manual readings. A gateway provides a collection layer between those sources and an energy intelligence platform.
Why compressed-air losses need continuous data
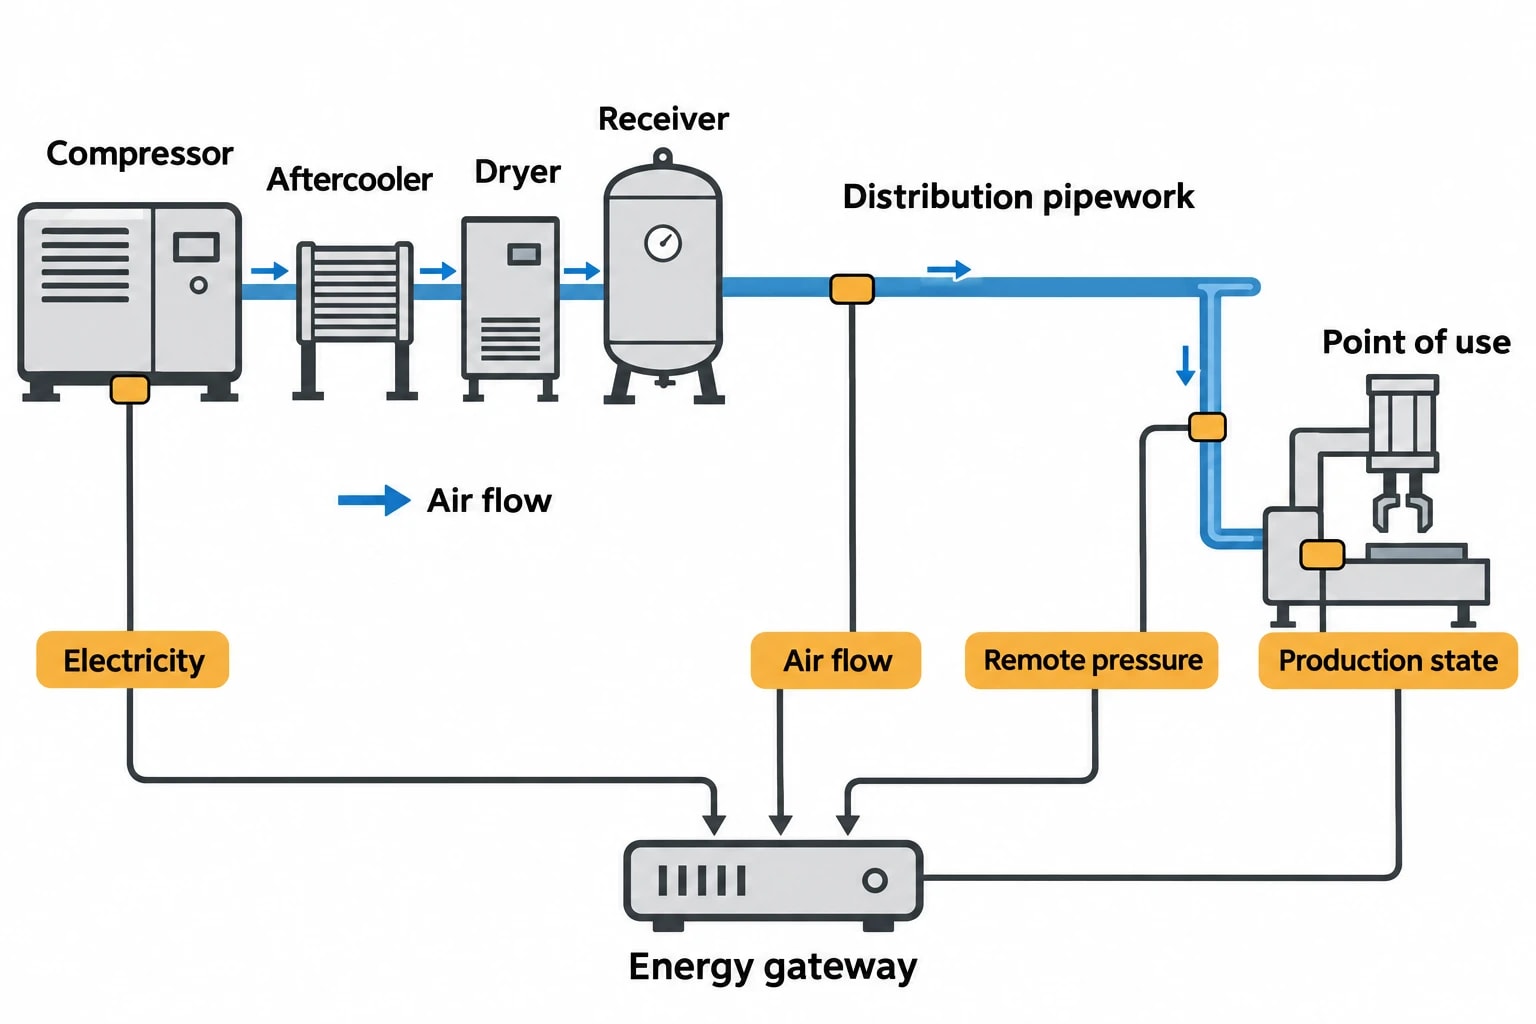
Compressed air consumes electricity at several stages. The system compresses air, removes heat and moisture, stores it, distributes it through pipework and regulates it at the point of use. A leak therefore increases compressor running hours, maintenance demand and, in some cases, the pressure setpoint needed to maintain production performance.
A one-off ultrasonic survey remains valuable for locating specific leaks. It gives a maintenance team a repair list and can identify damaged fittings, couplings, hoses, valves and drains. Its limitation is that it represents a particular operating condition. A site may have different shift patterns, temporary connections, closed production cells or equipment isolated only intermittently.
Continuous monitoring answers different questions:
- Does compressed-air demand fall to a credible base load during planned shutdowns?
- Does overnight flow persist after production equipment has stopped?
- Have repairs reduced compressor electricity use as well as measured air flow?
- Does pressure fall at a remote production area during peak demand?
- Has machine operation created new out-of-hours air demand?
- Is compressor capacity running because of legitimate process demand or avoidable loss?
The distinction matters. A consistently high air flow on a non-production weekend can justify investigation. High flow during a cleaning cycle, instrument-air duty or continuous process may be legitimate. The gateway supplies the operating context needed to separate the two.
The cost of treating air as a fixed utility
The US Department of Energy identifies leakage as a source of higher operating costs, pressure fluctuation, excess compressor capacity and additional maintenance. Leaks can force compressors to run longer, increasing wear on supply equipment.
The effect compounds when a site responds to a pressure problem by increasing compressor discharge pressure. That response may restore pressure at a distant machine, but it can conceal restrictions, damaged fittings, undersized pipework or uncontrolled demand. Engineers need pressure readings at relevant points in the distribution system, not only at the compressor outlet.
A data-led compressed-air programme treats leakage as a measurable operating condition. It establishes a baseline, identifies deviation, directs physical inspection and checks whether repairs hold over time.
Omni Vision delivers turnkey utility metering, CO2 tracking, and AI-powered production KPI intelligence — giving you real-time dashboards and actionable insights across your entire facility.
What an industrial IoT energy gateway should collect
The gateway should collect enough information to compare air demand with the electricity needed to supply it. Compressor kWh alone can indicate increased energy use, but cannot distinguish leakage from higher production demand. Flow alone can show a sustained base load, but cannot reveal whether the compressor arrangement is operating efficiently.
A practical compressed-air monitoring arrangement combines utility and operating signals.
| Measurement | Typical data source | Operational value |
|---|---|---|
| Compressor kWh and kW | Power meter or compressor controller | Measures electrical input, run hours and loading pattern |
| Compressed-air flow | Thermal mass flow meter | Shows demand profile, base load and sustained idle-period flow |
| System pressure | Pressure transmitter or compressor controller | Identifies pressure instability and distribution losses |
| Compressor status | PLC or compressor controller | Distinguishes running, loaded, unloaded, stopped and fault states |
| Production state | PLC, MES or supervisory system | Separates production demand from losses or idle consumption |
| Ambient conditions, where relevant | BMS or local sensor | Provides context for compressor performance and site conditions |
The data interval should reflect the decision being made. Fifteen-minute utility totals may support monthly energy reporting, but can hide compressor cycling, short breaks and pressure events. Compressor kW, flow, pressure and operating status usually need a faster interval to expose changes in operating behaviour. The platform can aggregate those readings for weekly, monthly and compliance reporting.
Time alignment is an engineering requirement
Time alignment determines whether a site can draw a reliable conclusion from its data. If the compressor power meter reads at one interval, the flow meter at another and production data arrives as a shift total, an apparent correlation may mislead.
Controls and energy teams should agree:
- A common clock and time-zone convention.
- The sampling interval for each measurement.
- How meter totals and instantaneous readings are handled.
- What constitutes a verified production stop.
- How missing, implausible or reset meter values are flagged.
- Which production measure, such as tonnes, batches or operating hours, provides a valid denominator.
A clear tag structure also prevents confusion later. A tag called CA01_FLOW has limited value outside the commissioning team. A useful record identifies the compressor station, header or production area, engineering unit, meter direction, source device and associated line or process.
Existing instruments can often provide the starting point
A gateway project does not necessarily require wholesale replacement of installed equipment. Sites commonly obtain useful signals from existing compressor controllers, electrical meters, BMS records and PLC tags. New flow or pressure instrumentation may be needed where existing data cannot show demand at the right boundary.
The first survey should establish what is already measured, where the measurement applies and whether the signal is suitable for energy analysis. A flow meter on a main header may reveal whole-site base load. A sub-metered branch can identify a high-demand process area. Both have value, but answer different questions.
How the industrial IoT energy gateway works
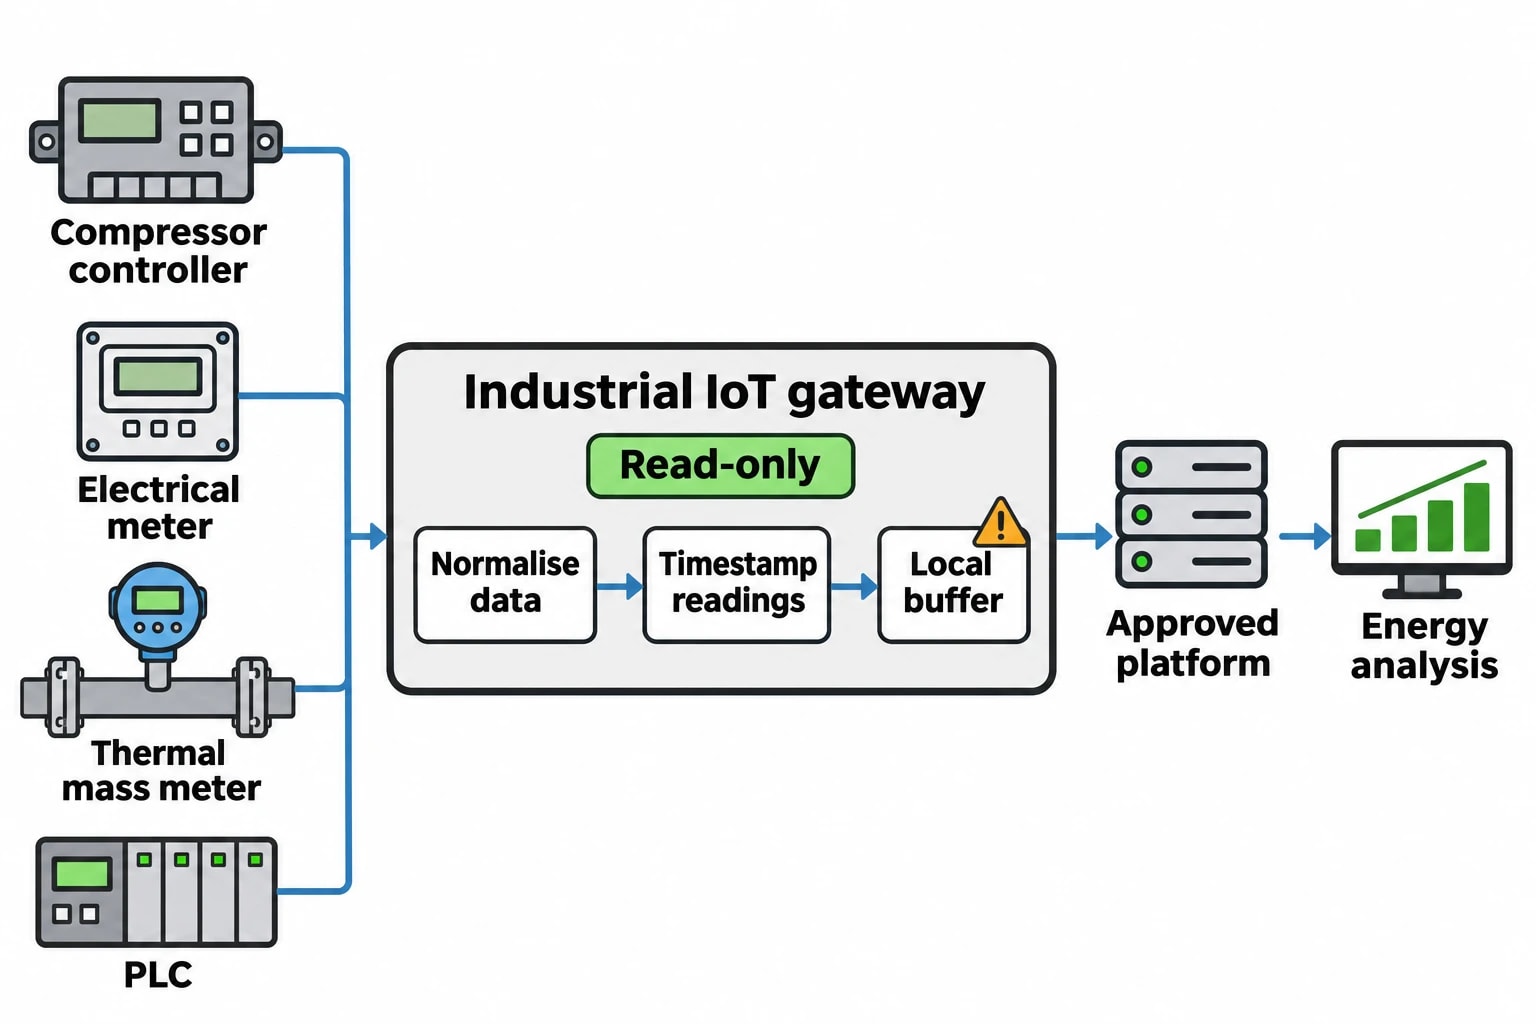
An industrial IoT energy gateway sits between operational data sources and the platform used for analysis and reporting. It reads selected measurements, converts them into a consistent data model, applies timestamps and sends telemetry to the approved destination.
This architecture avoids a rip-and-replace project. Existing devices can remain in service while the gateway gathers the utility information needed for analysis.
Reading utility and operating signals
Industrial energy gateways commonly collect information through established protocols. Modbus is widespread in utility meters and packaged equipment. OPC UA can expose structured information from industrial systems. BACnet is common in building management systems. MQTT can transfer telemetry between edge devices and cloud services.
The gateway normalises data from these sources. This may include converting pulse counts into volume, scaling analogue readings, recording units and distinguishing cumulative energy totals from instantaneous power readings. The result is a consistent record that lets analysts compare electricity, gas, water, steam, compressed air and oil against production activity.
For compressed air, the gateway may read compressor status and pressure from a controller, kWh from an electrical meter and flow from a dedicated thermal mass meter. It can then associate those readings with a line-running signal from a PLC or supervisory system.
Read-only collection protects production operations
Energy monitoring should collect only the values required for the stated purpose. A compressed-air study may need access to flow, pressure, compressor status and production-state data. It does not need authority to change compressor setpoints, PLC logic, BMS schedules or process alarms.
Read-only, segregated access supports integration without disrupting operations. Controls engineers remain responsible for confirming which tags are appropriate, stable and safe to expose. The gateway configuration should document approved source points and preserve the distinction between monitoring and process control.
Maintaining data continuity
Industrial sites have maintenance windows, temporary network interruptions and equipment changes. A gateway should retain readings locally during a communications outage and forward them when the upstream connection returns. This store-and-forward capability protects continuity for energy analysis and evidence records.
Data-quality rules also need attention. Meters can lose communication, produce implausible values after reconfiguration or reset cumulative totals after a power interruption. The energy platform should identify these events and distinguish source readings from substituted or estimated values. An unexplained data gap can undermine confidence in a claimed saving.
How compressed-air leakage appears in gateway data
A leak rarely announces itself through one isolated reading. The strongest evidence comes from the relationship between flow, pressure, compressor electrical demand and verified production state.
Out-of-hours base load
The clearest starting point is often an idle-period comparison. Engineers can review compressed-air flow and compressor kWh during production, then compare those readings with nights, weekends or planned shutdowns when relevant equipment is confirmed inactive.
A sustained flow during an idle period indicates a base load. The next step is to establish whether it serves a legitimate continuous requirement, such as instrument air or an essential process, or indicates leakage and unisolated demand.
Repeated comparisons are more reliable than a single shutdown test. They reveal whether the base load is persistent, varies by shift, links to a particular area or is affected by maintenance work.
Pressure, flow and compressor load
Pressure data should be interpreted with flow and operating state. A remote pressure decline may indicate a leak, but can also result from high legitimate demand, a restriction in the distribution network or inadequate local storage.
High compressor discharge pressure combined with poor pressure at the point of use deserves investigation. Engineers should inspect the distribution system before accepting a higher compressor setpoint as the solution. The site may have pressure losses across filters, regulators, couplings or undersized pipework.
Compressor status adds further context. Frequent load-unload cycling, extended unloaded running or multiple compressors running at part load can indicate that the supply arrangement does not match demand. These patterns do not prove leakage, but guide engineers towards the right inspection and control questions.
Verifying repair work
A repair programme needs a before-and-after comparison that accounts for production. Comparing two monthly utility totals alone can produce a false result if output changed.
A stronger verification method compares equivalent operating periods using:
- Confirmed production state and shift calendar.
- Similar operating hours and product mix where possible.
- Compressed-air flow during idle and active periods.
- Compressor kWh, loaded hours and pressure performance.
- Documented repairs, isolations or operator-approved control changes during validated change windows.
The desired result is a sustained fall in idle-period flow, compressor electricity or loaded run time while required pressure and production performance remain stable. This gives maintenance teams evidence that work has reduced waste rather than merely shifted operating conditions.
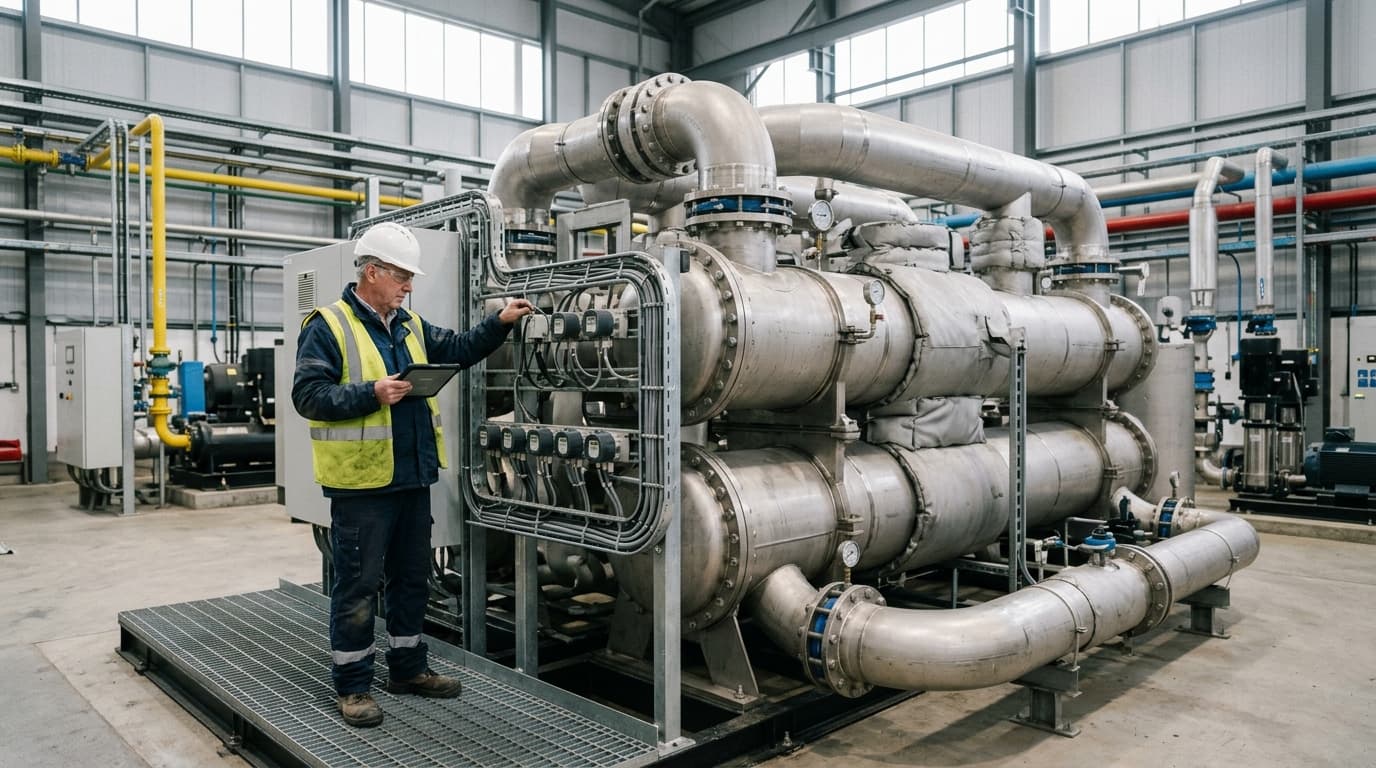
Track energy consumption, emissions, and process parameters with seamless PLC/SCADA integration via Modbus, OPC-UA, and MQTT protocols.
From compressed-air data to energy intensity
A whole-site electricity total cannot show whether energy use has changed because of output, utility losses or altered operating practice. Production-linked metrics make the data actionable.
Relevant industrial measures may include compressed-air kWh per batch, compressor electricity per tonne, air flow per operating hour or steam consumption per unit of finished product. The selected indicator should reflect the asset or activity being assessed.
ESOS Phase 4 and energy-intensity ratios
The Energy Savings Opportunity Scheme Regulations 2014, as amended by the Energy Savings Opportunity Scheme (Amendment) Regulations 2026, require qualifying organisations in ESOS Phase 4 to calculate energy-intensity ratios for buildings, transport, industrial processes and other energy uses. The Phase 4 notification-of-compliance deadline is 5 December 2027.
The Environment Agency states that the activity indicator for each organisational purpose must be quantifiable, associated with the relevant assets or activities, and calculated using verifiable data where reasonably practicable or a reasonable estimate.
An industrial IoT energy gateway supports this work by automating the consumption side of the ratio and collecting authorised production-state data. A site can then distinguish increased utility use driven by higher output from deterioration in energy performance.
Building records that withstand review
Energy data becomes more useful when the site can explain where it came from and how it was treated. This supports ESOS evidence packs and energy-management systems based on ISO 50001:2018.
An audit-ready record should retain:
- Meter identity, physical location and measured utility.
- Engineering units and scaling applied at the gateway.
- Source-system tag references.
- Timestamp convention and sampling interval.
- Data-quality status and missing-data treatment.
- Changes to meter configuration or tag mappings.
- Production definitions used in energy-intensity calculations.
- Baseline and comparison periods used to assess improvements.
This discipline helps teams move from a suspected leak to a defensible energy-saving measure.
Omni Vision for general-industry utility monitoring
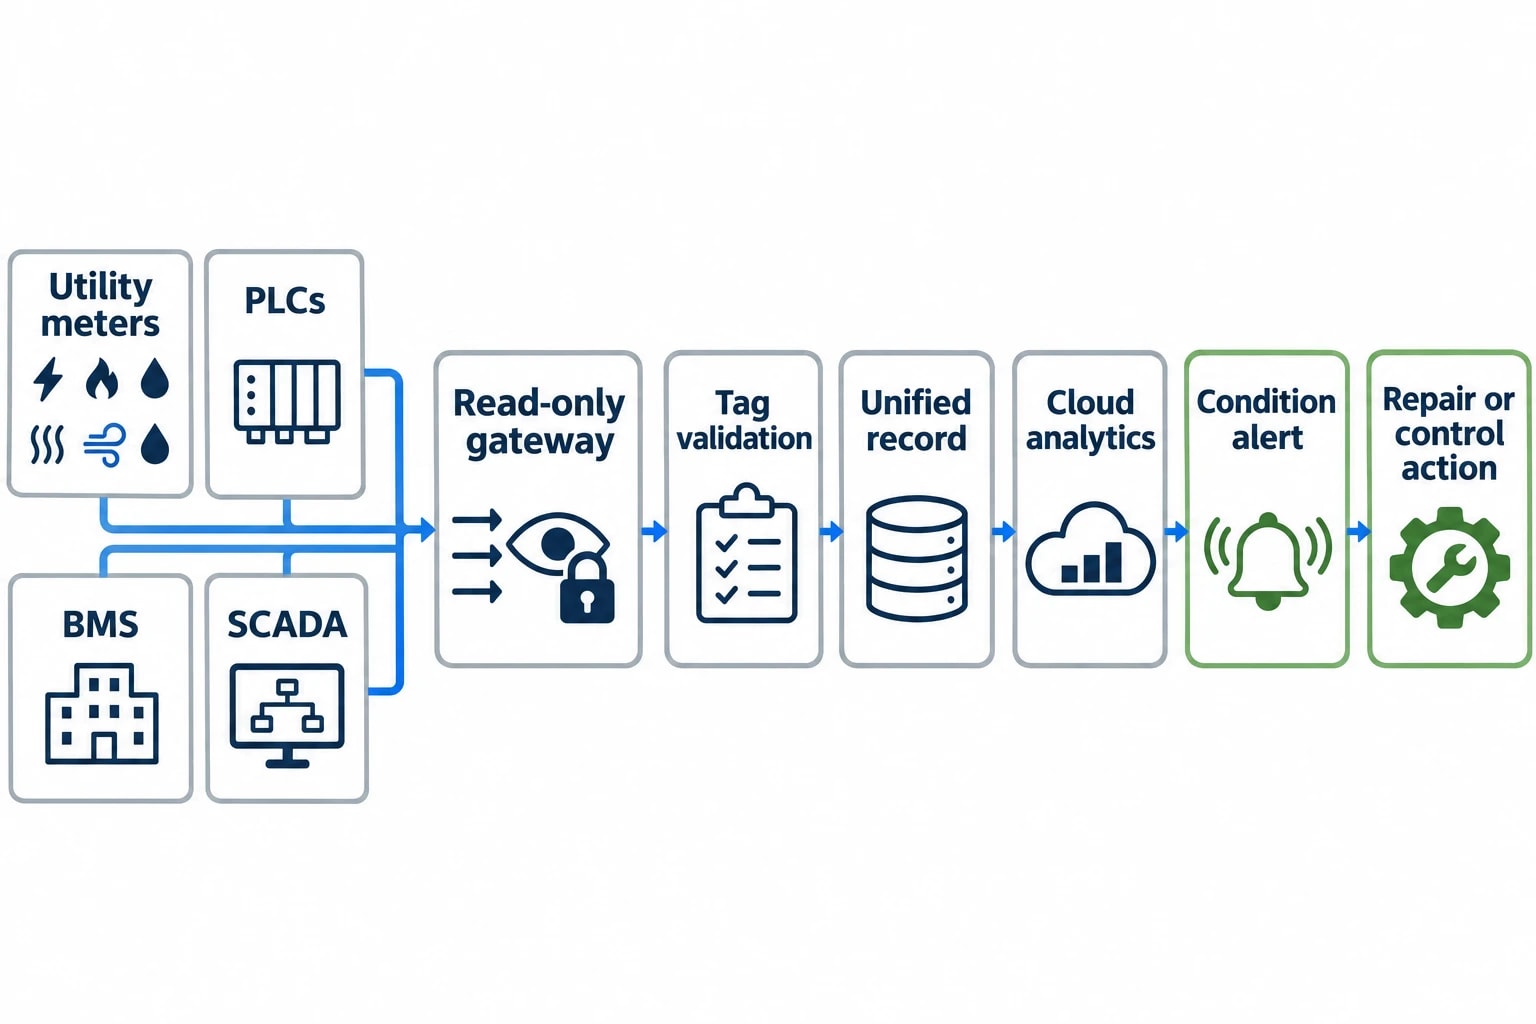
EnerTherm Engineering’s Omni Vision Energy Intelligence Platform combines precision hardware integration and secure PLC connectivity with EPSA cloud analytics. For general-industry sites, the platform is designed to collect data from electricity, gas, water, steam, compressed air and oil systems, then relate utility consumption to production and operating conditions.
The industrial IoT energy gateway provides the site-level collection layer. It can gather approved information from existing meters, PLCs, BMS and SCADA systems using protocols including Modbus, OPC UA, BACnet and MQTT. EPSA analytics can support anomaly detection, forecasting and production-linked KPI analysis.
A deployment focused on usable information
The first stage is a data inventory. Teams identify utility boundaries, installed meters, compressor controls, production signals and reporting objectives. A compressed-air project should define whether it seeks to reduce idle-period demand, improve pressure performance, validate repairs or establish an energy-intensity baseline.
Configuration follows the survey. Engineers select relevant tags, validate readings against local meter displays and test data against known events such as compressor starts, shift changes and planned shutdowns.
After validation, the platform can establish a baseline and notify teams when a relevant condition occurs. Examples include compressed-air flow above an agreed threshold during a verified non-production period, rising compressor kWh per unit of air delivered or persistent pressure loss in a monitored production area.
EnerTherm Engineering describes an 8 to 16 week turnkey deployment model for Omni Vision. The outcome is a clear evidence trail that allows energy managers, facilities teams and controls engineers to reduce utility waste without interfering with plant operations.
A measurable starting point for wider utility management
Compressed-air losses provide a practical first use for an industrial IoT energy gateway. The data requirement is clear: measure air flow, pressure, compressor electricity and operating state, then compare the result with verified production activity.
That approach gives maintenance teams a repeatable way to identify abnormal base loads, direct inspections and confirm that repair work has delivered a lasting reduction in demand. It also creates a data foundation for wider monitoring of electricity, gas, water, steam and oil.
This article reflects the independent analysis and editorial opinion of EnerTherm Engineering. Product names, trademarks, and brands mentioned belong to their respective owners. EnerTherm Engineering is not affiliated with, endorsed by, or a licensee of any third-party software or product mentioned unless explicitly stated.

Simulation Engineer — EnerTherm Engineering
Rajesh Sekar is a Simulation Engineer at EnerTherm Engineering, specialising in computational fluid dynamics (CFD), finite element analysis (FEA), and thermal process simulation. He holds a degree from Cranfield University and brings extensive experience in simulation-based product development from the automotive, aerospace, and energy sectors.
