ESOS Phase 4 Sets a 2027 Deadline for UK Energy Data
How manufacturers can align utility data with Scope I and II reporting by 2027.
Decarbonising industrial operations means reducing energy use and Scope 1 and 2 emissions from industrial assets, processes and utilities while maintaining production performance. UK organisations qualifying for ESOS Phase 4 must submit a notification of compliance by 5 December 2027, making reliable energy data an operational requirement as well as a reporting task.
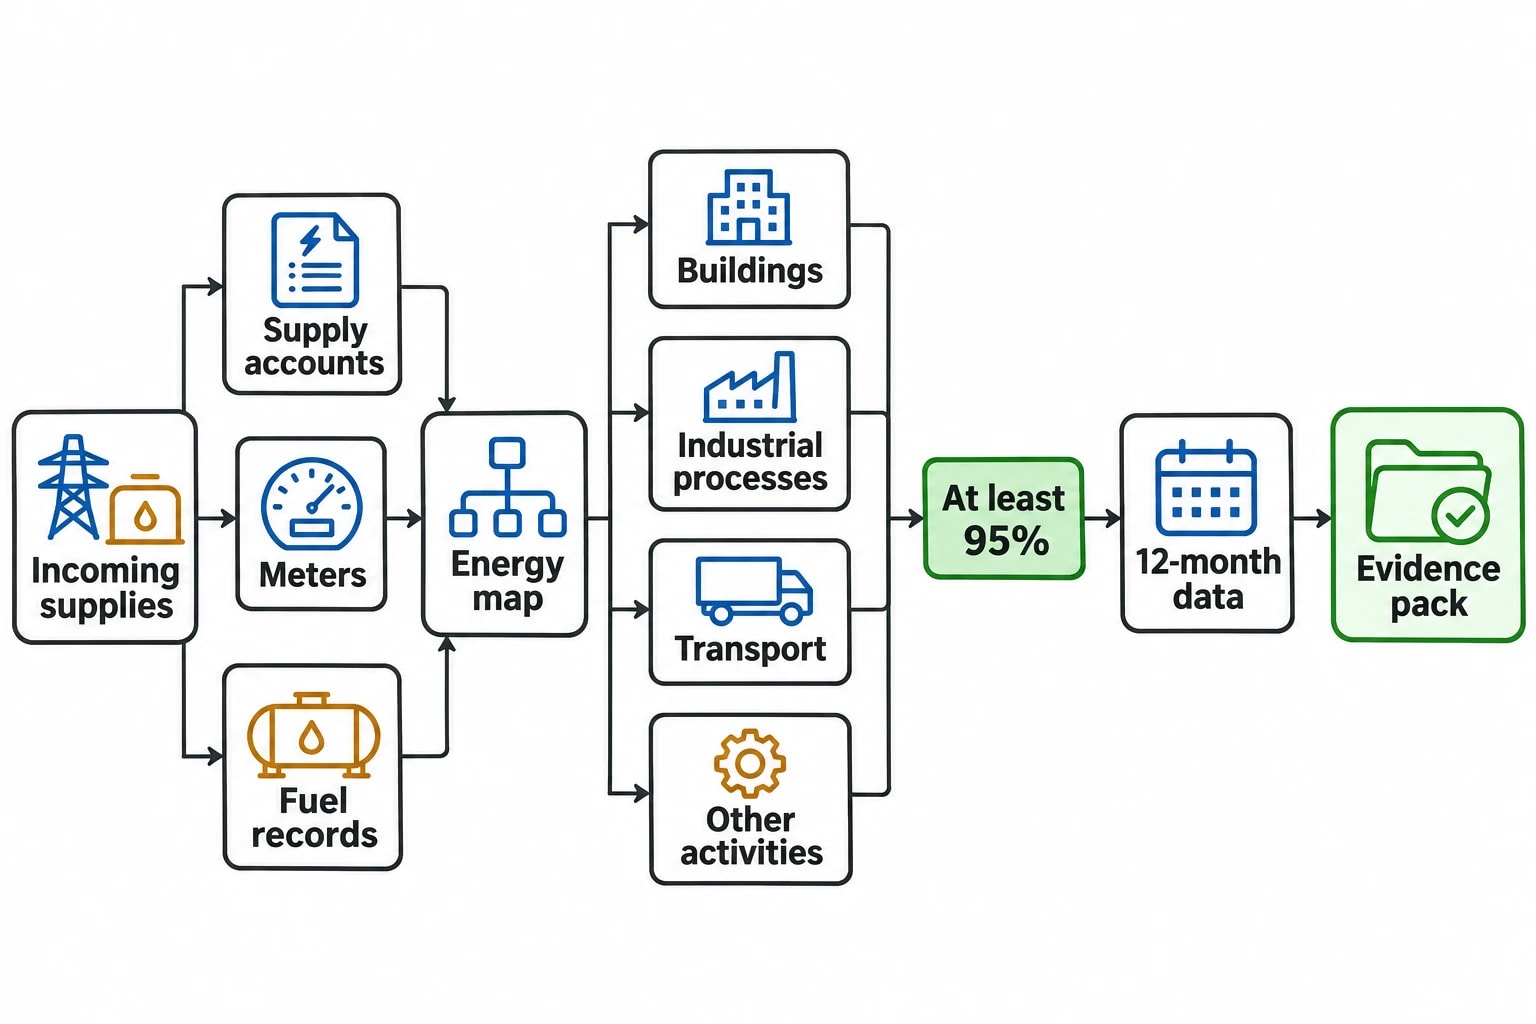
The deadline applies to organisations that meet the ESOS definition of a large undertaking on 31 December 2026. Their assessment must cover energy used in buildings, industrial processes and transport. Areas of significant energy consumption must account for at least 95% of total energy consumption.
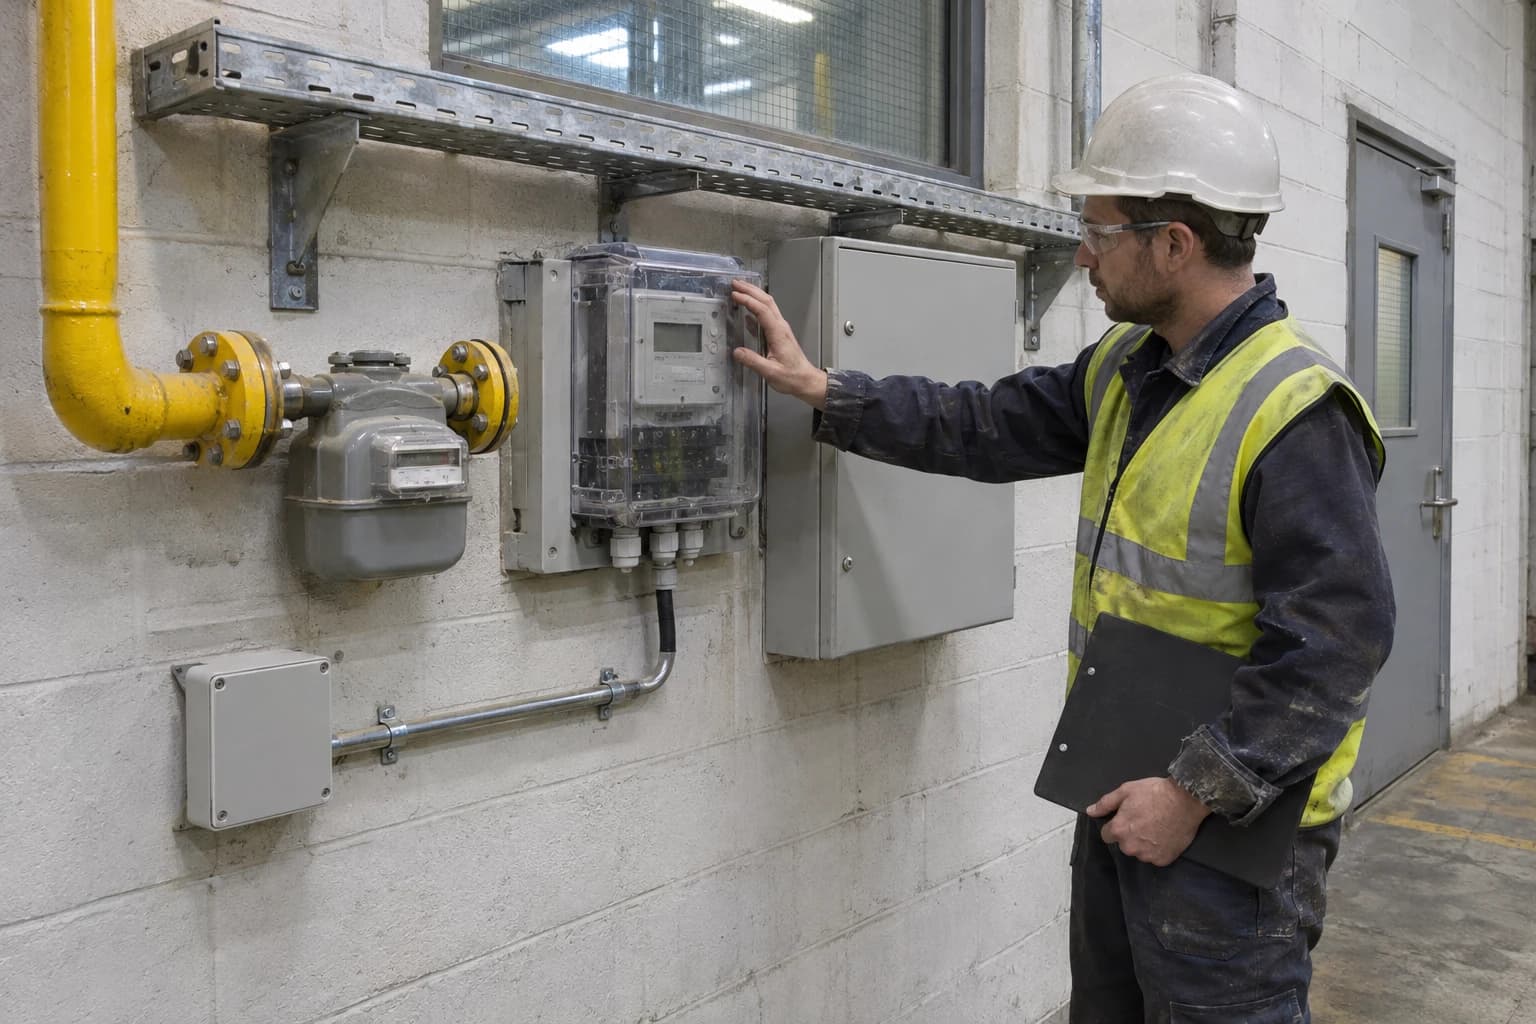
For a manufacturer, this shifts the focus beyond annual electricity and gas bills. A finance ledger can establish total spend. It rarely shows why a drying line consumed more gas, whether a compressed-air system ran outside production hours, or whether a boiler-efficiency project reduced fuel per tonne. Those distinctions determine which decarbonisation measures need capital and which require maintenance or changes in operating practice.
What ESOS Phase 4 requires from industrial energy data
Qualifying organisations need a group-wide view
ESOS applies to large UK undertakings and their corporate groups. The first compliance task is organisational, not technical. Energy managers need to identify the legal entities, sites, assets and activities within the reporting boundary before calculating consumption.
The total must include energy purchased for:
- Buildings and supporting services
- Industrial processes
- Transport
- Other activities where the organisation pays for the energy
A site with several incoming supplies can create avoidable errors. Electricity may be purchased centrally, gas may be contracted by an individual factory, and transport fuel may sit within a separate fleet account. A controlled register of supply accounts, meters, fuel records and responsible owners gives the ESOS assessment a traceable starting point.
Significant energy consumption means more than a site total
ESOS requires significant energy consumption to represent at least 95% of total energy consumption. This does not mean every small electrical load needs its own meter. It requires a documented approach showing which assets and activities account for the great majority of consumption.
For an industrial site, significant energy uses may include:
- Gas-fired boilers, ovens, dryers, kilns and furnaces
- Electric motors, pumps, fans and process drives
- Refrigeration and cooling systems
- Compressed-air generation and distribution
- Steam generation and major steam users
- Process heating, ventilation and extraction
- Company-operated vehicles and materials-handling equipment
The energy map should begin at incoming utility supplies, then follow distribution into major departments, plant rooms and production lines. This exposes gaps in coverage. A factory may have a fiscal electricity meter and a boiler gas meter, yet lack data that distinguishes refrigeration from production motors or separates a continuously operating compressor from the equipment it serves.
The 12-month evidence requirement needs disciplined records
An ESOS energy audit must use, so far as reasonably practicable, verifiable energy-consumption data measured over a 12-month period. It must analyse consumption and energy efficiency, identify saving opportunities and include site visits.
Verifiable does not mean perfect. It means the organisation can explain where a figure came from, how it was checked and why any estimate was reasonable. A useful evidence pack records:
- Meter and supply identifiers
- Physical meter locations and the loads represented
- Units, multipliers and data intervals
- Start and end dates for each data set
- Invoice reconciliation checks
- Missing-data treatment and estimation method
- Known changes to site layout, production or metering
- The person responsible for approving corrections
This record matters when a lead assessor asks why sub-metered electricity differs from the main incoming supply. It also prevents a common reporting problem: a meter replacement changes a multiplier, but the resulting step change is mistaken for an energy-saving project.
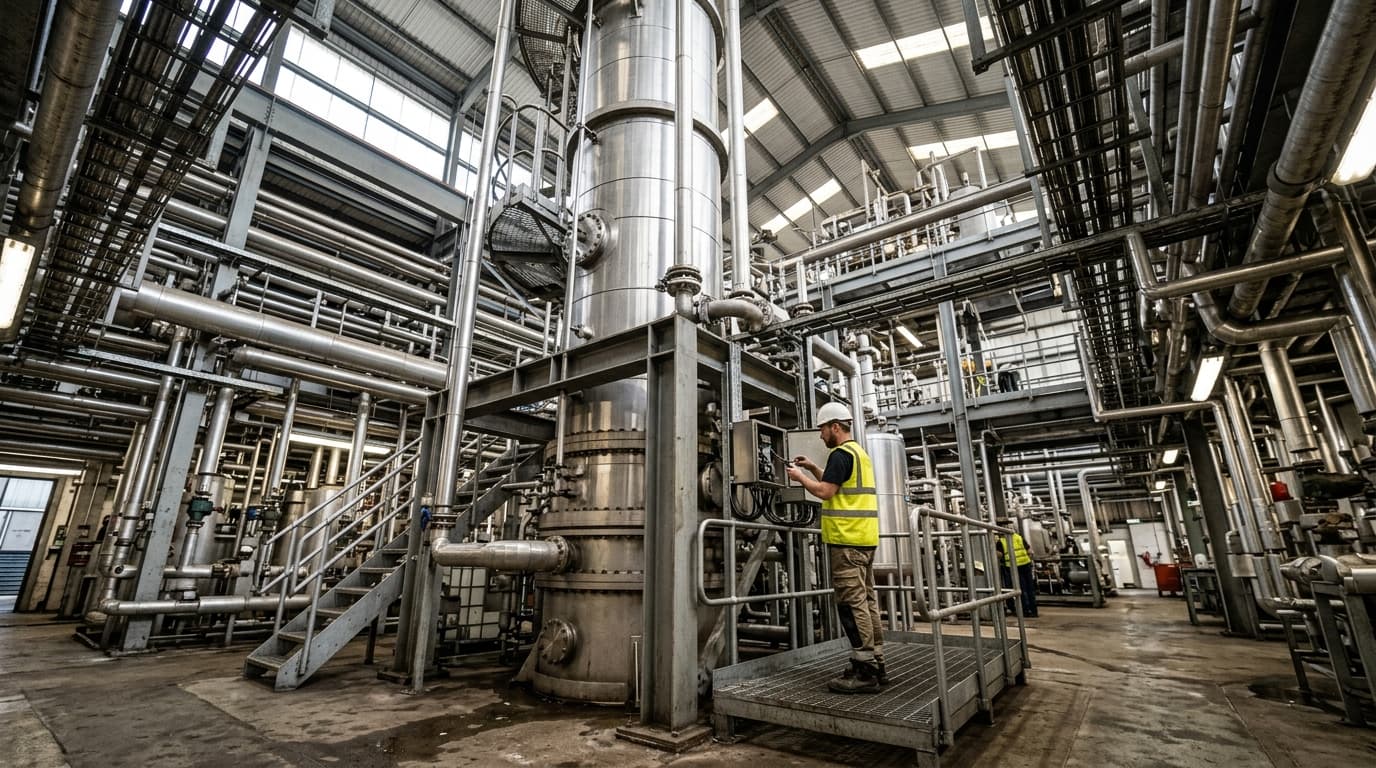
Omni Vision delivers turnkey utility metering, CO2 tracking, and AI-powered production KPI intelligence — giving you real-time dashboards and actionable insights across your entire facility.
Decarbonising industrial operations starts with utility intelligence
Utility data must reflect physical energy flows
Industrial decarbonisation decisions depend on a clear distinction between total consumption and the equipment causing it. Electricity, gas, steam, compressed air, water and oil each reveal a different part of plant performance.
Electricity interval data can show base load, start-up demand, peak demand and unplanned overnight operation. Gas data can reveal the effect of production hours, combustion plant performance and process-heating demand. Steam data can identify departments that consume heat outside scheduled runs. Compressed-air energy data can expose persistent off-shift demand, which may indicate leakage, poor control settings or unsuitable compressor sequencing.
Water does not usually create Scope 1 or Scope 2 emissions at the point of use, but it remains useful operational data. Rising water consumption can point to higher pumping, treatment, cooling or heating demand. Linking that signal to energy use may reveal a process issue before it appears in a carbon report.
Metering should answer a production question
Sub-metering delivers value when it resolves a decision that a main utility meter cannot answer. A meter plan should therefore begin with significant energy uses and the operating questions surrounding them.
A practical hierarchy is:
- Meter incoming electricity, gas, oil and purchased steam supplies.
- Meter major energy centres such as boiler houses, compressor rooms, refrigeration plant and central process heating.
- Meter high-consuming departments or production lines where energy varies with throughput, batches or operating time.
- Use calculated allocation only where direct metering would add little management value.
- Review coverage after plant changes, expansions and major energy projects.
The target is a coherent energy balance. Supply-level consumption should broadly reconcile with the sum of major downstream uses, allowing for documented distribution losses, measurement accuracy and unmetered small loads. Material discrepancies need investigation before figures enter an ESOS submission or annual carbon disclosure.
Data validation protects reporting credibility
A monthly total can conceal errors that interval data makes visible. Common issues include duplicate readings, gaps after communications failures, incorrect meter multipliers, reversed current transformers, time-zone mismatches and values recorded in different units.
Energy teams should run routine validation before reporting periods close. Checks can include comparison with supplier invoices and historic demand profiles, review of overnight and weekend consumption, and comparison of energy use against production or operating hours. A sudden step in energy intensity may represent a genuine process change, but it may also identify a failed meter or newly disconnected data feed.
A formal correction log protects the audit trail. It should preserve the original reading, explain the reason for adjustment, state the replacement value or estimation method, identify the approver and show when the change occurred.
Scope 1 and 2 reporting needs the same disciplined data
Scope 1 begins with on-site fuel use
Scope 1 covers direct greenhouse-gas emissions from sources owned or controlled by the reporting organisation. In industrial operations, this commonly includes natural gas or fuel oil burned in boilers, furnaces, dryers, ovens and other combustion equipment. It can also include fuel used in company-operated vehicles.
The evidence chain begins with physical activity data. Metered kWh, litres, cubic metres or fuel-purchase records must be complete, consistently converted and assigned to the reporting boundary. Teams should retain the source records behind each conversion, especially where fuel arrives at multiple sites or is drawn from shared storage.
Scope 2 requires transparent purchased-energy records
Scope 2 covers indirect emissions associated with purchased electricity, heat, steam and cooling. For many manufacturers, purchased electricity is the largest Scope 2 category and the most readily available data stream. It still needs careful boundary control.
A site that imports electricity while operating on-site generation needs records that distinguish imported electricity, exported electricity and fuel consumed in owned combustion assets. A factory receiving purchased steam needs to establish whether that steam sits within its Scope 2 boundary and retain supplier information needed for the selected reporting method.
The UK Government publishes company reporting conversion factors each year. Reporting teams should record the specific factor set and methodology used for the financial year, then retain both the activity data and calculation output. A carbon total cannot be reconstructed if fuel volumes, electricity consumption, conversion factors and the organisational boundary are stored in separate spreadsheets without version control.
Reporting cadence should match operational cadence
Annual reporting remains necessary for SECR and financial disclosures, but it arrives too late to manage energy performance. Industrial sites need a working cadence that supports action during the reporting year.
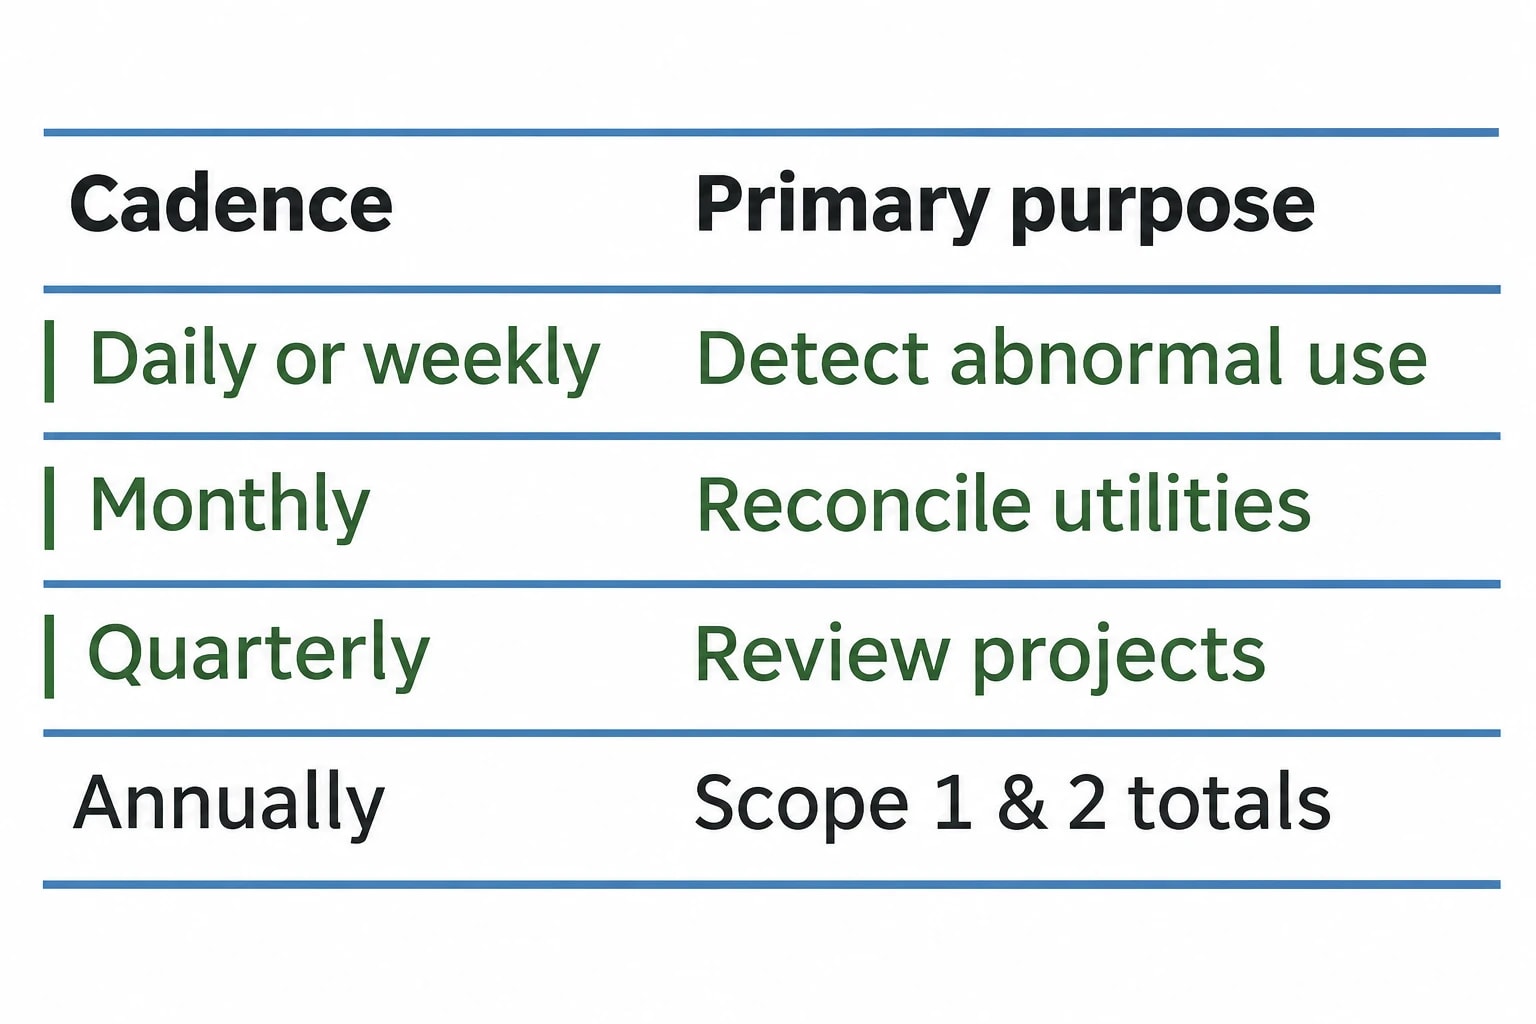
| Cadence | Primary purpose | Typical review |
|---|---|---|
| Daily or weekly | Detect abnormal use and missing meter data | Base load, off-shift consumption, sudden changes |
| Monthly | Reconcile utilities and production | Supplier bills, meter balance, energy intensity |
| Quarterly | Review projects and management action | Savings evidence, maintenance issues, capital decisions |
| Annually | Complete formal disclosures and ESOS evidence | Scope 1 and 2 totals, methodologies, action-plan progress |
This cadence gives sustainability directors traceable figures while giving operations teams information they can use during a production campaign.
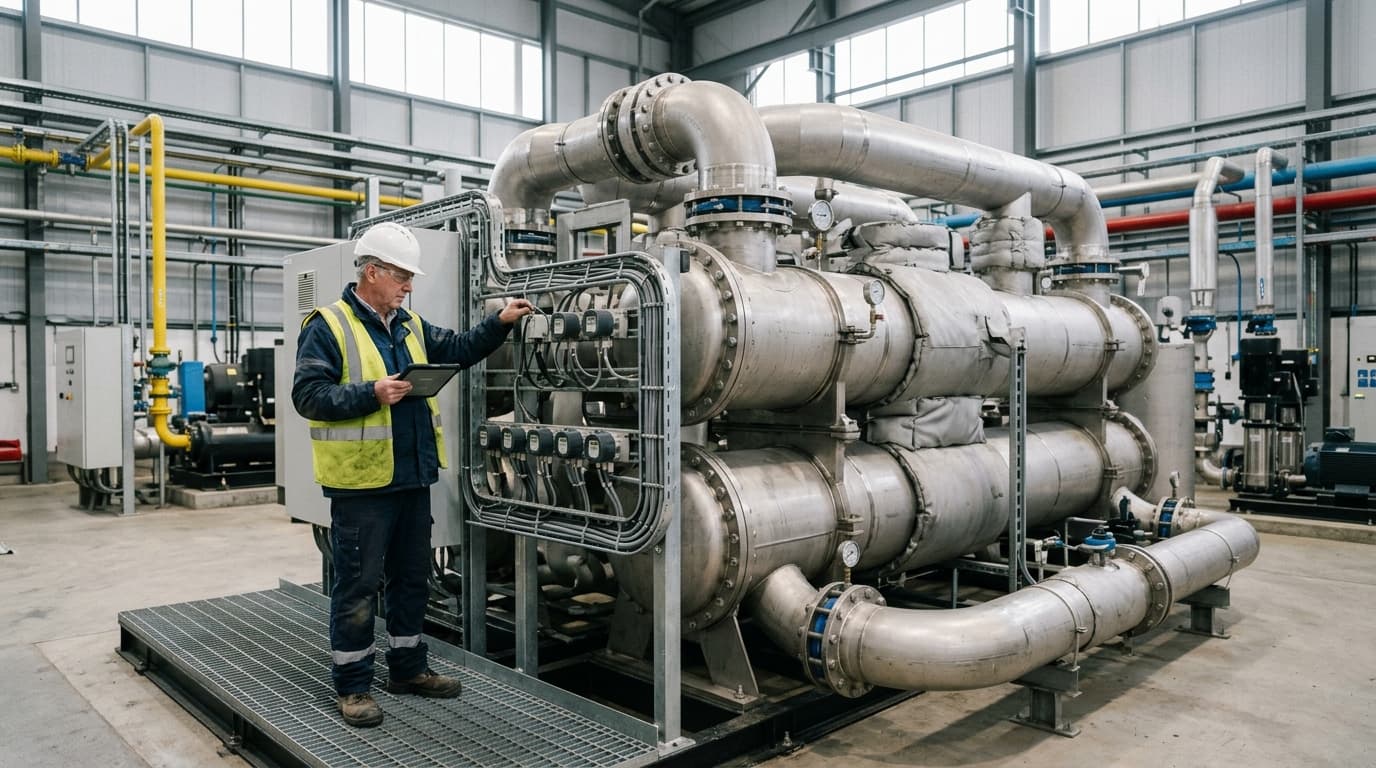
Track energy consumption, emissions, and process parameters with seamless PLC/SCADA integration via Modbus, OPC-UA, and MQTT protocols.
Energy performance indicators make savings evidence usable
EnPIs should reflect controllable performance
ISO 50006:2023 provides guidance on energy performance indicators, known as EnPIs, and energy baselines. These tools help organisations compare performance when output, weather, operating hours or product mix change.
A well-chosen EnPI connects energy consumption with a factor that site teams understand and can influence. Examples include electricity per tonne of product, gas per tonne of dried material, steam per batch, compressed-air electricity per operating hour and refrigeration electricity per pallet stored.
The chosen indicator should reflect the process. Energy per tonne may work well for a stable, high-volume production line. It can mislead at a facility producing multiple products with sharply different heat requirements. Energy per batch may better reflect a pharmaceutical or speciality chemical process, provided batch definition remains consistent.
Normalised baselines prevent false savings claims
A flat comparison between this year’s energy use and last year’s total can mislead. Lower output, shorter operating hours or a warmer winter may reduce consumption without any technical improvement. Higher production can hide a genuine reduction in energy required per unit.
ISO 50006:2023 identifies relevant variables as factors that significantly affect energy performance and change routinely. In industrial plants, these may include:
- Production volume
- Product grade or recipe
- Operating hours
- Ambient temperature
- Cooling demand
- Batch count
- Line speed
The baseline should document the period selected, data quality, relevant variables and method used to compare performance. Where operations change materially, the energy team should explain whether the baseline remains valid or needs adjustment.
Projects need before-and-after evidence
ESOS Phase 4 requires participants to report progress against action-plan commitments. The notification and ESOS report must include measures implemented, energy savings achieved and the category of each saving. Organisations must also review earlier action-plan measures that were not implemented and explain why.
That requirement calls for project records built before work begins. A proper project file should contain the original operating condition, baseline data, production context, project scope, implementation date, post-project data and savings method.
Consider a compressed-air project. A report claiming reduced energy use after a leak survey offers little assurance if production fell during the same period. A stronger record compares compressor electricity, operating hours, pressure setpoints and production conditions before and after the work. The evidence can then support ESOS reporting, a capital-investment review and an internal carbon claim.
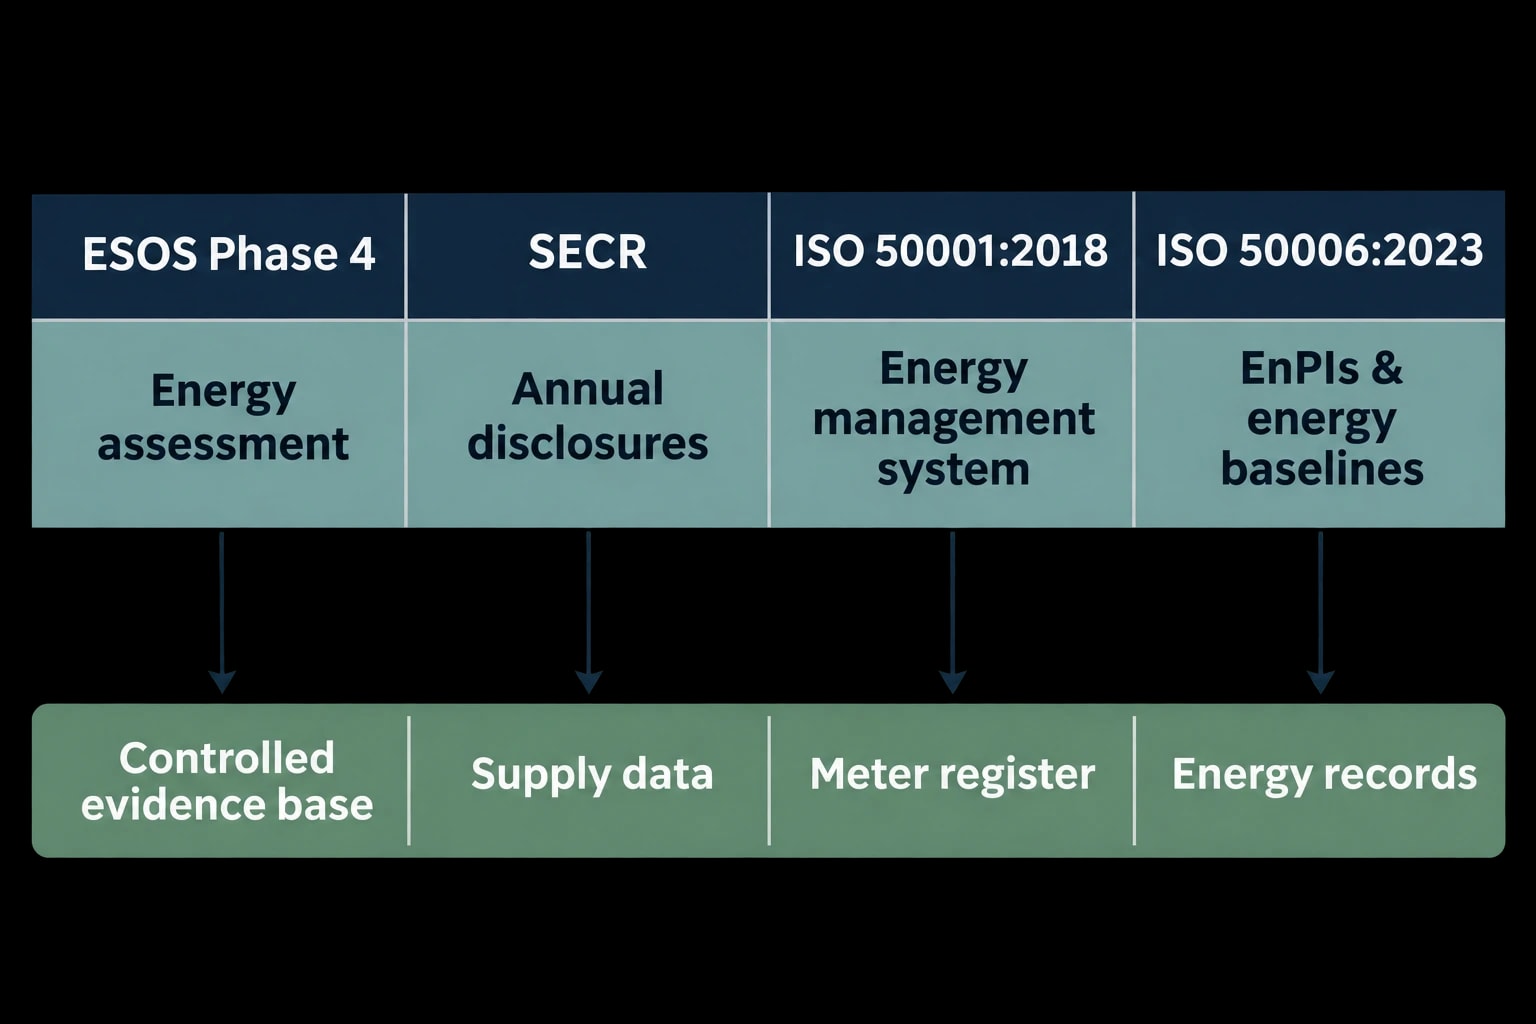
ESOS, SECR and ISO 50001 can use one controlled evidence base
Shared data does not mean identical disclosures
SECR applies to quoted companies and to unquoted companies and limited liability partnerships meeting at least two of three thresholds: more than 250 employees, more than £36 million turnover and more than £18 million balance-sheet total. In-scope organisations disclose energy use, greenhouse-gas emissions, an intensity ratio, energy-efficiency actions and methodology in their annual reports.
ESOS and SECR serve different purposes. ESOS examines energy consumption, saving opportunities and progress against action plans. SECR discloses energy and carbon information for a reporting period. They can still draw on the same controlled data foundation.
| Requirement | Main output | Shared evidence |
|---|---|---|
| ESOS Phase 4 | Energy assessment, opportunities, action-plan review and notification | Supply data, meter register, consumption profiles, project records |
| SECR | Annual energy and Scope 1 and 2 disclosures | Fuel and electricity data, emissions factors, intensity ratio, methodology |
| ISO 50001:2018 | Energy management system and continual improvement | Energy review, objectives, operational controls, measurement and management review |
| ISO 50006:2023 | EnPIs and energy baselines | Relevant variables, baselines, performance comparison method |
ISO 50001:2018 provides a framework for an energy management system. For ESOS Phase 4, a valid ISO 50001 certification can cover significant energy consumption or total energy consumption as an alternative compliance route, subject to scheme requirements. ISO 50006:2023 provides a disciplined method for showing whether performance improved.
EU-connected businesses face a related 2027 date
Organisations with operations in EU Member States should also examine Article 11 of Directive (EU) 2023/1791, the EU Energy Efficiency Directive. It requires Member States to ensure that enterprises averaging more than 85 TJ per year across the preceding three years implement a certified energy management system by 11 October 2027.
Enterprises averaging more than 10 TJ per year over the preceding three years that do not operate an energy management system must undergo an energy audit. National transposition measures determine how Member States apply these obligations. UK-based groups with EU sites should establish whether their metering boundaries, energy records and management systems can support both UK and EU requirements.
A practical route to the 2027 ESOS deadline
Build the evidence base before the audit programme begins
The strongest ESOS assessments begin with operational records, not a late request for invoices. A 2026 and 2027 programme should establish the reporting boundary, consumption map and data-validation routine before the lead assessor begins detailed analysis.
The immediate priorities are clear:
- Confirm which legal entities qualify and which sites, industrial processes and transport activities sit within the ESOS boundary.
- Create a supply and meter register covering electricity, gas, oil, steam, compressed air and material water use.
- Identify the significant energy uses that will form at least 95% of total consumption.
- Reconcile meter data with supplier bills and investigate material variances.
- Link major energy uses to output, run time, batches or other relevant operating variables.
- Set baselines before energy projects are implemented.
- Maintain project files showing the method used to estimate achieved savings.
- Prepare the action-plan review and evidence pack alongside the audit, rather than after recommendations are issued.
Specify utility intelligence around reporting evidence
For organisations evaluating Omni Vision for General Industry, the specification should focus on reporting evidence rather than generic platform claims. The practical test is whether the implementation can establish and maintain a documented meter register, cover the major electricity, gas, water, steam, compressed-air and oil streams, reconcile readings against supplier data, and preserve correction records.
The platform should support defined reporting periods, consistent units, production-linked indicators and retained evidence for Scope 1 and 2 calculations. Meter coverage should follow significant energy consumption. Data validation should be routine rather than a year-end exercise. Audit trails should retain source readings, calculation inputs, corrections and approvals.
Omni Vision monitors and informs. It gives energy managers a credible ESOS evidence pack, alerts operations teams to abnormal utility use, and provides sustainability directors with a defensible basis for Scope 1 and 2 reporting. Operators and building-management systems can then act on recommendations during validated change windows.
This article reflects the independent analysis and editorial opinion of EnerTherm Engineering. Product names, trademarks, and brands mentioned belong to their respective owners. EnerTherm Engineering is not affiliated with, endorsed by, or a licensee of any third-party software or product mentioned unless explicitly stated.

Technical Manager — EnerTherm Engineering
John Naranjo is Technical Manager at EnerTherm Engineering, bringing specialist expertise in chemical and environmental engineering. He recently led the implementation of Omni Vision, EnerTherm's real-time energy and utility monitoring platform. He holds an MSc in Environmental Engineering from the University of Huelva and a BSc in Chemical Engineering, with memberships in both the Energy Institute and IChemE.
