
Why Omni Vision Targets Sub-12-Month ROI in Chemical Plants
Omni Vision links six utility streams to cost-per-tonne KPIs for payback analysis.
The UK ESOS Phase 4 notification deadline is 5 December 2027, and qualifying companies need assessments based on verifiable 12-month energy data. For chemical plants still assembling utility figures from invoices, operator logs and spreadsheets, that requirement exposes a wider financial problem: management cannot confidently approve energy CAPEX without timely, production-linked evidence of where money is being lost.
Omni Vision targets a sub-12-month return on investment by turning process-level utility data into evidence that identifies actions for operators and building-management systems to take during validated change windows. The commercial case depends on energy spend, data quality, operating discipline and the ability to act on findings. It is strongest where energy-intensive equipment runs continuously, utility costs are material, and finance teams cannot reconcile energy use to production output.
Industrial energy optimisation ROI starts with an identifiable cost base
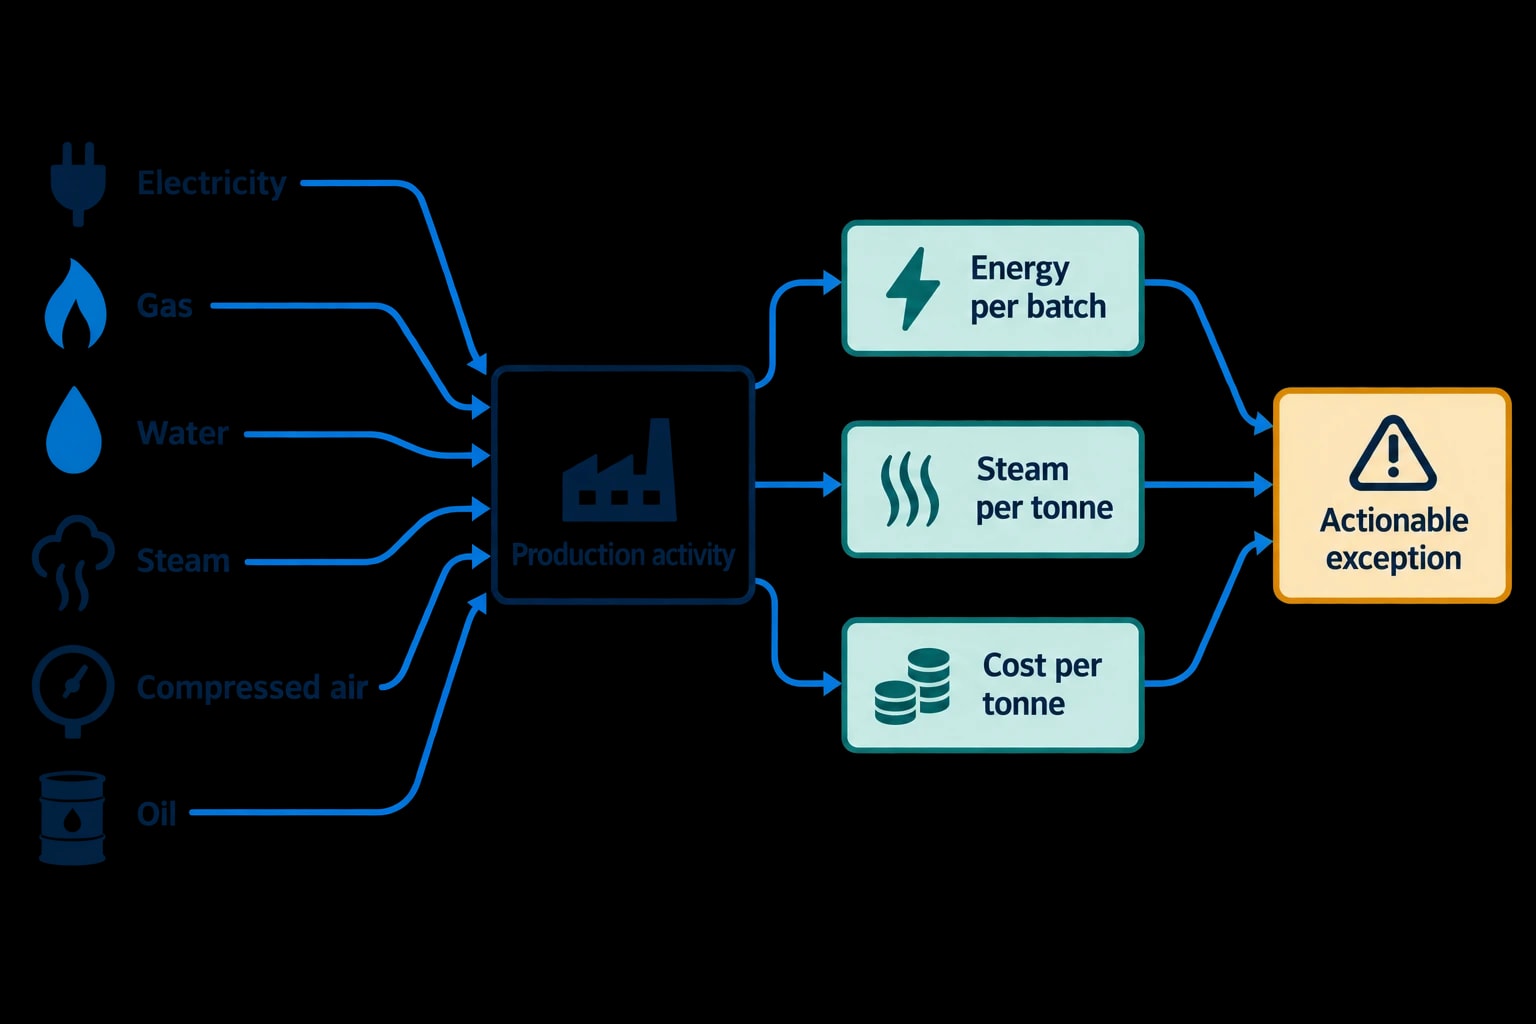
A chemical facility rarely consumes energy in one controllable block. Electricity drives motors, pumps, compressors and refrigeration. Gas may supply boilers, furnaces or thermal-oil systems. Steam supports heating, stripping and distillation. Compressed air, cooling water and process water often carry significant costs but receive less scrutiny than the electricity bill.
A monthly invoice can show total cost. It cannot explain why a distillation column consumed more steam per tonne this week, whether compressed-air demand rose during an idle period, or whether cooling-tower fans operated outside production requirements.
That gap weakens spreadsheet tracking in three ways.
- It creates a lag between consumption and investigation.
- It disconnects utility use from batch records, tonnes produced and operating hours.
- It leaves analysts reconciling source files rather than investigating high-value exceptions.
For a finance director, the investment case for industrial energy optimisation should begin with the addressable annual cost base, not a generic percentage target. A plant spending £2 million a year on relevant utilities has a larger opportunity than a site spending £250,000, even if both identify the same percentage improvement.
The second question is whether the site can locate savings at a level where operations can act. Plant-wide energy intensity may improve because output rises while a reactor, compressor or distillation train becomes less efficient. Process-linked measures expose that distinction. Examples include energy per batch, steam per tonne, compressed air per production hour and cost per tonne of saleable output.
Why chemical plants have a strong monitoring case
Chemical operations often combine variable recipes, batch changes, continuous assets and utility systems shared by several production areas. This makes comparison against last month’s bill unreliable. Higher electricity costs may arise from greater output, a change in product mix, a tariff event, a cooling problem or equipment running when it should be idle.
Granular monitoring makes the difference visible. Omni Vision brings electricity, gas, water, steam, compressed air and oil data into one view, then relates consumption to production activity. Operators can distinguish a legitimate change in energy use from an unexplained departure from the expected operating pattern.
Many early savings are operational. Operators or building-management systems may eliminate out-of-hours load, respond to a steam leak, address excessive compressor run time, revise equipment sequencing or avoid an expensive tariff period during validated change windows. These measures need clear evidence and prompt ownership more than major plant replacement.

Omni Vision delivers turnkey utility metering, CO2 tracking, and AI-powered production KPI intelligence — giving you real-time dashboards and actionable insights across your entire facility.
How Omni Vision builds a cost-benefit case
Omni Vision combines process-level metering and non-invasive connections to available PLC data with EPSA cloud analytics. Data flow is one-way: the architecture extracts data without write access and cannot write back to plant control systems. This matters in chemical and pharmaceutical environments, where process integrity, change control and production availability shape every technology decision.
The platform can work with established industrial connectivity methods including Modbus, OPC-UA, BACnet and MQTT. The objective is reliable timestamps, utility readings and production context without creating an operational dependency on the monitoring system.
From meter reading to accountable saving
A useful project separates observations from bankable actions. An anomaly alert has no financial value until a named person validates it, identifies the cause, agrees an intervention and confirms whether consumption returned to the expected range.
A practical workflow has four stages:
- Establish a baseline for each significant utility stream and production area.
- Link the baseline to output, product mix, weather or operating hours where those factors materially affect consumption.
- Investigate departures that exceed a defined financial or operational threshold.
- Record the corrective action, verified saving and any effect on production or quality.
This approach avoids counting theoretical savings twice and gives finance teams a traceable route from an alert to a validated cost reduction.
The savings categories that support payback
The most credible sub-12-month cases combine several savings categories rather than relying on one intervention.
| Savings category | Typical plant question | Evidence needed for validation |
|---|---|---|
| Avoidable base load | Which pumps, compressors or auxiliary systems consume energy outside required operating hours? | Interval utility data, operating schedule and production status |
| Process deviation | Why did steam, electricity or cooling demand rise per batch or per tonne? | Process-level meter data, output records and relevant operating conditions |
| Tariff exposure | Can operations move flexible load away from high-cost periods without affecting product quality? | Half-hourly or finer electricity data, tariff structure and production constraints |
| Utility loss | Where is a leak, failed control element or poor sequencing increasing demand? | Persistent load signature, maintenance findings and post-repair measurement |
| Reporting effort | How much analyst time is spent collecting, checking and reconciling source files? | Current process mapping, time records and reporting cycle evidence |
The 15 to 25% energy-cost-reduction target associated with Omni Vision is a project objective, not an automatic outcome. A mature facility with strong sub-metering may identify a narrower operational opportunity. A site with poor visibility, substantial utility spend and persistent unexplained variation may have a larger addressable cost base.
What a sub-12-month ROI model should include
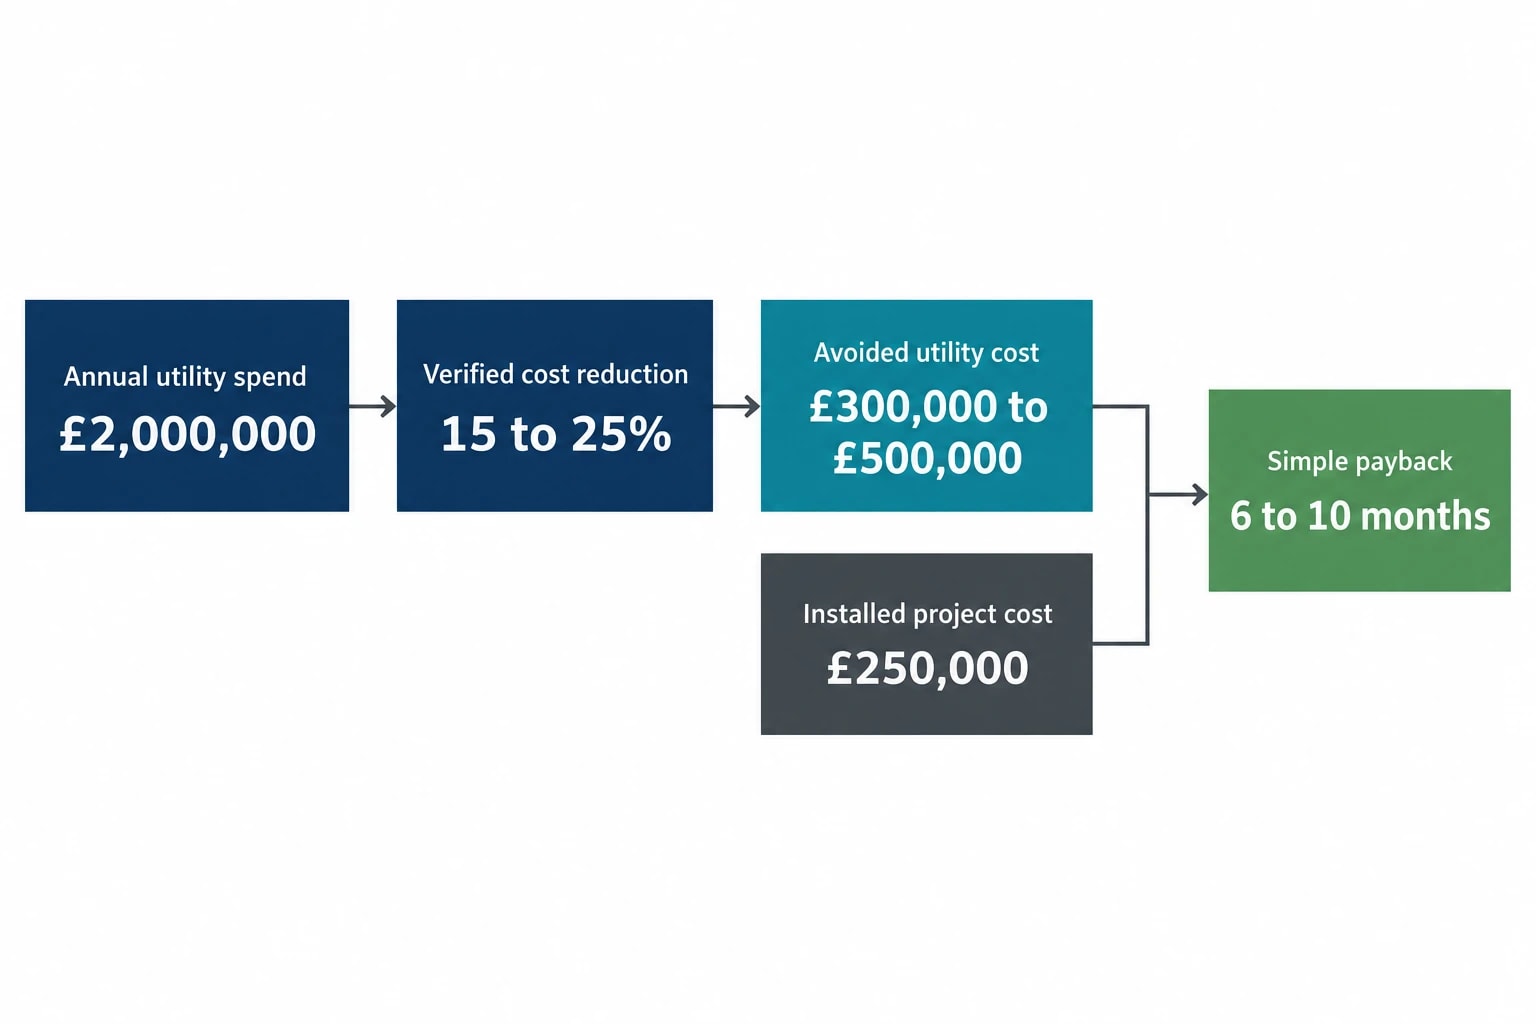
A short payback calculation needs more than a projected energy saving. It should show total installed cost, avoided utility expenditure, implementation timing, internal labour, maintenance implications and the confidence attached to each benefit.
The following scenario illustrates the arithmetic for a high-energy chemical facility. It is a planning example, not a performance claim.
| Item | Illustrative value |
|---|---|
| Annual addressable utility spend | £2,000,000 |
| First-year verified cost reduction | 15 to 25% |
| Annual avoided utility cost | £300,000 to £500,000 |
| Installed platform and project cost | £250,000 |
| Simple payback period | 6 to 10 months |
A 15 to 25% reduction on £2 million produces £300,000 to £500,000 of annual avoided cost. The same £250,000 project on a plant with £500,000 of addressable annual utility spend would need a lower project cost, additional verified benefits or a larger reduction to achieve the same payback.
Sensitivity testing prevents weak CAPEX proposals
Finance teams should test the proposal before approving it. At minimum, the model should consider a conservative saving case, a central case and a delayed-benefit case. The delayed-benefit case matters because the 8 to 16 week Omni Vision deployment period is only the first part of the programme. The plant must then establish baselines, review deviations and implement operational changes.
A sensible approval paper should identify:
- Utility streams and production areas included in scope.
- Current annual energy cost and the tariff basis used.
- Savings measures already identified, with owners and expected timing.
- Capital cost, installation cost and recurring software or support costs.
- The method used to validate savings against production changes.
- Constraints imposed by product quality, safety, maintenance windows and GMP requirements.
- The trigger point at which the business case is reforecast.
Automated analysis helps sustain measurement after the initial project team has moved on. Savings that are not monitored can disappear as operating conditions change.

Track energy consumption, emissions, and process parameters with seamless PLC/SCADA integration via Modbus, OPC-UA, and MQTT protocols.
ISO 50001:2018 turns monitoring into an energy-management discipline
ISO 50001:2018, amended by ISO 50001:2018/Amd 1:2024, provides a recognised framework for establishing, maintaining and improving an energy management system. It requires organisations to use energy data to understand performance, set objectives, measure results and pursue continual improvement.
For a chemical plant, the value lies in creating a repeatable management routine. Metering alone does not meet that purpose. A site needs defined energy performance indicators, a baseline methodology, management review and evidence that corrective action has taken place.
Omni Vision can support this structure by providing centralised utility records, production-linked KPIs and an audit trail of investigated anomalies. It does not confer ISO 50001 certification. Certification remains a management-system assessment undertaken by an independent certification body.
ISO has reported historic case-study results ranging from 5% to 30% of energy-cost savings during the standard’s first five years of use. Those outcomes span sectors and circumstances, so they should not be transferred directly into a chemical plant forecast. Substantial improvement requires management attention, measurement and capital or operational action.
Energy per batch and cost per tonne are stronger board metrics
Plant-wide consumption becomes difficult to interpret when output changes. Energy per batch and cost per tonne give the board a clearer picture, provided the plant defines its boundaries consistently.
For example, a batch KPI should state whether it includes upstream utilities, clean-in-place activity, common services and allocated shared loads. Cost per tonne should identify which products, grades and production stages sit inside the calculation. Without these definitions, an apparent efficiency gain can be a change in accounting allocation.
Consistency also matters for savings verification. A lower steam cost in summer may reflect reduced heat loss or a different product mix rather than an improvement delivered by the project. Production-linked baselines make that distinction easier to examine.
ESOS Phase 4 and SECR increase the value of reliable data
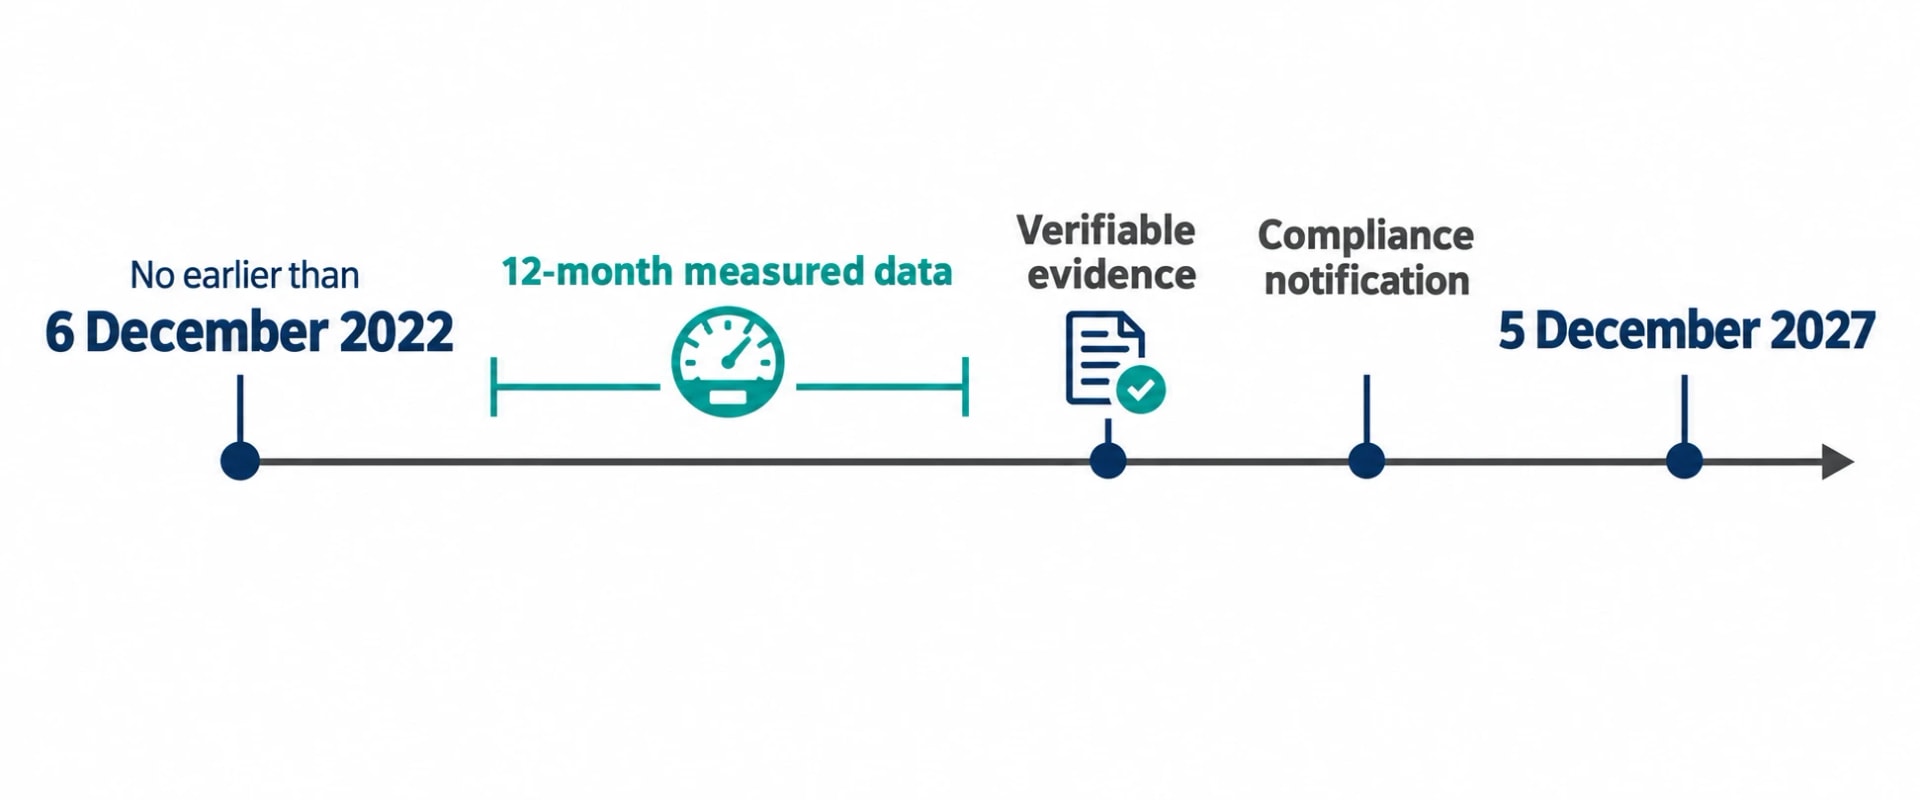
ESOS Phase 4 requires qualifying organisations to analyse energy consumption and efficiency, identify saving opportunities and support assessments with verifiable data. The compliance notification deadline is 5 December 2027. Audit evidence must, so far as reasonably practicable, be based on energy-consumption data measured over a 12-month period beginning no earlier than 6 December 2022.
A digital monitoring project should not be purchased solely to meet ESOS obligations. It can, however, turn mandatory analysis into a route for finding and tracking operational savings. ESOS action plans also increase the need for clear ownership, evidence and progress reporting.
For relevant companies and LLPs, Streamlined Energy and Carbon Reporting requires energy and carbon disclosures, including Scope 1 and Scope 2 information and energy-efficiency actions. Automated Scope 1 and Scope 2 CO₂e reporting can reduce the manual handling involved in management and statutory reporting, provided the organisation uses current conversion factors and retains an auditable methodology.
The Energy Technology List is a selection aid, not an automatic tax relief
The Energy Technology List remains useful when comparing energy-efficient equipment. It can inform wider improvement projects where monitoring identifies a poor-performing motor, drive, compressed-air asset or other utility equipment that needs replacement.
Finance teams should not assume that Energy Technology List status creates an Enhanced Capital Allowance. The UK ended the Energy Technology List enhanced first-year allowance scheme in April 2020. Capital-allowance treatment depends on the expenditure and current tax rules, so project teams should obtain tax advice before including relief in an ROI calculation.
A sound business case should stand on measured energy savings and operational benefits, with tax treatment considered separately.
How to make the Omni Vision ROI target credible
The strongest case starts with a defined pilot area: an energy-intensive distillation section, a reactor train, a compressed-air network or a cooling system with known variability. The plant should meter the chosen utility streams, map them to production and nominate the people who can make operational decisions.
After the first savings are verified, the site can extend monitoring to other significant energy uses. This sequence limits upfront scope while creating evidence for the next investment decision.
This article reflects the independent analysis and editorial opinion of EnerTherm Engineering. Product names, trademarks, and brands mentioned belong to their respective owners. EnerTherm Engineering is not affiliated with, endorsed by, or a licensee of any third-party software or product mentioned unless explicitly stated.

Technical Manager — EnerTherm Engineering
John Naranjo is Technical Manager at EnerTherm Engineering, bringing specialist expertise in chemical and environmental engineering. He recently led the implementation of Omni Vision, EnerTherm's real-time energy and utility monitoring platform. He holds an MSc in Environmental Engineering from the University of Huelva and a BSc in Chemical Engineering, with memberships in both the Energy Institute and IChemE.
