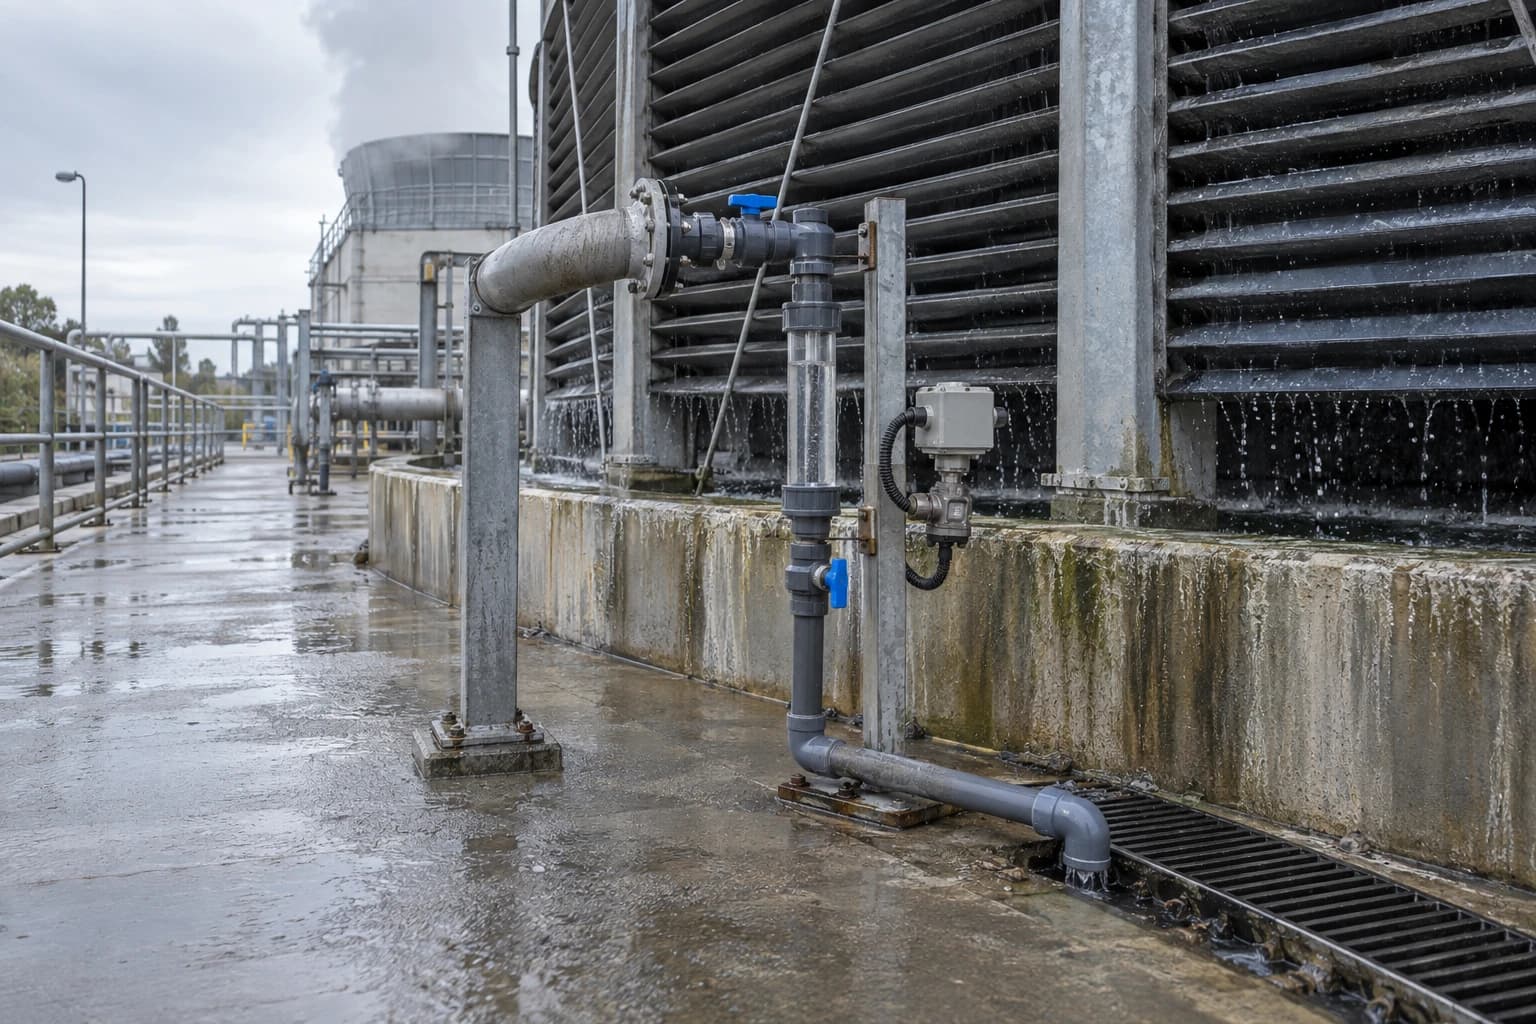
Why Cooling Tower Energy Monitoring Tracks Cycles
Tracking make-up, blowdown and conductivity can cut make-up water by up to 20%.
Cooling tower energy monitoring time-aligns fan and pump electricity, make-up water, blowdown flow, water conductivity and cooling performance to explain utility cost and process demand.
At a chemical site, a cooling tower may cool reactors, condensers, distillation columns or chillers while consuming electricity and discharging treated water. Fan and pump kWh can rise for valid operational reasons, including higher production throughput or ambient wet-bulb temperature. They can also rise because heat transfer has deteriorated, controls are poorly set or water chemistry has moved outside its intended operating range.
Cycles of concentration provide the missing context. They show how often incoming make-up water circulates before concentrated water leaves as blowdown. Tracking cycles alongside electricity use links water treatment and bleed control to heat rejection, fan staging and production output.
The US Department of Energy Federal Energy Management Program identifies cycles of concentration as a principal cooling-tower performance measure. Its guidance states that increasing cycles from three to six can reduce make-up demand by 20% and blowdown by 50%. The make-up reduction aligns with a simple steady water balance. Under the simplifying assumptions of fixed evaporation, negligible drift and no leakage or other losses, blowdown falls from half the evaporation rate at three cycles to one-fifth at six cycles: a 60% reduction. The 50% figure is therefore a published planning estimate, rather than the result of the simplified calculation.
What are cooling-tower cycles of concentration?
Concentration, evaporation and blowdown
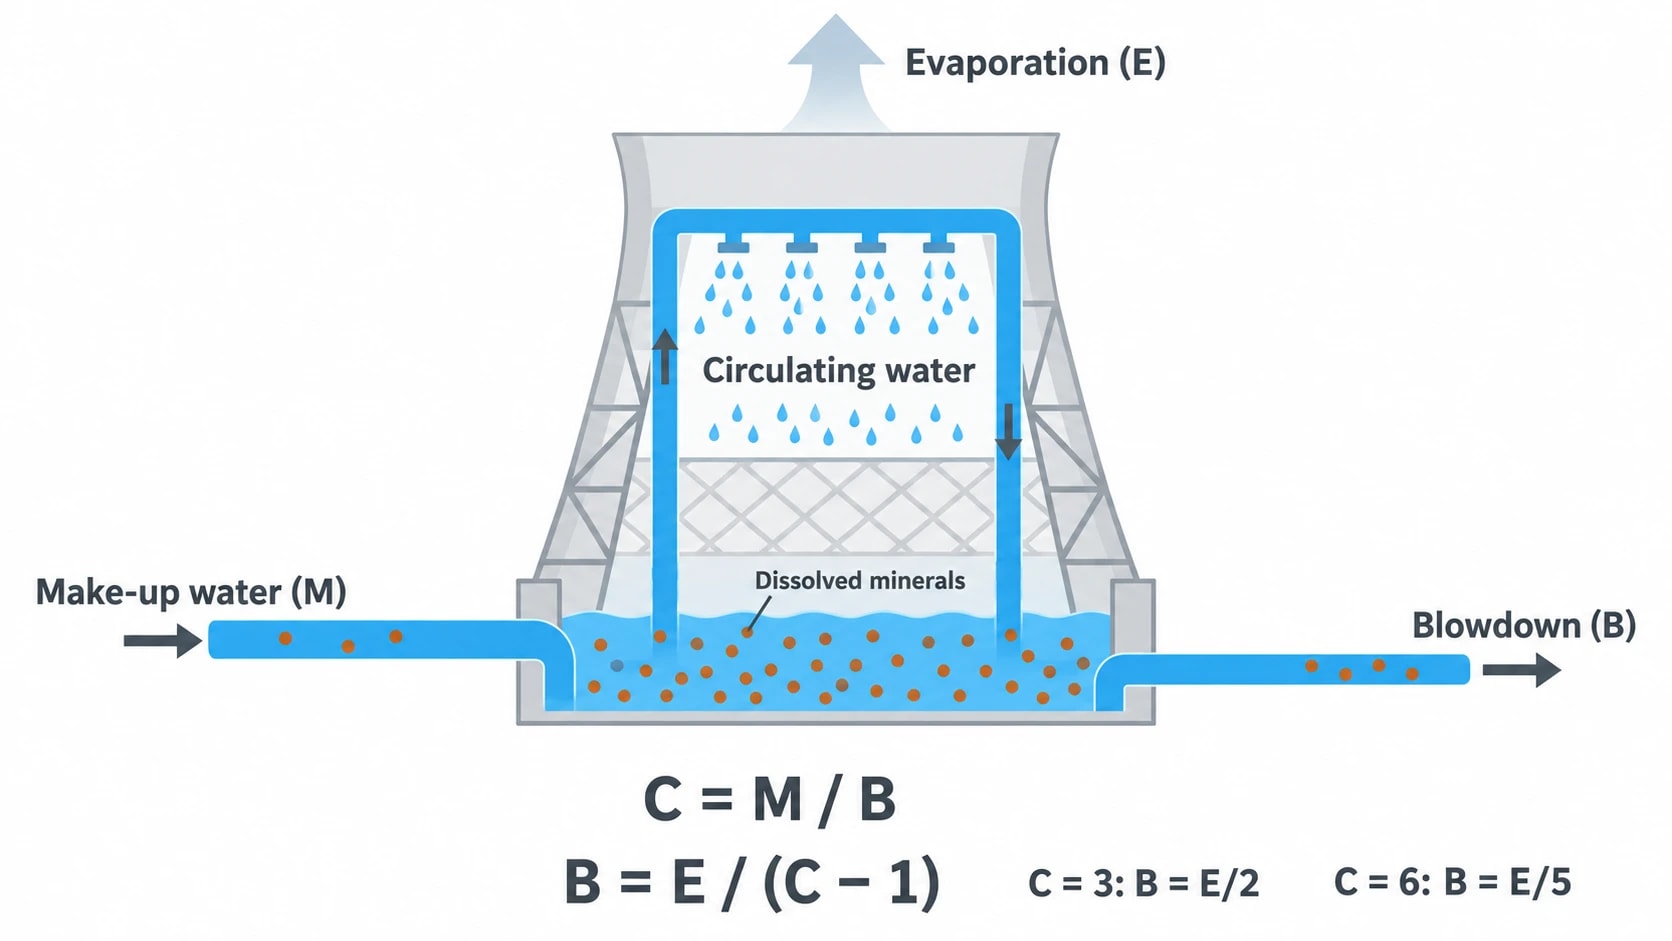
Evaporation rejects heat from the recirculating cooling-water system. Most dissolved minerals remain as water evaporates, increasing the concentration of dissolved solids in the circulating water.
Operators control concentration by discharging a proportion of the circulating water as blowdown, also called bleed-off, and replacing it with make-up water. The concentration ratio is normally assessed by comparing dissolved solids or conductivity in circulating or blowdown water with make-up water.
A higher cycle value means water remains in the cooling tower for longer before blowdown. This reduces water supply and effluent demand, provided the treatment programme controls scale, corrosion, suspended solids and microbiological growth.
When the flow ratio is valid
Under steady conditions with negligible drift, basin overflow, leakage and other water losses, the make-up-to-blowdown flow ratio provides a useful approximation of cycles of concentration:
C=BMHere, C is cycles of concentration, M is make-up water flow and B is blowdown water flow.
This is not a universal calculation. Drift, uncontrolled draw-off, leaking valves, overflow and meter error can make the flow ratio depart from the chemical concentration ratio. A utility engineer should compare both methods and investigate a material difference.
The same simplified balance gives:
B=C−1EHere, B is blowdown flow, E is evaporation flow and C is cycles of concentration. The equation shows why increasing cycles from three to six reduces blowdown from E/2 to E/5, assuming constant evaporation and negligible other losses.

Omni Vision delivers turnkey utility metering, CO2 tracking, and AI-powered production KPI intelligence — giving you real-time dashboards and actionable insights across your entire facility.
Why cooling tower energy monitoring needs water data
Electricity meters alone cannot diagnose performance
A meter at the cooling-tower distribution board records consumption. It does not identify whether fan operation reflects production load, weather, poor heat transfer or a control fault.
Fan power can increase because:
- Production has raised the heat rejected by reactors, condensers or chillers.
- Ambient wet-bulb temperature has risen.
- More cooling-tower cells have started.
- A variable-speed drive has increased fan speed.
- Airflow has reduced because of fouled fill, poor water distribution or recirculation.
Pump power can increase because the process needs more cooling-water flow, strainers have blocked, valves are throttled or the pump is operating away from its efficient duty point.
Reliable monitoring therefore needs water, thermal and production signals alongside kWh.
The minimum operating dataset
The most useful points for cooling tower energy monitoring are:
| Measurement | Operational purpose |
|---|---|
| Fan and pump kW, kWh and run status | Shows electrical input and equipment staging |
| Fan speed or drive frequency | Explains the airflow control response |
| Make-up-water flow | Quantifies total replacement demand |
| Blowdown flow | Confirms bleed control and effluent volume |
| Make-up and recirculating-water conductivity | Indicates concentration and controller behaviour |
| Hot-water and cold-water temperature | Shows thermal load and delivered cooling condition |
| Ambient wet-bulb temperature | Sets the atmospheric limit for evaporative cooling |
| Process flow or condenser-water flow | Helps distinguish thermal demand from operating losses |
| Batch count, tonnes produced or throughput | Creates production-linked utility indicators |
These measurements need common timestamps. A daily conductivity entry cannot explain a fan-power increase during a four-hour batch or a short period of uncontrolled blowdown.
How cycles affect cooling-tower electricity use
Water treatment affects heat rejection
Scale and fouling add resistance to heat transfer in condensers, process heat exchangers, cooling-tower fill and distribution components. The plant may then need lower cooling-water temperatures, additional airflow, more circulating-water flow or longer operating time to meet the same process duty.
The electricity effect may appear in several places:
- Fan cells run for longer or at higher speed.
- Fan staging starts additional cells.
- Condenser-water pumps operate at higher flow.
- Chillers use more electricity because condenser-water temperatures rise.
- Batch duration increases, worsening kWh per batch and kWh per tonne.
Higher cycles do not automatically cause these outcomes. A well-managed water-treatment programme may support a higher concentration target safely. Risk arises when the cycle set point exceeds the chemistry limit for the specific make-up supply, treatment regime and cooling tower.
Conductivity is a control signal, not a water-saving target
Conductivity controllers can automate blowdown by opening a valve when measured concentration exceeds an agreed set point. The set point needs approval from the responsible water-treatment specialist and the site’s control scheme.
A generic target such as six cycles may be unsuitable. Incoming-water composition, pH, corrosion potential, scaling tendency, suspended solids, chemical treatment and microbiological control determine the safe operating limit.
Cooling tower energy monitoring should show the approved target, actual conductivity, calculated flow ratio and fan or pump intensity on the same time series. Engineers can then identify whether higher electricity use coincided with a deliberate chemistry change or an uncontrolled departure from the intended regime.
Which cooling-tower anomalies merit investigation?
Over-bleeding and unexplained water use
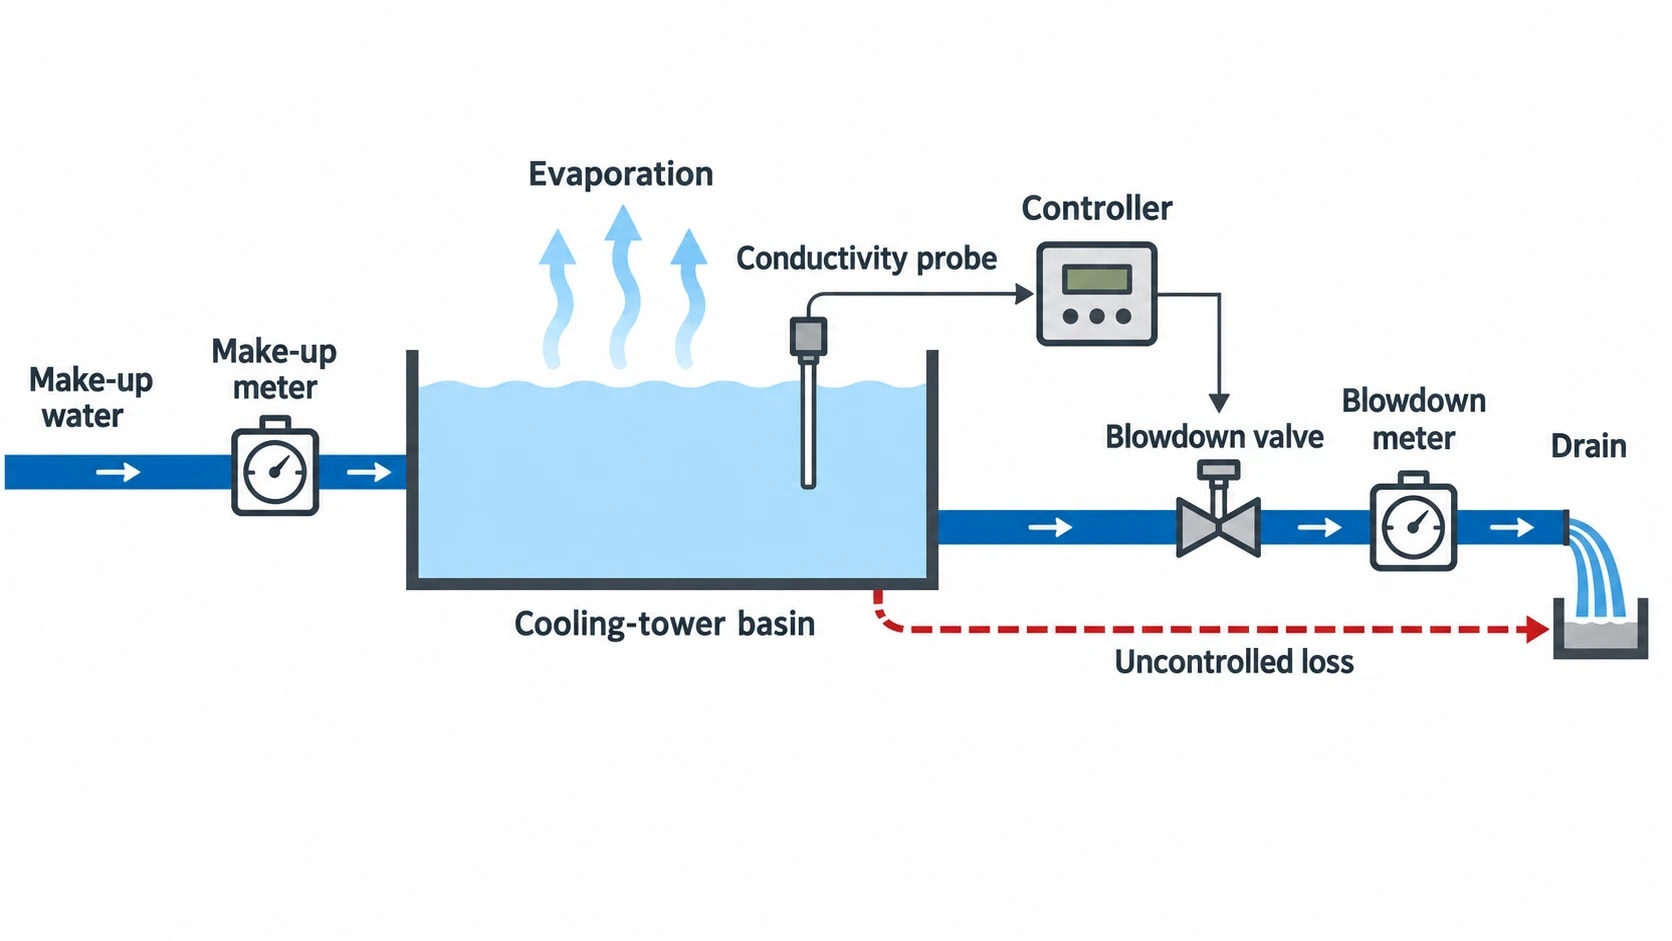
Make-up and blowdown meters expose losses that conductivity alone can miss. A cooling tower can report acceptable conductivity while a leaking valve or manual bypass sends treated water to drain.
The following patterns justify investigation:
-
Make-up flow rises while blowdown and production remain stable. Check basin overflow, leakage, level control, drift and meter performance.
-
Blowdown rises while conductivity remains below the approved set point. Test controller logic, valve seating, solenoid operation and manual bleed arrangements.
-
The flow ratio and conductivity ratio diverge. Check for uncontrolled losses, inaccurate flow meters, an unsuitable conductivity sample point or a faulty probe.
-
Conductivity exceeds target without a corresponding blowdown response. Inspect the probe, controller output, valve actuator and treatment chemical dosing.
Rising electricity intensity
Total cooling-tower kWh varies with production campaigns and weather. Intensity metrics reveal deterioration that total consumption can conceal.
Useful measures include:
- Fan and pump kWh per batch.
- Cooling-tower kWh per tonne of product.
- Make-up water in m³ per tonne.
- Blowdown in m³ per tonne.
- Fan kWh per operating hour at comparable wet-bulb conditions.
- Actual cycles against the approved chemistry target.
A gradual rise in fan kWh per batch under similar throughput and wet-bulb conditions warrants inspection of fill, nozzles, fan blades, belts where fitted, gearboxes, water distribution and associated heat exchangers. A sudden rise in make-up water per tonne often points to over-bleeding, a leak or overflow before the site water bill reveals the problem.

Track energy consumption, emissions, and process parameters with seamless PLC/SCADA integration via Modbus, OPC-UA, and MQTT protocols.
How should engineers interpret fan power?
Fan kW needs a temperature and weather reference
Cooling-tower fan power is strongly influenced by speed. Variable-speed drives can reduce energy use at lower cooling demand, but low kW does not prove that the cooling tower is performing efficiently. It may be failing to achieve the required cold-water temperature.
Conversely, high fan power can be appropriate during high process load or adverse wet-bulb conditions. The useful question is whether the additional electrical input delivers the required cooling-water condition for the prevailing thermal duty.
Compare fan kW with cold-water temperature, hot-water temperature, wet-bulb temperature, process throughput and cycle condition.
Use approach temperature carefully
Approach temperature is the difference between cold-water temperature leaving the cooling tower and entering-air wet-bulb temperature. A worsening approach at comparable load and airflow can indicate reduced heat-transfer performance.
It should not be used in isolation. Wet-bulb measurement quality, water flow, cooling-tower configuration, fan staging and process thermal load all affect the result. A sudden approach change is a useful exception signal when supported by the rest of the monitoring dataset.
Compliance records and energy intelligence
HSG274 Part 1 requires disciplined record keeping
HSE’s HSG274 Part 1, second edition published in March 2024, addresses the control of Legionella bacteria in evaporative cooling systems. It expects dutyholders to manage precautionary measures and keep relevant records.
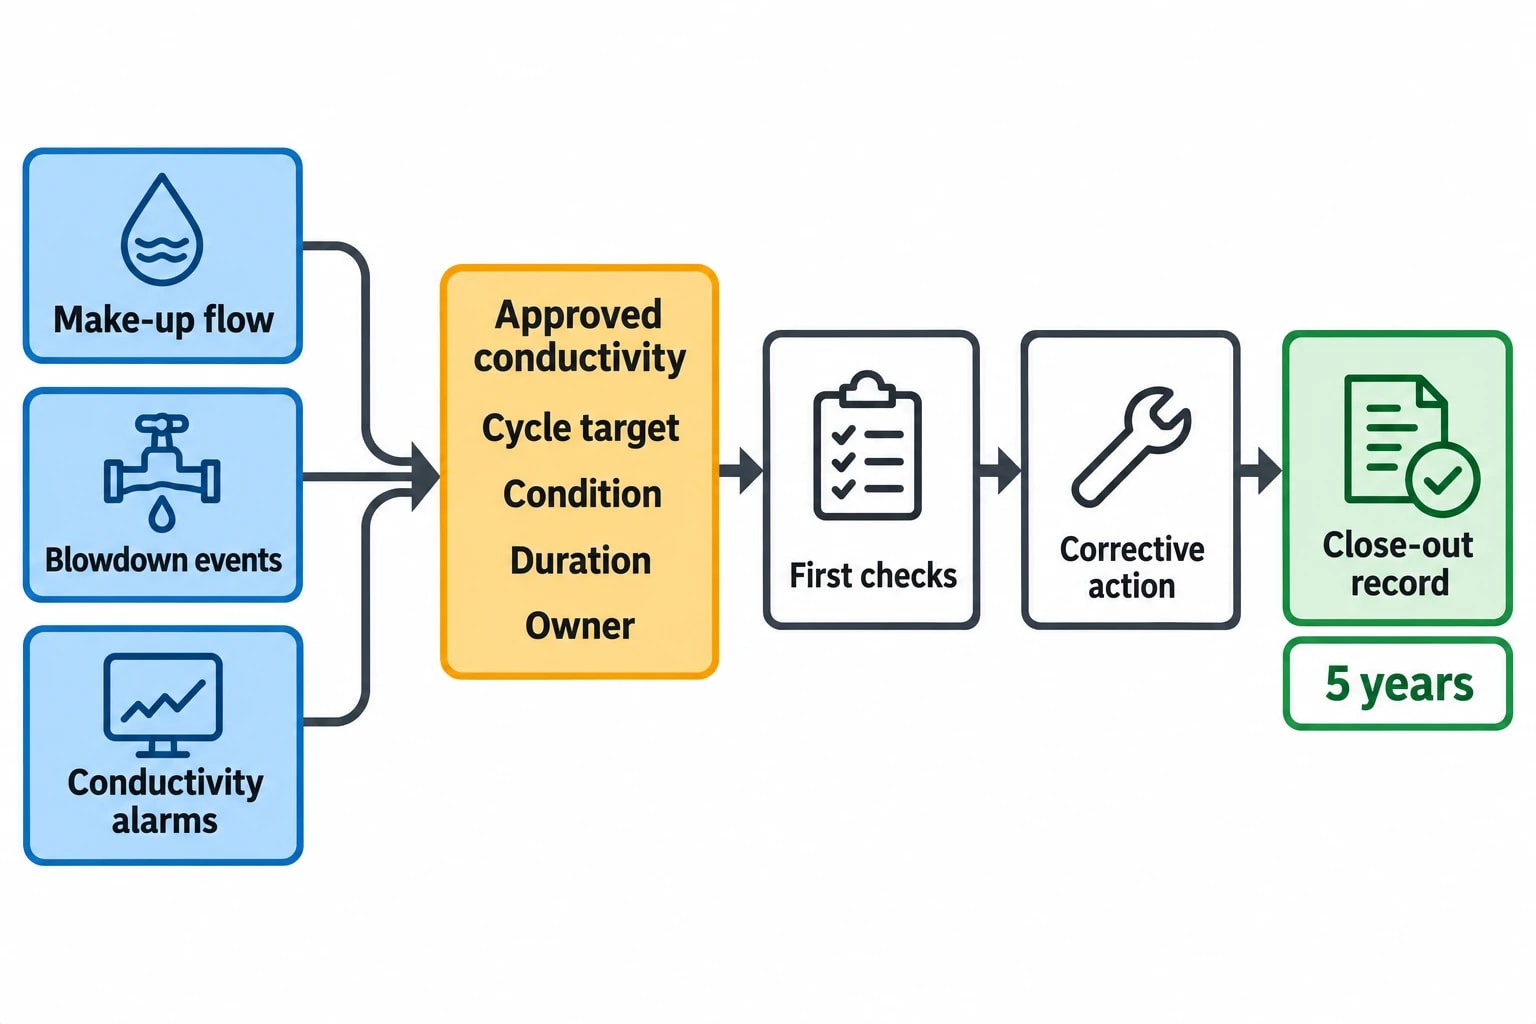
Monitoring and inspection records should be retained for at least five years. HSE permits electronic records where they accurately identify who carried out the work and when. Records include monitoring, inspection, tests, checks and resulting corrective action within the written control scheme.
Energy data does not replace risk assessment, water treatment, microbiological monitoring, cleaning, disinfection or competent maintenance. It can strengthen the operational record by providing time-stamped evidence of make-up flow, blowdown events, conductivity alarms and corrective work.
Build an auditable exception process
A useful alert assigns a condition, duration and owner. “High conductivity” is not a complete operational instruction.
An effective workflow defines:
- The approved conductivity and cycle target for each cooling tower.
- The persistence period before an alert becomes an exception.
- The production and weather conditions that justify higher fan power.
- The first checks required before maintenance escalation.
- The person responsible for water-treatment review.
- The corrective action and close-out record.
This keeps water efficiency aligned with cooling performance and compliance responsibilities.
How monitoring supports fan replacement decisions
Establish the existing duty before specifying equipment
Commission Regulation (EU) 2024/1834 applies from 24 July 2026 to fans driven by motors with electrical input power between 125 W and 500 kW. It sets ecodesign requirements for relevant fans placed on the EU market.
For cooling-tower monitoring, the regulation matters when a fan is replaced or the fan system is substantially modified. Engineers should establish the existing duty before comparing options. Historic data should show fan run hours, speed distribution, electrical demand, wet-bulb conditions, delivered cold-water temperature and process load.
That evidence identifies whether a replacement case stems from fan efficiency, incorrect duty selection, deteriorated cooling-tower condition or a control issue. A compliant replacement fan is only one part of site performance. Airflow requirement, cooling-tower condition, motor, drive, operating sequence and process demand determine measured kWh.
Turning cycles into an operating KPI
Set a baseline that reflects process reality
ISO 50001:2018 provides a framework for energy management, including energy performance indicators and energy baselines. A cooling-tower baseline should account for the variables that materially affect consumption.
A meaningful baseline may combine:
- Fan and pump kWh.
- Production output or batch count.
- Ambient wet-bulb temperature.
- Cold-water temperature requirement.
- Approved cycle target.
- Tower cell availability and control configuration.
Comparing monthly kWh without these conditions can create false savings or false alarms. Production-adjusted, weather-aware measures provide a clearer assessment of whether utility changes have improved operation.
Keep water and energy decisions together
The operating KPI should pair the approved cycle target with cooling-water condition, fan and pump intensity, make-up flow and blowdown. It identifies departures that require review by chemical manufacturing teams during validated change windows.
This article reflects the independent analysis and editorial opinion of EnerTherm Engineering. Product names, trademarks, and brands mentioned belong to their respective owners. EnerTherm Engineering is not affiliated with, endorsed by, or a licensee of any third-party software or product mentioned unless explicitly stated.

Technical Manager — EnerTherm Engineering
John Naranjo is Technical Manager at EnerTherm Engineering, bringing specialist expertise in chemical and environmental engineering. He recently led the implementation of Omni Vision, EnerTherm's real-time energy and utility monitoring platform. He holds an MSc in Environmental Engineering from the University of Huelva and a BSc in Chemical Engineering, with memberships in both the Energy Institute and IChemE.
