How AI Finds Steam Trap Failures in Chemical Plants
How ISO 50006 baselines separate production variation from hidden utility losses
AI-driven energy anomaly detection in manufacturing compares measured utility use with the consumption expected for a defined operating condition. It highlights deviations that may signal equipment faults, such as a steam trap passing live steam.
A Carbon Trust refinery survey found 314 steam traps, representing 8% of those inspected, were failing to open or passing steam. Replacing them cut energy losses and saved £69,000 per year. Chemical plants face the same challenge at greater operational complexity: a rising steam bill may originate in a trap, heat exchanger, pressure-reduction station, tracing circuit or genuine change in process duty.
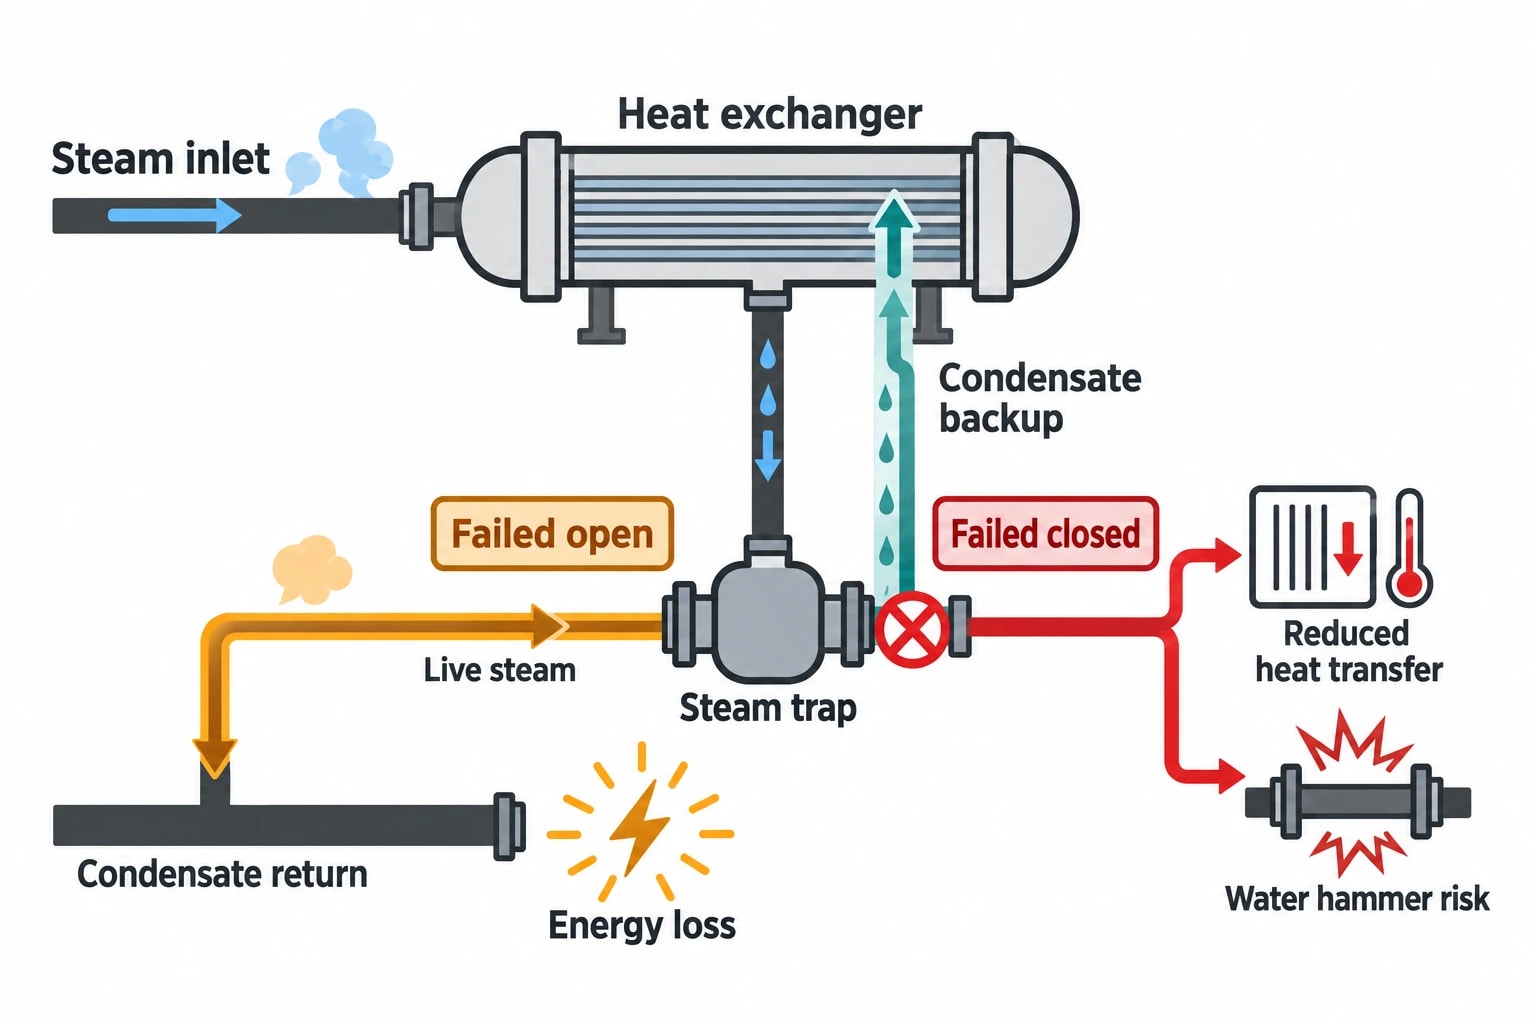
Steam traps sit between the steam distribution network and the condensate system. They discharge condensate and non-condensable gases while retaining steam for useful process heating. A failed-open trap can discharge live steam into the condensate system. A failed-closed trap can hold condensate in a line or heat exchanger, impairing heat transfer and creating conditions associated with condensate-induced water hammer.
AI does not replace a steam-trap survey, isolation procedure or engineering judgement. It helps process and maintenance teams identify credible candidates between physical inspections, with production context attached.
Why steam trap failures hide in chemical plant data
Batch operations create legitimate utility variation
Chemical manufacturing rarely runs at a constant thermal load. Steam demand changes with feedstock, product grade, batch size, reaction phase, ambient conditions, cleaning activity, distillation duty and throughput.
A distillation column may require more reboiler steam after a feed-composition change. A reactor may draw more energy during heat-up than during a controlled hold. Cleaning and sterilisation programmes can create short, intense utility demand that bears little resemblance to production.
A fixed high-flow alarm cannot reliably distinguish these events. It flags normal process activity alongside losses, leaving engineers with a long list of unhelpful alerts.
AI-driven energy anomaly detection asks a more specific question: given the current recipe, batch phase, throughput and operating state, how much steam should this process area consume?
Trap faults have different process signatures
A failed-open trap usually produces an energy signature. Steam flow or boiler fuel demand remains higher than expected after production conditions return to their usual range. Where local monitoring is available, continuous acoustic activity and an unusually warm downstream condition can strengthen the case for blow-through.
A failed-closed trap presents differently. Condensate can back up into a heat exchanger or steam line. A heat exchanger may then lose thermal capacity, require a higher control-valve position, take longer to reach temperature or show unstable temperature control.
The US Department of Energy’s Steam System Survey Guide describes failed-open and failed-closed conditions as the principal failure modes. It also advises combining inspection methods because no single method gives a complete diagnosis.
For UK chemical sites, the safety dimension matters as much as energy use. The Pressure Systems Safety Regulations 2000 require users to manage pressure-system risks, while HSE guidance on steam systems highlights the risk of condensate-induced water hammer.

Omni Vision delivers turnkey utility metering, CO2 tracking, and AI-powered production KPI intelligence — giving you real-time dashboards and actionable insights across your entire facility.
Establishing an energy baseline for AI anomaly detection
ISO 50006:2023 provides the measurement discipline
ISO 50006:2023 provides guidance for establishing, using and maintaining energy performance indicators and energy baselines. It is relevant to AI-driven energy anomaly detection because a model needs an evidence-based definition of normal before it can identify deterioration.
An energy baseline is not a single historic average. A chemical plant should identify the variables that materially affect steam use, then retain the data and method used to create its reference point.
For a steam-consuming process area, relevant variables may include:
- Product grade or recipe
- Batch stage and duration
- Tonnes produced
- Steam-header pressure
- Reactor, dryer or distillation-column operating state
- Ambient temperature where tracing or distribution losses are relevant
- Cleaning, sterilisation, shutdown and start-up periods
- Boiler configuration and steam-generation efficiency
The resulting energy performance indicator may be steam per batch, steam per tonne, boiler fuel per tonne of steam exported, or expected steam flow for a defined operating state.
Baselines must reflect process changes
An AI model trained before a major process change can misclassify the new operating pattern as waste. Engineers should review the baseline after a permanent change such as a reactor retrofit, revised recipe, new operating window, heat-integration project or control-strategy change.
This review should be documented. ISO 50006:2023 treats relevant variables and the method used to establish a baseline as information retained to demonstrate energy performance improvement.
The model should also exclude poor-quality records from training. A period affected by a meter fault, incomplete batch record, plant upset or abnormal shutdown can distort the expected-consumption model.
Granular metering makes faults attributable
A site-level fuel meter can show that steam-generation costs have risen. It cannot locate a passing trap on a tracing circuit or distinguish a distribution loss from increased reboiler duty.
The Industrial Energy Transformation Fund Phase 3 guidance required successful applicants to have digital meters capable of communicating consumption data remotely. It also required point-of-use metering where existing equipment could not support benefits monitoring. Although the fund is closed to new applications, its measurement principle remains useful: savings claims require an appropriate boundary, consistent metering and a defensible monitoring plan.
| Data layer | Typical measurements | Value for anomaly detection |
|---|---|---|
| Boiler house | Fuel, feedwater, steam export, blowdown, header pressure | Separates generation performance from downstream demand |
| Steam distribution | Header flow, pressure and temperature | Identifies abnormal demand by area or pressure level |
| Process area | Steam flow to reactors, columns, dryers and heating loops | Links steam use to a production asset |
| Trap or equipment level | Temperature, ultrasonic activity, condensate conditions | Supports maintenance diagnosis |
| Production context | Batch phase, recipe, output, run status and setpoints | Separates process demand from unexplained consumption |
How AI-driven energy anomaly detection finds a suspect trap
The model learns expected relationships
Traditional alarms use fixed limits. A steam flow above a pre-set value triggers an alert regardless of whether the plant has started a large batch or entered a cleaning cycle.
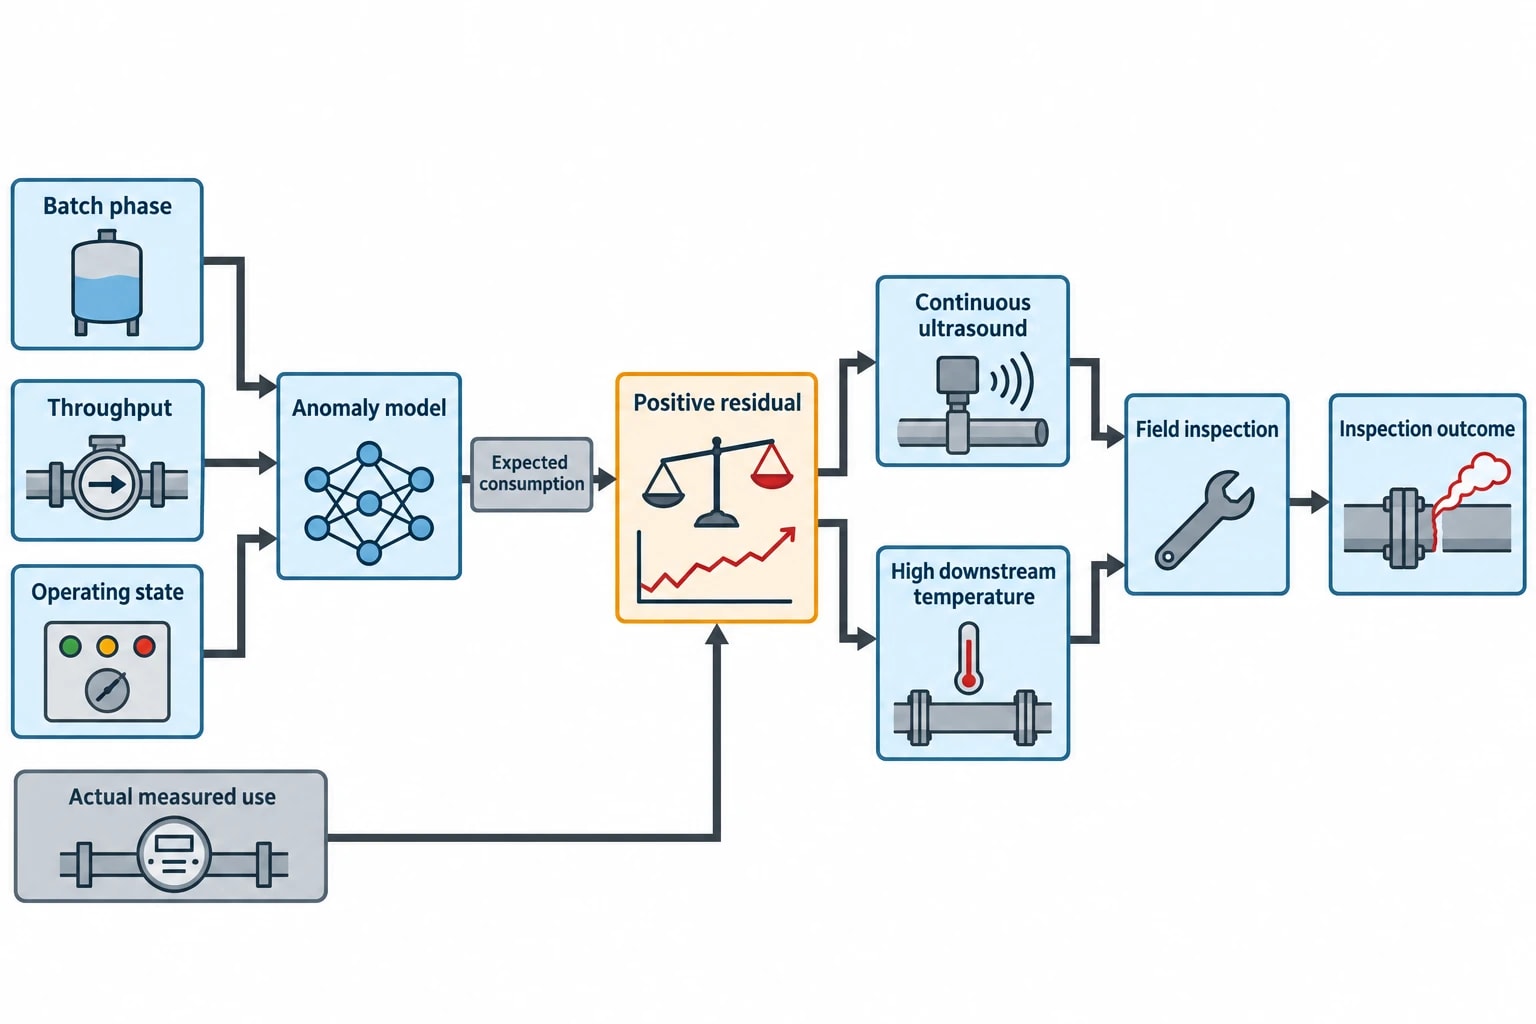
An anomaly model learns the relationships between steam consumption and operating variables. It estimates expected consumption for the observed conditions, then compares that estimate with actual measured use.
The difference is often called a residual. A persistent positive residual means the process is consuming more steam than its normal operating relationship predicts.
A useful model evaluates the size of the gap, duration, recurrence, confidence, location and production context. A short deviation during a documented clean-in-place cycle may need no action. A repeated increase in a reactor area during comparable batch phases deserves investigation.
Local sensor evidence improves diagnostic confidence
Utility data can identify excess energy at area level. Trap-level signals help maintenance teams narrow the search.
Common inputs include:
- Upstream and downstream temperatures
- Steam or condensate pressure where it is measured
- Ultrasonic acoustic activity
- Condensate-return temperature or flow
- Heat-transfer performance
- Steam-valve position and process-temperature response
Temperature alone can mislead. A healthy trap may run hot under certain duties, while a cold reading can result from a process condition rather than a blockage. Acoustic and thermal evidence together provide a more useful pattern.
An anomaly model may identify sustained excess steam use in a reactor area during a normal heating stage. The reactor reaches its setpoint as expected, yet the area’s steam residual remains elevated across several batches. A nearby trap monitor records unusually continuous ultrasonic activity and high downstream temperature. The combined evidence supports a field inspection for live-steam blow-through.
AI should rank evidence, not declare certainty
A model can identify a probable energy anomaly, but it cannot establish the physical condition of a trap without site validation. A work candidate should include the affected area, time period, estimated excess consumption, production context and contributing signals.
Maintenance engineers can inspect the trap using an appropriate survey method, site procedures and safe isolation arrangements. The inspection outcome should be recorded as a confirmed fault, normal operation, instrumentation issue or process change.
That feedback improves future model performance and stops a poor sensor reading from becoming an enduring false alert.
Distinguishing steam trap faults from process problems
Failed-open traps produce a waste pattern
A passing trap commonly produces a local steam imbalance. The process may remain stable because the boiler and pressure-control system compensate for the loss.
The model may identify:
- Excess steam consumption after adjustment for production output
- Higher boiler fuel use without corresponding throughput
- Persistent demand during low-load or idle periods
- Elevated condensate-return temperatures
- Continuous acoustic activity at a suspect trap
- High downstream temperature relative to normal trap behaviour
A technician still needs to verify whether the cause is a trap, leaking valve, pressure-reduction station problem or another distribution issue.
Failed-closed traps produce a heat-transfer pattern
A blocked trap often presents through the process rather than a large direct steam loss. Condensate can accumulate in a heat exchanger, jacket, coil or steam line. The heat exchanger may need a higher steam-valve position to achieve temperature, experience longer heat-up periods or show unstable control.
For this condition, the anomaly may appear as a change in the relationship between steam input and process response. The model may identify that a reactor is taking longer to reach its heating target, or that the steam valve is opening further for the same batch phase.
The investigation should consider exchanger fouling, control-valve behaviour, steam pressure, condensate back pressure and process changes alongside the trap itself.

Track energy consumption, emissions, and process parameters with seamless PLC/SCADA integration via Modbus, OPC-UA, and MQTT protocols.
Turning anomaly alerts into predictive maintenance work
Prioritise by energy and operational consequence
A large chemical facility may contain hundreds or thousands of steam traps. An alert for each unusual reading would create an unmanageable queue.
Maintenance planning benefits from a ranked list that considers:
- Estimated excess steam consumption
- Duration and recurrence of the deviation
- Confidence that the event sits outside expected operation
- Corroboration from thermal, acoustic or process data
- Process reliability and safety consequence
- Accessibility during the next maintenance opportunity
This approach directs survey effort towards faults with the strongest combination of cost, evidence and operational consequence.
Use planned shutdowns effectively
AI alerts can identify candidates before a shutdown window opens. Maintenance teams can then prepare the trap type, process duty, steam pressure, spares, access requirements and isolation plan.
Repeated failures in the same service require investigation beyond replacement. Common contributing factors include incorrect sizing, debris, inadequate drainage, excessive back pressure, damaged strainers and unsuitable trap selection.
HSE guidance on condensate-induced water hammer reinforces the need for effective steam-system maintenance. Energy monitoring can support that work, but it does not alter the need for site-specific risk assessment, competent personnel and controlled work on pressurised systems.
Measuring savings after a steam trap repair
Record the pre-repair condition
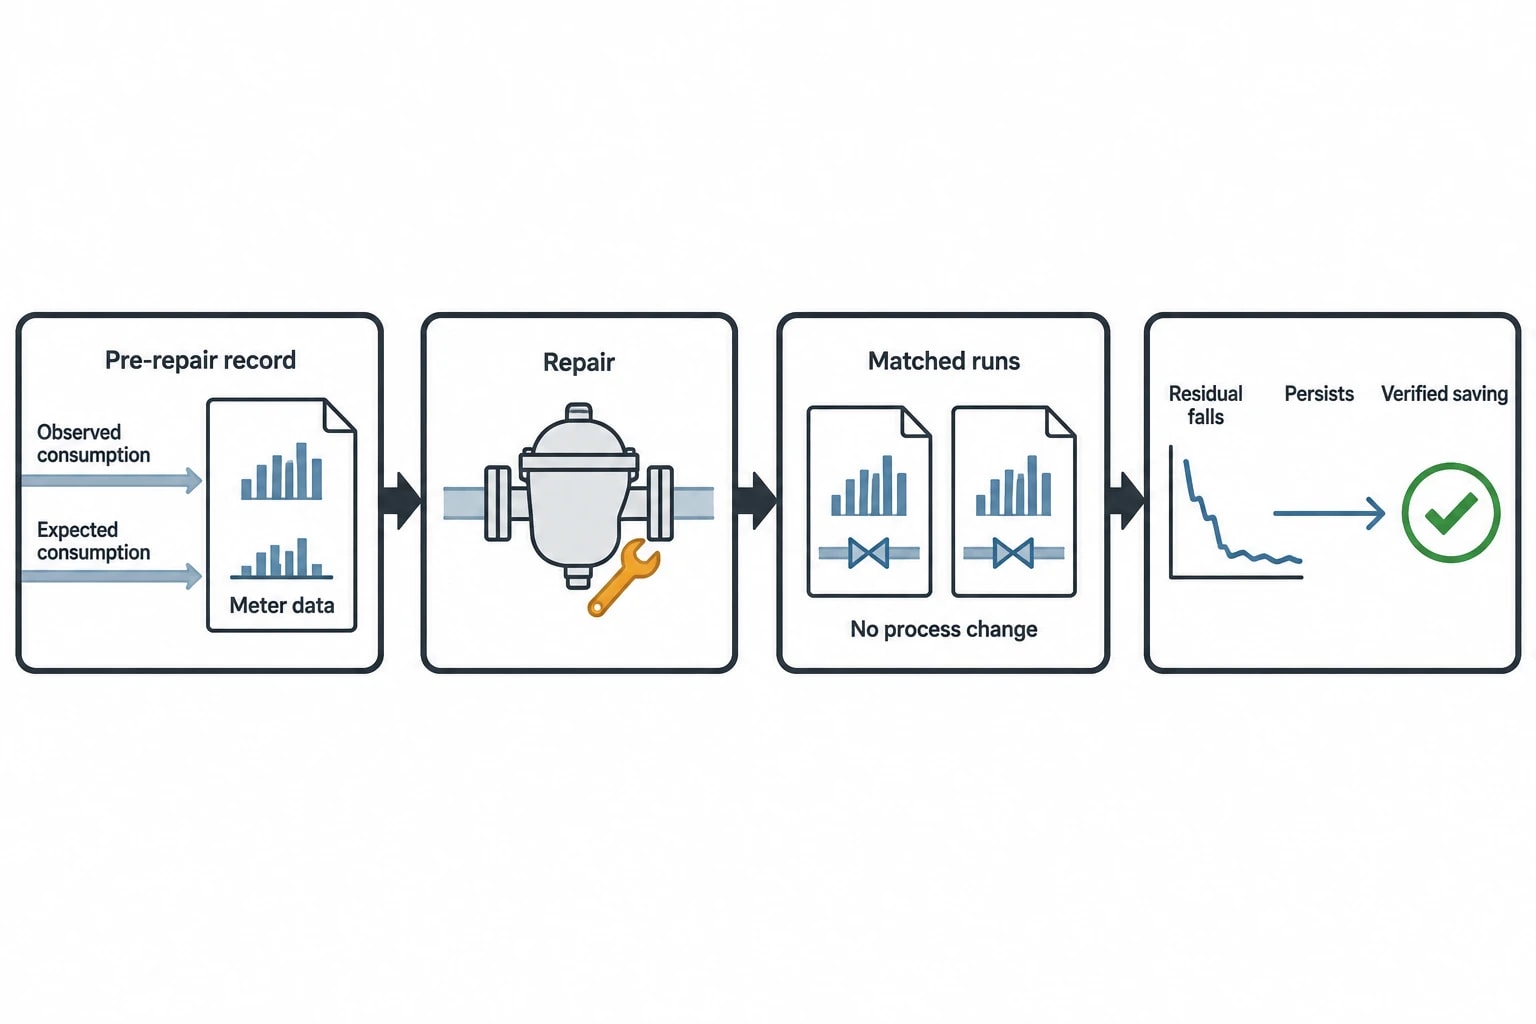
Before intervention, the plant should preserve the anomaly record: timestamps, process state, observed steam consumption, expected consumption, meter quality status and available field evidence. The record should identify the physical boundary being evaluated, such as a process area, steam branch or individual monitored trap.
This forms the basis for a credible before-and-after assessment.
Compare equivalent operating periods
After repair, compare post-repair operation with pre-repair periods that have equivalent production conditions. Match product, batch phase, throughput, steam-header pressure and operating status as closely as the dataset allows.
The assessment should confirm that:
- The residual falls after the repair
- The reduction persists across several comparable runs
- Production output and quality remain within normal expectations
- Meter data is complete and plausible
- No separate process change explains the reduction
If the steam residual remains elevated, the team should investigate other losses or process inefficiencies rather than recording a saving based solely on a completed work order.
Create an auditable improvement record
A verified result links a maintenance action to measured energy performance. The record can include the identified asset, fault evidence, repair date, post-repair observations, utility reduction and assumptions used in the comparison.
For energy managers, this connects predictive maintenance with utility-cost control and Scope 1 emissions reporting. For process engineers, it reveals whether an apparently minor drain issue is affecting heat transfer, process stability or condensate-system behaviour.
Applying Omni Vision to chemical steam systems
Map utilities to production performance
The Omni Vision Energy Intelligence Platform brings steam data together with electricity, gas, water, compressed air and oil consumption. In chemical applications, the useful unit of analysis is often the process area: a reactor train, distillation column, dryer, cooling tower or batch suite.
Production-linked KPIs make shifts in energy intensity visible. Relevant measures include steam per batch, steam per tonne of product, energy cost per tonne, boiler fuel per tonne of steam exported and excess steam use against expected demand.
These indicators help plant teams separate higher output from deteriorating energy performance. They also provide the operating context needed to investigate whether a change belongs to the boiler house, distribution system, control strategy or process duty.
Focus alerts on confirmed improvement
A sound deployment starts with a clearly defined utility boundary, meter review and agreed production variables. Teams can then establish relevant energy performance indicators, identify deviations and validate a manageable set of maintenance candidates.
A suspected steam trap becomes a verified fault through field inspection, and a repair becomes an evidenced change in consumption that informs the next maintenance decision.
This article reflects the independent analysis and editorial opinion of EnerTherm Engineering. Product names, trademarks, and brands mentioned belong to their respective owners. EnerTherm Engineering is not affiliated with, endorsed by, or a licensee of any third-party software or product mentioned unless explicitly stated.

Managing Director — EnerTherm Engineering
Dr. François Pierrel is Managing Director of EnerTherm Engineering with over two decades of expertise in thermal design, heat transfer, and industrial energy optimisation. He holds a PhD in Heat Transfer from Cranfield University and a Post-Doctorate from Heriot-Watt University.
