Why ISO 50006 Changes Energy Cost per Tonne
A method for normalising utility use, production volume and carbon cost per tonne.
Energy cost per tonne is the verified cost of utilities within a defined production boundary, divided by the saleable tonnes from that boundary and reporting period.
A chemical plant can produce a monthly figure quickly by dividing utility invoices by production output. That result often fails scrutiny. A boiler may serve several process areas. A reactor campaign may cross reporting dates. Steam may be costed twice through gas consumption and an internal steam rate. Lower throughput can increase cost per tonne even when equipment efficiency remains stable.
ISO 50006:2023 gives guidance on establishing, using and maintaining energy performance indicators, known as EnPIs, and energy baselines. It does not define energy cost per tonne or require a financial EnPI. Its value lies in the discipline it brings to data, boundaries, relevant variables and comparison methods.
For production managers, this creates a KPI that identifies the source of a change. For financial controllers, it creates a figure that can reconcile to utility costs without losing the operational context behind the number.
How to calculate energy cost per tonne
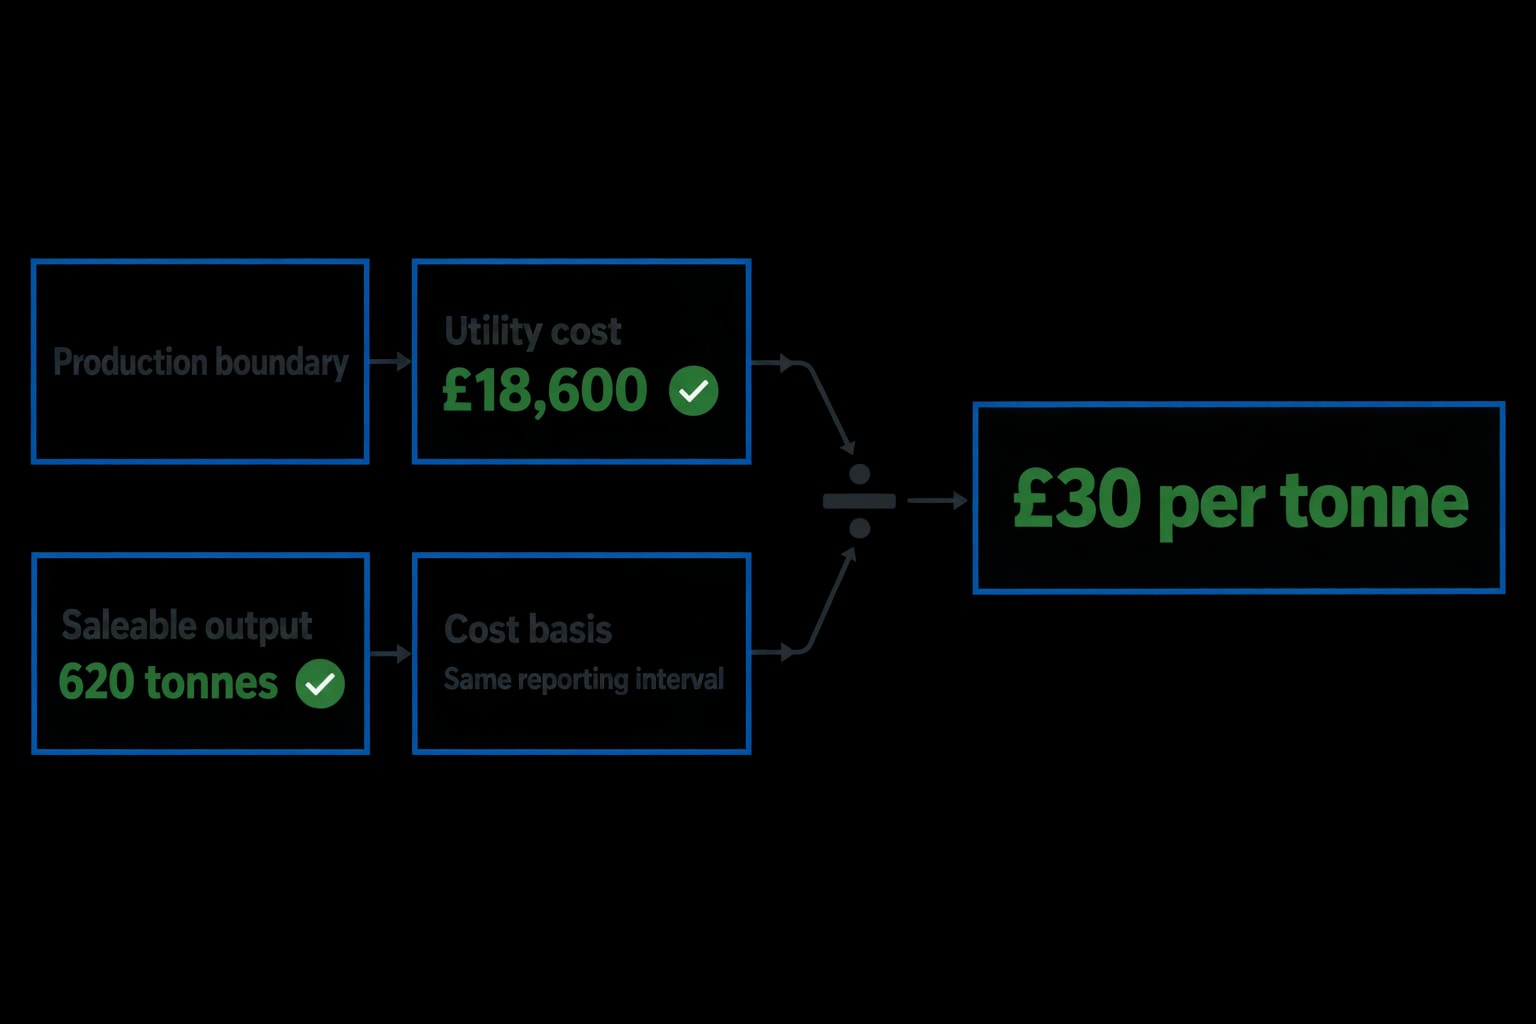
A valid energy-cost-per-tonne calculation aligns four elements:
- A defined production boundary.
- Metered or properly allocated utility consumption.
- A documented cost basis.
- Saleable output from the same period and boundary.
The calculation divides the agreed utility cost by the tonnes of released, saleable product. Both values must cover the same process assets and reporting interval.
A process area with £18,600 of verified electricity, gas and steam costs, and 620 tonnes of released product, records an energy cost of £30 per tonne for the period. The figure remains meaningful only if the site can identify the meters, tariff components, production records and allocation rules behind it.
Define the production boundary first
Chemical manufacturing rarely has a single obvious boundary. A site might calculate energy cost per tonne for:
- A reactor train
- A distillation column, reboiler and condenser
- A solvent-recovery unit
- A blending and packaging line
- A product family
- A complete production area
- The full manufacturing site
The chosen boundary determines which utility meters and output records belong in the KPI. A whole-site gas invoice does not describe the cost of a single product line if the same supply serves laboratories, warehouse heating, boiler houses and unrelated process units.
The output measure needs equal care. Saleable tonnes are usually the strongest denominator because they reflect material that has passed the agreed release or quality stage. The site should avoid switching between wet tonnes, intermediate transfers, theoretical yield and finished product. Each basis describes a different process reality.
A reactor train producing 620 tonnes of released material in a month has a 620-tonne denominator. Using 680 tonnes produced before rejects, rework or off-spec disposition would understate the energy cost allocated to saleable output.
Set one reporting period across utilities and production
Monthly financial reporting is common, yet batch chemistry creates timing problems. A batch can begin on the final day of one month and finish in the next. Its preheating load, reaction duty, cooling requirement and output may otherwise fall into separate reporting windows.
Continuous plants may allocate utilities and output hourly or by shift. Batch plants can allocate consumption to the batch execution window, with stated treatment for cleaning, preheating, idle time and post-batch cooling. The rule matters more than the selected interval. Teams need to apply it consistently and record exceptions.

Omni Vision delivers turnkey utility metering, CO2 tracking, and AI-powered production KPI intelligence — giving you real-time dashboards and actionable insights across your entire facility.
Build the utility cost numerator without double counting
The cost numerator should start with measured utility quantities, then apply the relevant utility prices. This lets production teams investigate consumption while finance teams retain the actual commercial cost.
Electricity and natural gas frequently dominate the energy bill. Process boundaries may also include purchased steam, thermal oil and compressed air where these utilities serve the defined assets.
| Utility stream | Typical chemical-industry use | Cost-control question |
|---|---|---|
| Electricity | Pumps, agitators, chillers, compressors and cooling towers | Does the meter serve only the selected process boundary? |
| Natural gas | Boilers, fired heaters and thermal oxidisers | Is the gas already represented in an internal steam charge? |
| Steam | Reboilers, tracing, stripping and process heating | Is its internal rate documented and periodically reviewed? |
| Compressed air | Pneumatic valves, instruments and conveying | Is electricity measured at the compressor station or allocated by air flow? |
| Thermal oil | High-temperature heating loops | Does the rate reflect fuel consumption and system losses? |
Choose either source fuel cost or an internal utility rate
Double counting is a persistent spreadsheet error. Boiler-house gas can be charged directly to a process area, or transferred through a documented steam rate. It should not enter the cost-per-tonne numerator through both routes.
The same control applies to compressed air. A process may receive an internal compressed-air cost based on measured flow or an agreed allocation method. The compressor-station electricity should then remain outside the process-level numerator unless the calculation assigns it directly.
An internal utility rate can be useful where central services support several plants. The rate should identify its basis, review date, included losses, operating costs and capacity charges. A rate with no stated methodology turns a process KPI into an accounting estimate that operators cannot investigate.
Include tariff components consistently
Electricity cost can include unit charges, time-of-use charges, demand charges, capacity charges, standing charges and supplier adjustments. Gas contracts can also contain fixed and variable components. A site should decide which elements form the operational KPI and maintain that treatment over time.
Variable consumption charges are useful for prompt operational control. A fully loaded cost per tonne may better support budgeting because it includes fixed charges and contracted capacity. Both views can coexist if the dashboard labels them clearly.
Mixing a consumption-only value in one month with a fully loaded utility cost in the next invalidates the trend. Finance teams should maintain a tariff and charge register alongside the meter data.
How ISO 50006 improves the energy cost per tonne KPI
ISO 50006:2023 gives organisations guidance on EnPIs and energy baselines, including their establishment, use and maintenance. Applied to a chemical plant, that guidance turns energy cost per tonne from a spreadsheet result into a governed performance measure.
The standard supports a repeatable method. It does not prescribe a universal cost-per-tonne formula because process boundaries, utility arrangements and products differ between organisations.
Specify the EnPI purpose
A chemical manufacturer can maintain several related indicators, provided each has a defined purpose.
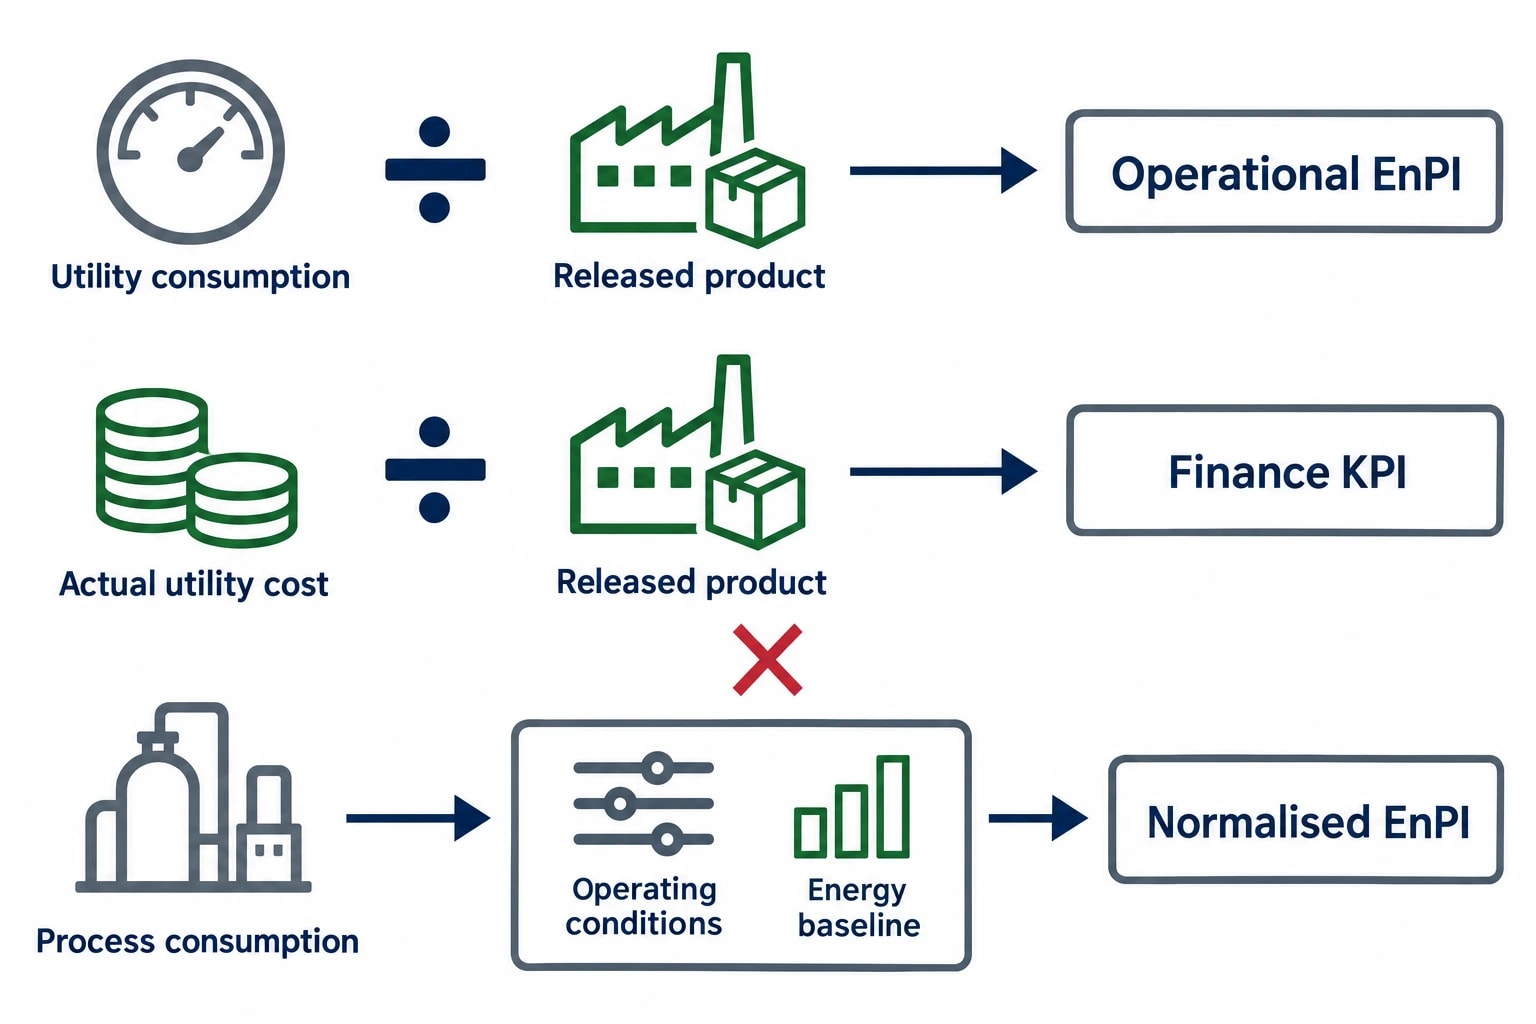
An operational EnPI may track utility consumption per tonne daily or by shift. A finance KPI may track actual utility cost per tonne monthly. A normalised energy-performance EnPI may compare process consumption against an energy baseline under stated operating conditions.
Each indicator answers a different management question. Actual cost per tonne reflects the commercial effect of tariffs, demand peaks and fuel prices. A normalised energy indicator tests whether the process required more or less energy after accounting for relevant operating conditions.
Production and finance teams should avoid combining actual invoice cost with normalised energy consumption in one unlabelled number. That hybrid measure cannot reconcile directly to invoices or demonstrate process performance clearly.
Create a controlled KPI specification
A cost-per-tonne KPI needs a short, accessible specification. It should record:
- Included assets, meters and utility streams
- Product, product family or production route
- Output definition, including release and rework treatment
- Reporting interval and time-zone convention
- Production, quality, meter and tariff data sources
- Cost components included in the numerator
- Allocation method for shared utilities
- Relevant variables used in performance comparisons
- Responsible owner and data-quality review process
This specification prevents silent changes. A new meter, altered recipe, revised product code or changed data extract can otherwise reshape the KPI while the chart still appears continuous.
Use an energy baseline as a reference, not a permanent target
An energy baseline, or EnB, provides a documented reference period for comparison. The plant should select a period with reliable meter and production data that represents the operating mode being assessed.
The baseline must remain relevant. A reactor-volume increase, a new distillation column, a permanent shift-pattern change or a major product-mix change can alter the relationship between energy use and output. These changes require review rather than blind comparison with historic figures.
A baseline is strongest when it captures the process conditions management expects to recur. A shutdown month, commissioning period or unusual campaign usually makes a poor baseline unless the KPI specifically assesses that operating state.

Track energy consumption, emissions, and process parameters with seamless PLC/SCADA integration via Modbus, OPC-UA, and MQTT protocols.
Why a simple energy-per-tonne ratio misleads chemical plants
A ratio can move sharply while equipment remains within expected operating performance. Chemical processes have fixed loads, variable heat duties and changing product requirements that a simple division cannot explain.
Throughput changes dilute fixed energy use
Some energy use continues during low production. Heat tracing, tank heating, control systems, chilled-water circulation, ventilation and idling compressors can remain active while output falls.
A low-volume month can therefore show a higher energy cost per tonne with no deterioration in the specific energy required by reaction, separation or drying. Managers should display production volume and capacity utilisation next to the KPI so that the trend has operational context.
This does not reduce the importance of the cost increase. It separates a throughput issue from an equipment-efficiency issue, which requires a different response.
Weather changes heating and cooling demand
Ambient conditions influence heat loss, cooling-tower fan power, chiller electricity use and condenser performance. Plants with steam heating or heat-traced pipework can see seasonal variation in boiler demand. Solvent-recovery and cooling systems can also respond strongly to ambient temperature.
January and July may both produce accurate actual energy-cost-per-tonne figures. They require normalisation before managers treat the difference as evidence of changed process performance.
Product mix can conceal high-energy campaigns
Product grades can differ in batch duration, agitation requirement, distillation reflux, reaction temperature, drying duty, solvent recovery and cleaning time. A site-level KPI may improve because a large quantity of lower-energy material dominates the reporting month, even while a high-energy product route deteriorates.
Separate EnPIs by product family, campaign or route often reveal the cause. The whole-site financial number remains useful, but it should sit alongside the process-level indicators that explain it.
How IPMVP normalisation supports fair comparison
The International Performance Measurement and Verification Protocol, or IPMVP, sets out measurement-and-verification principles for assessing energy performance under changing conditions. Its treatment of measurement boundaries, independent variables, routine adjustments and non-routine adjustments is useful for chemical plants building comparable energy-per-tonne measures.
Normalisation does not replace actual cost reporting. It creates a second view that holds selected operating conditions constant.
Identify relevant variables with historical evidence
A relevant variable changes routinely and has a material relationship with energy use inside the defined boundary. Depending on the process, potential variables include:
- Saleable production volume
- Product grade or recipe
- Batch count
- Ambient temperature
- Heating or cooling degree days where appropriate
- Feedstock temperature
- Operating hours
- Solvent-recovery load
- Required steam pressure or process temperature
Teams should test relationships with historical data and process knowledge. Adding every available plant tag creates a model that is difficult to govern and explain. The selected variable must have a credible physical connection to energy consumption and sufficient data quality.
Apply routine adjustments for expected variation
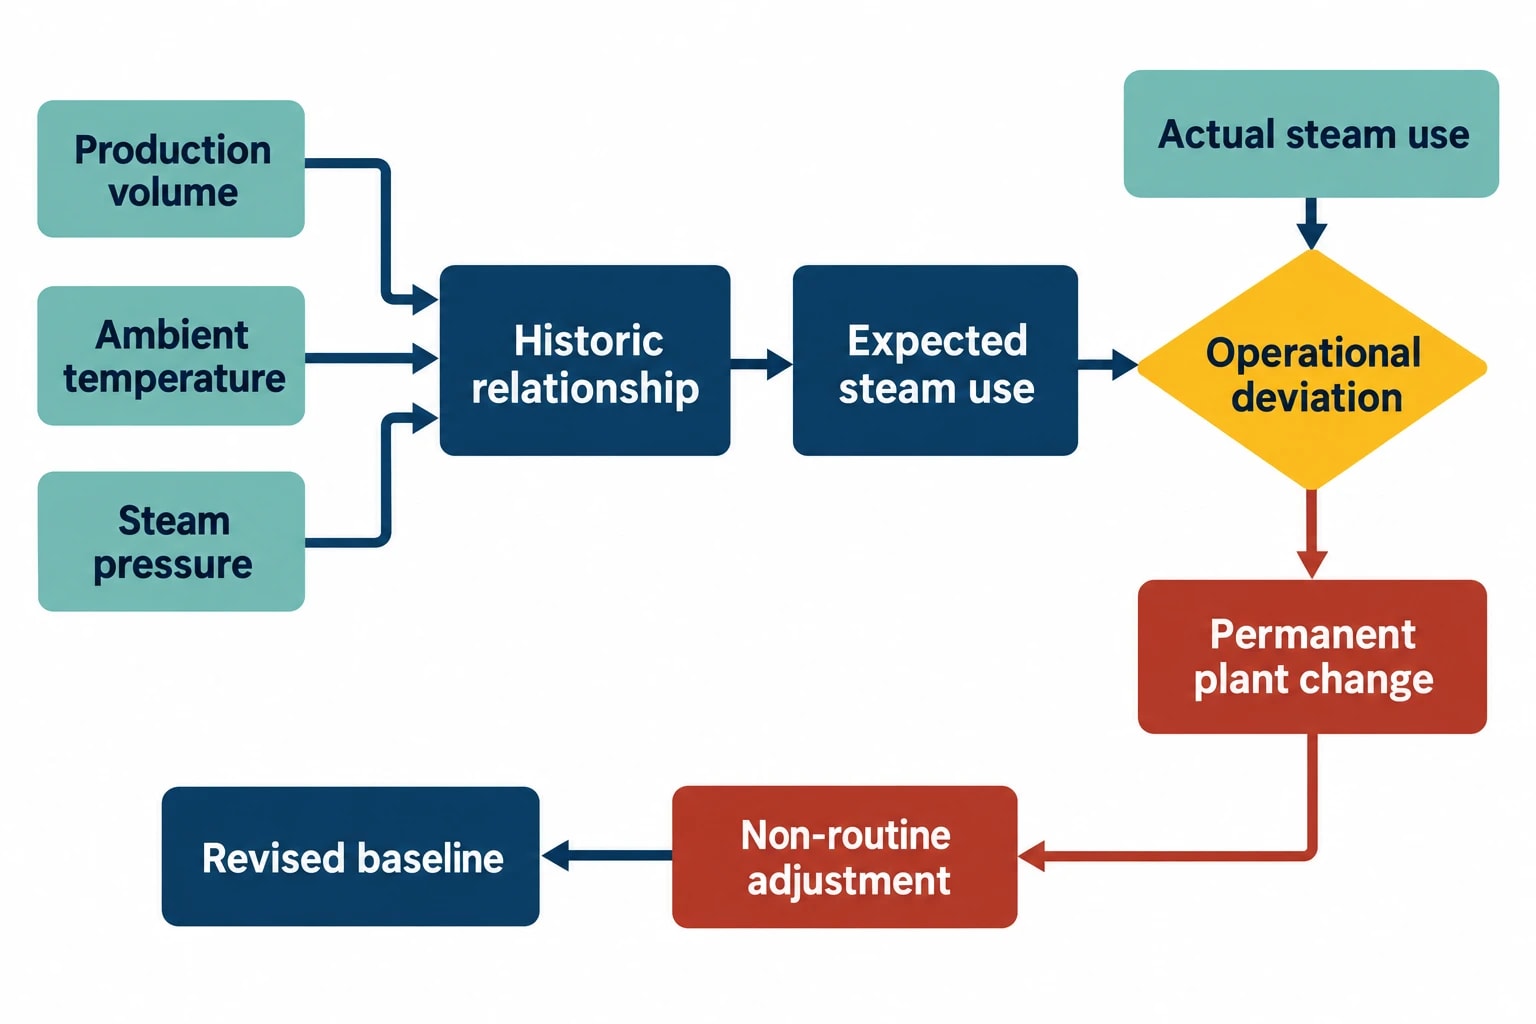
IPMVP describes routine adjustments as mathematical and statistical adjustments for expected changes in independent variables that affect energy use within the measurement boundary.
For example, a plant may establish the historic relationship between steam consumption, production volume and ambient temperature. It can then compare actual steam use with the expected amount for that month’s production and weather conditions. This helps distinguish an operational deviation from routine variation.
A normalised model needs a defined reference condition. The plant may hold throughput, product mix and ambient temperature at the baseline condition, or use another stated set of conditions. Reports should state the chosen basis.
Escalate permanent process changes as non-routine events
IPMVP treats changes to static factors differently from routine variation. A new reactor, changed column internals, altered operating sequence, extended shutdown or significant recipe reformulation can change energy use within the measurement boundary.
These events may require a non-routine adjustment or a revised baseline. The plant should record the event, assess its expected effect and preserve the calculation rationale. Treating a permanent modification as ordinary monthly noise can make a baseline misleading for years.
Establish a reliable data chain from meter to KPI
Manual spreadsheets usually fail through disconnected inputs rather than faulty division. Meter readings, invoices, production records, quality data and tariff files arrive on different schedules, use different timestamps and may change without a visible audit trail.
A reliable data chain connects each cost-per-tonne value to its source data and calculation rule.
Reconcile meter data with billed consumption
Submeters provide process detail, while fiscal meters and invoices provide financial reconciliation. The sum of process-level meters may differ from the site boundary meter because of losses, unmetered loads, data gaps or inconsistent intervals.
Teams should investigate material variance and document the allocation method for the remainder. A reconciliation check identifies failed meters, incorrect scaling, duplicated data and unexpected base loads before they enter a management report.
Match data frequency to the decision
Monthly cost-per-tonne reporting supports finance control and invoice reconciliation. Shift, daily or batch reporting helps production teams identify abnormal steam, electricity or compressed-air demand while there is time to investigate.
The same boundary and data definitions should apply across these views. Daily information can be provisional, with validated monthly figures following after invoice and production-close processes are complete.
Review exceptions before publishing performance
A concise exception review should examine missing meter intervals, abnormal production records, planned shutdowns, product-code changes, tariff updates and new assets. The KPI owner should approve any data substitution or manual adjustment.
This provides a practical bridge between operations and finance. Operators receive a timely signal of changing process demand. Financial controllers receive a number with traceable assumptions and stable definitions.
This article reflects the independent analysis and editorial opinion of EnerTherm Engineering. Product names, trademarks, and brands mentioned belong to their respective owners. EnerTherm Engineering is not affiliated with, endorsed by, or a licensee of any third-party software or product mentioned unless explicitly stated.

Technical Manager — EnerTherm Engineering
John Naranjo is Technical Manager at EnerTherm Engineering, bringing specialist expertise in chemical and environmental engineering. He recently led the implementation of Omni Vision, EnerTherm's real-time energy and utility monitoring platform. He holds an MSc in Environmental Engineering from the University of Huelva and a BSc in Chemical Engineering, with memberships in both the Energy Institute and IChemE.
