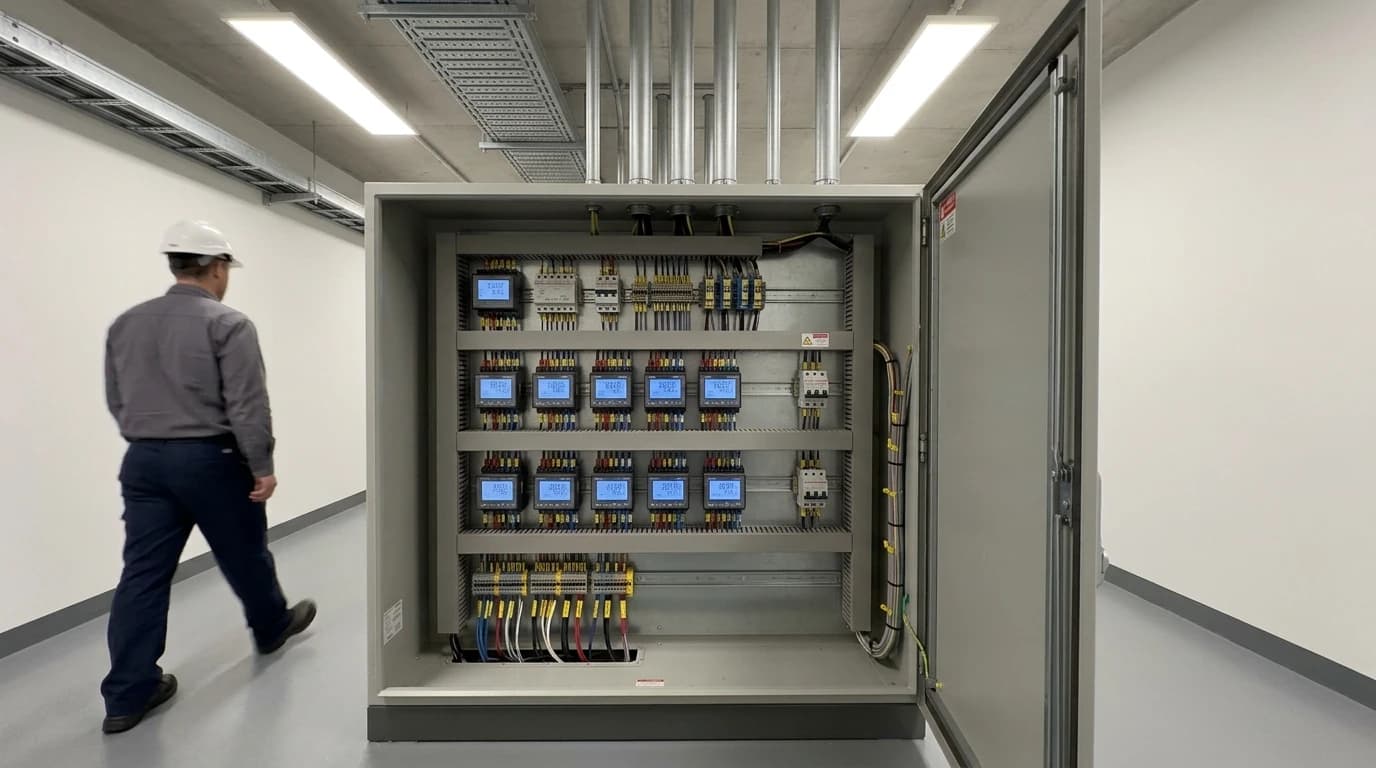
Automating Scope 1 and 2 Factory Carbon Reporting
Replacing manual spreadsheets with audit-ready data for SECR and EU ETS compliance.
The qualification date for Phase 4 of the UK's Energy Savings Opportunity Scheme (ESOS) is less than six months away, forcing large-scale manufacturing facilities to overhaul how they measure, track and report greenhouse gas (GHG) emissions. Industrial operations can no longer rely on retrospective, manual calculations to satisfy audit requirements. Regulatory frameworks now demand granular, verifiable and continuous data streams. Transitioning to automated carbon footprint reporting represents a necessary step for operations directors and Environmental, Health and Safety (EHS) managers who must secure compliance while protecting production efficiency.
The Industrial Compliance Milestones Approaching in 2026
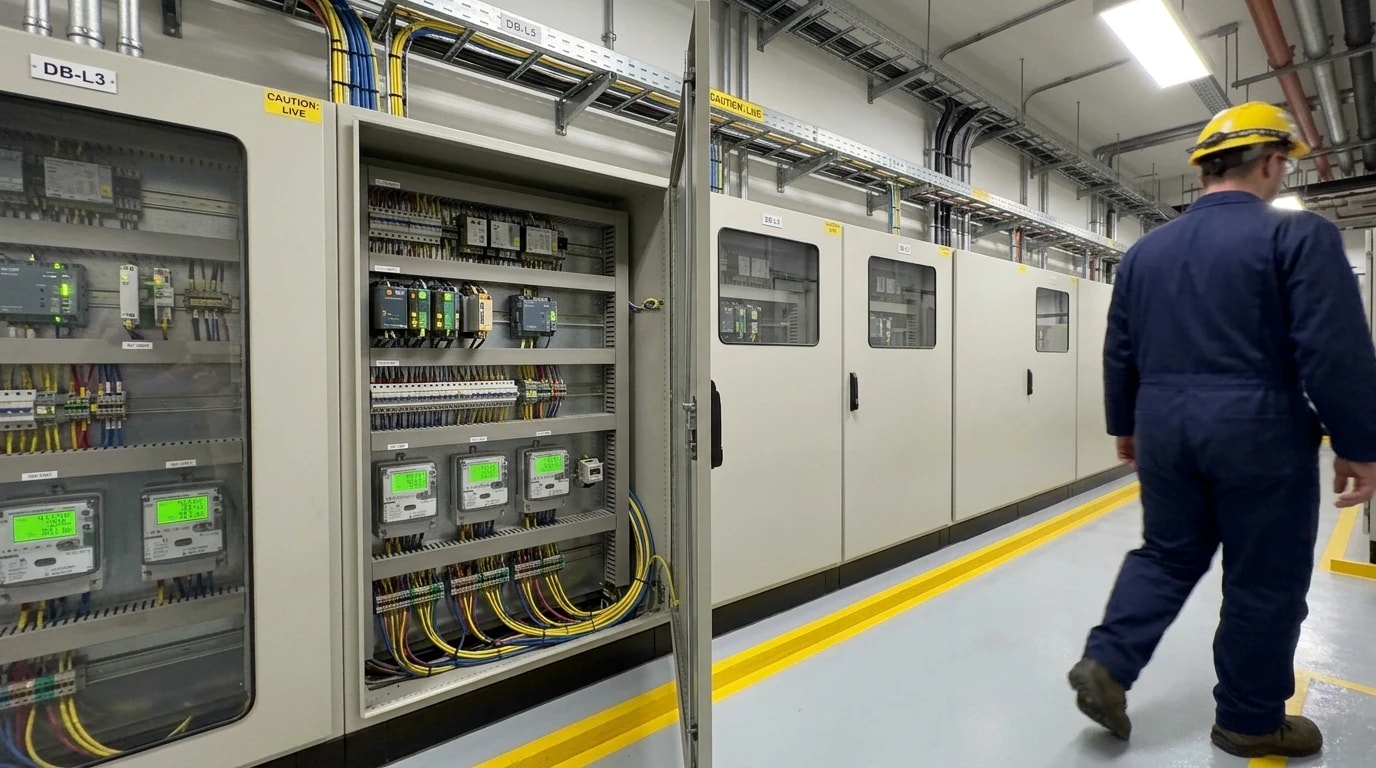
Large-scale manufacturing, chemical and pharmaceutical operations face a convergence of environmental mandates that turn carbon accounting into a core operational priority. The primary driver in the UK is ESOS Phase 4.
ESOS Phase 4 and the 31 December 2026 Qualification Threshold
Under the statutory framework established by the Department for Energy Security and Net Zero (DESNZ), an organisation qualifies for ESOS Phase 4 if it meets the criteria of a large undertaking on 31 December 2026. This is defined as employing 250 or more people in the UK, or having an annual turnover exceeding £44 million and a balance sheet total above £38 million. Once an undertaking qualifies, the obligation extends across its entire corporate group, capturing subsidiary and sister undertakings regardless of their individual size.
The compliance deadline is 5 December 2027, but the data collection period must cover the qualification year. Phase 4 introduces strict changes. The minimum energy auditing threshold has been raised from 90 to 95 per cent of total consumption. Furthermore, the removal of Display Energy Certificates (DECs) and Green Deal Assessments (GDAs) as valid compliance routes leaves organisations heavily reliant on external Lead Assessors or certified ISO 50001 systems. Gathering four years of historical utility data manually to prove compliance carries significant administrative risk, prompting EHS managers to seek automated carbon footprint reporting.
SECR Alignment and the Pitfalls of Manual Accounting
The Companies (Directors' Report) and Limited Liability Partnerships (Energy and Carbon Report) Regulations 2018 mandate Streamlined Energy and Carbon Reporting (SECR) for large unquoted companies, large LLPs and all quoted companies. The qualifying thresholds for SECR remain at a turnover of £36 million or more, a balance sheet of £18 million or more and 250 or more employees. These figures did not change when the Companies Act size limits were updated in April 2025, widening the gap between financial reporting categories and carbon reporting requirements.
SECR requires disclosure of direct emissions (Scope 1) and indirect emissions from purchased electricity, steam, heating and cooling (Scope 2), as well as annual UK energy consumption in kWh and an activity-linked intensity ratio. To calculate these figures, process engineers must apply the 2026 UK Government GHG conversion factors published by DESNZ on 11 June 2026. Performing this calculation manually once a year leads to compliance scrambles, errors and unverified data that cannot withstand regulatory audits.
EU ETS Monitoring and Reporting Regulation (MRR) Stringency
For energy-intensive chemical and pharmaceutical plants falling within the scope of the EU Emissions Trading System (EU ETS), data requirements are even more severe. The EU ETS Monitoring and Reporting Regulation (MRR), governed by Implementing Regulation (EU) 2018/2066, demands continuous, highly accurate measurement of emissions with defined uncertainty tiers.
From 2026 onwards, emissions reports must undergo independent verification by accredited auditors. In parallel, the EU ETS 2 reporting phase, which covers buildings, road transport and additional industrial fuels, has been extended to run until the end of 2027, before the formal allowance surrender obligations begin on 1 January 2028. This dual tracking phase means operators must maintain audit-ready, granular data trails that tie fuel consumption directly to specific combustion sources and chemical processes.

Omni Vision delivers turnkey utility metering, CO2 tracking, and AI-powered production KPI intelligence — giving you real-time dashboards and actionable insights across your entire facility.
Why Manual Spreadsheet Tracking Fails in Process Industries
Chemical reactors, distillation columns and steam-generating boilers operate in highly dynamic environments. Attempting to track the emissions of these complex units using legacy spreadsheets creates structural vulnerabilities that EHS and finance teams can no longer accept.
The Risk of Delayed Utility Bill Accounting
Most manufacturing facilities still rely on retrospective billing data to calculate their carbon footprint. Utility bills typically arrive 30 to 45 days after the close of a consumption period. This delayed approach means that operational anomalies, such as steam trap failures or compressed air leaks, go undetected for weeks. By the time the carbon accounting spreadsheet is updated, the excess emissions are already locked in and the opportunity to intervene has passed. Retrospective calculations do not allow for active emissions management; they merely document waste after the fact.
Granular Process-Level Attribution Challenges
Spreadsheet-based carbon reporting treats a factory as a single black box. While a utility bill provides the total volume of natural gas or electricity entering a facility, it cannot attribute that consumption to individual production assets. In a pharmaceutical or chemical plant, process engineers must know the exact energy input required for specific reactors, cooling towers and distillation stages. Without sub-metering and automated data ingestion, calculating process-linked Key Performance Indicators (KPIs) like emissions per batch or carbon intensity per tonne of product is highly complex. This lack of granularity prevents facilities from identifying high-intensity processes and making targeted efficiency investments.
MetricManual Spreadsheet TrackingAutomated Carbon AccountingData FrequencyMonthly or quarterly retrospective updatesReal-time, continuous data ingestionAttributionFacility-wide aggregate figuresGranular asset and process-level mappingAudit ReadinessHigh risk of human error; unverifiable trailsMachine-readable, end-to-end data trailsIntervention SpeedReactive (weeks or months after the event)Proactive (real-time anomaly alerts)Regulatory FitProne to failure under ESOS Phase 4 and EU ETSFully compliant with ISO 50001 and MRR standards
The Architecture of Automated Carbon Footprint Reporting for Factories
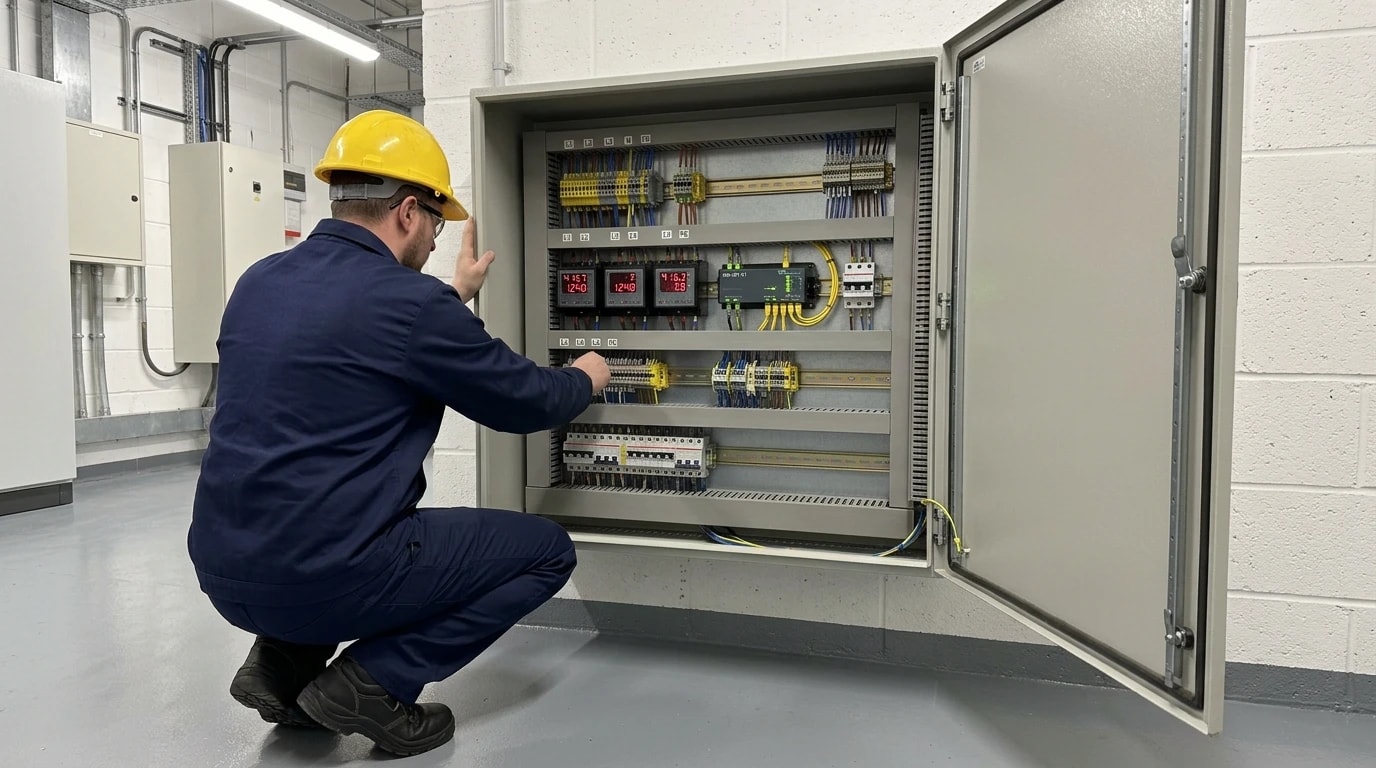
To replace manual accounting with automated carbon footprint reporting, industrial operations require a reliable bridge between physical factory assets and cloud-based environmental analytics. This requires an architecture that combines precision hardware with secure data transmission protocols.
Non-Invasive PLC Integration and Hardware Security
The foundation of automated carbon footprint reporting lies in capturing high-fidelity data directly from the shop floor. Modern manufacturing plants contain programmable logic controllers (PLCs) and dedicated utility meters that monitor essential energy vectors. An automated system connects to these existing controllers using established, non-invasive industrial protocols, including Modbus, OPC-UA, BACnet and MQTT.
Security is paramount when connecting operational technology (OT) to information technology (IT) networks. In GMP-regulated pharmaceutical plants or HACCP-compliant food facilities, unauthorised changes to PLC configurations can compromise product quality and process safety. To prevent this, the data extraction architecture must utilise a secure, one-way encrypted data flow. By ensuring that the edge gateway has zero-write access to plant control systems, the platform maintains the operational integrity of the production environment while securely transmitting utility data to the cloud.
Standardised Turnkey Deployment Models
Deploying carbon tracking technology must not disrupt ongoing manufacturing operations. Turnkey deployment models, typically executed over an 8 to 16-week period, allow plants to transition rapidly from spreadsheet reliance to automated reporting. This process begins with the installation of non-invasive sensors and gateways, followed by the mapping of six core utility streams:
Electricity (grid and on-site generation)
Natural gas (steam boilers and direct-fired processes)
Water (cooling towers and process inputs)
Steam (high and low-pressure distribution networks)
Compressed air (generation and distribution losses)
Fuel oil (backup generators and thermal fluid heaters)
By consolidating these streams into a single system, the deployment team ensures that every energy vector is accounted for from day one, providing the data depth required to meet stringent reporting standards.

Track energy consumption, emissions, and process parameters with seamless PLC/SCADA integration via Modbus, OPC-UA, and MQTT protocols.
Standardising on the Greenhouse Gas Protocol Corporate Standard
Automated carbon footprint reporting must align with the Greenhouse Gas (GHG) Protocol Corporate Standard. This standard provides the globally recognised methodology for defining organisational boundaries and classifying emissions into Scope 1 and Scope 2 categories.
Measuring Scope 1 Direct Combustion Emissions
Scope 1 emissions encompass all direct greenhouse gas emissions from sources owned or controlled by the reporting company. In a manufacturing environment, these primarily stem from stationary combustion, such as natural gas-fired boilers, thermal oxidisers, CHP plants and process reactors.
Automating Scope 1 tracking requires continuous measurement of fuel flow rates, temperature and pressure. These physical measurements are converted into mass or volumetric flow rates, which are then multiplied by the specific emission factors for each fuel type. In the UK, these calculations incorporate the annual DESNZ conversion factors. In chemical plants, where process emissions can also occur from chemical reactions (such as calcination or reforming), the system must integrate stoichiometry-based calculations directly into the reporting pipeline to maintain complete, audit-ready records.
Standardising Scope 2 Indirect Purchased Energy Emissions
Scope 2 emissions account for the indirect GHG emissions associated with the purchase of electricity, steam, heating or cooling. For many manufacturing facilities, Scope 2 represents the largest portion of their operational carbon footprint.
To automate Scope 2 reporting, the system must support both location-based and market-based reporting methods as prescribed by the GHG Protocol.
Location-based method: This is determined by multiplying electricity consumption by the average emissions intensity of the national grid. The platform automatically pulls updated grid emission intensity data to perform these calculations.
Market-based method: This is calculated by applying emission factors from specific energy contracts, such as Power Purchase Agreements (PPAs) or Renewable Energy Guarantees of Origin (REGOs).
By automating the calculation of both metrics, the reporting system provides sustainability officers with the exact data needed for disclosure, while showing the tangible impact of green energy procurement strategies.
Achieving Continuous Improvement and Financial Returns
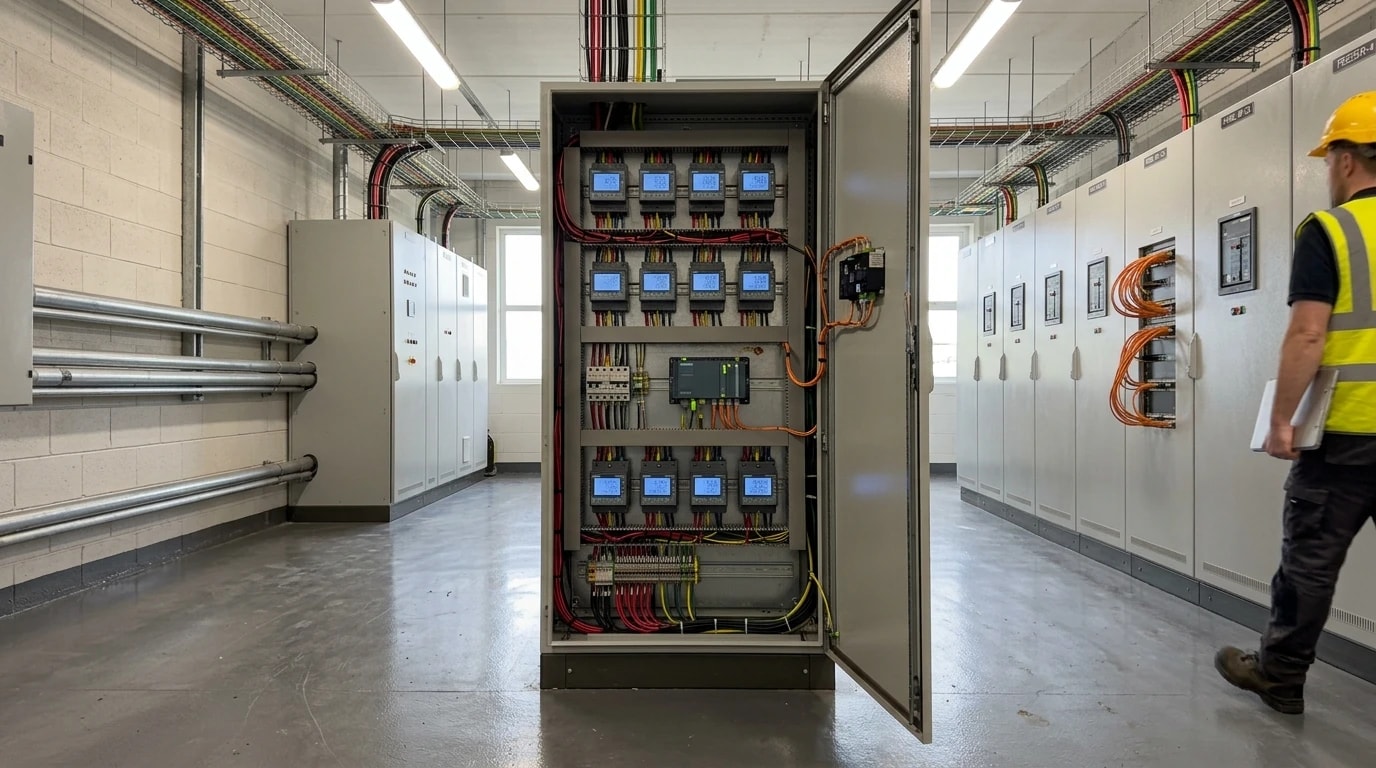
ISO 50001:2018 provides a structured framework for organisations to establish, implement and improve energy management systems (EnMS). The standard relies on the Plan-Do-Check-Act (PDCA) cycle, which demands continuous tracking of Energy Performance Indicators (EnPIs) and Energy Baselines (EnBs).
An automated carbon footprint reporting system serves as the technical engine of an ISO 50001 EnMS. Instead of relying on annual energy audits that provide a static snapshot of performance, the platform tracks EnPIs continuously. By mapping utility consumption directly against production outputs (such as energy per batch or cost per tonne), operations directors can easily identify which production lines are deviating from their established baselines. This provides the granular, verifiable data required to satisfy ISO 50001 surveillance audits and demonstrate ongoing energy performance improvements.
From Compliance Burden to 15 to 25 per cent Energy Cost Reductions
When factory utility data is captured in real-time, process engineering teams can utilise advanced AI-driven analytics to detect inefficiencies that are invisible to the naked eye. Anomaly detection algorithms can identify when a chemical reactor or cooling tower is consuming more steam or electricity than its historical baseline for a given production rate.
Furthermore, predictive forecasting models allow operations managers to anticipate peak electricity demand. By adjusting production schedules to avoid periods of high tariff rates (peak-shaving), factories can achieve substantial cost savings without reducing overall manufacturing output. Industry data shows that transitioning from manual spreadsheet tracking to automated, real-time energy intelligence platforms consistently delivers 15 to 25 per cent energy cost reductions, resulting in a sub-12-month return on investment (ROI).
Implementing a Secure, One-Way Industrial Data Flow
For large-scale manufacturing, pharmaceutical and chemical facilities, data security is non-negotiable. Connecting factory systems to cloud-based analytics platforms must be handled with extreme care to protect intellectual property and process safety.
Process engineers and EHS managers frequently evaluate platforms that utilise advanced encryption standards and strict data governance policies. Security architectures must be designed to allow data to flow only one way: from the shop floor instruments up to the cloud analytics platform. This is achieved using hardware-enforced data diodes or securely configured edge gateways that block any inbound traffic.
By ensuring that the cloud platform has no write access back to the PLC networks, the factory remains fully protected against external cyber threats. Furthermore, the use of industry-standard security protocols such as HTTPS/TLS and MQTT over TLS ensures that sensitive production metrics, recipe data and emissions totals are encrypted during transit. This rigorous approach to security allows EHS managers to achieve complete regulatory compliance without introducing risks to physical plant operations.
This article reflects the independent analysis and editorial opinion of EnerTherm Engineering. Product names, trademarks, and brands mentioned belong to their respective owners. EnerTherm Engineering is not affiliated with, endorsed by, or a licensee of any third-party software or product mentioned unless explicitly stated.

Technical Manager — EnerTherm Engineering
John Naranjo is Technical Manager at EnerTherm Engineering, bringing specialist expertise in chemical and environmental engineering. He recently led the implementation of Omni Vision, EnerTherm's real-time energy and utility monitoring platform. He holds an MSc in Environmental Engineering from the University of Huelva and a BSc in Chemical Engineering, with memberships in both the Energy Institute and IChemE.
