
Why UK Plants Are Automating SECR and ESOS Reporting
Real-time IoT metering builds audit-ready Scope 1 and 2 data for SECR and ESOS.
On 5 December 2027, qualifying UK organisations must submit their ESOS Phase 4 notification of compliance, supported by energy evidence, identified opportunities and board-level sign-off. For many industrial sites, that deadline exposes a persistent weakness: energy and emissions data remains scattered across supplier portals, invoices, meter logs, maintenance records and spreadsheets.
The reporting burden is no longer limited to producing an annual total. Streamlined Energy and Carbon Reporting, or SECR, requires organisations in scope to explain their energy use, greenhouse gas emissions, intensity ratios, energy-efficiency action and calculation methodology. ESOS requires an assessment of energy consumption across buildings, industrial processes and transport. ISO 14064-1:2018 sets principles for a greenhouse gas inventory, including completeness, consistency, accuracy and transparency.
UK plants are therefore adopting automated sustainability reporting tools to create a traceable route from a reported Scope 1 or Scope 2 figure back to metered activity data, approved conversion factors, calculation records and documented exceptions.
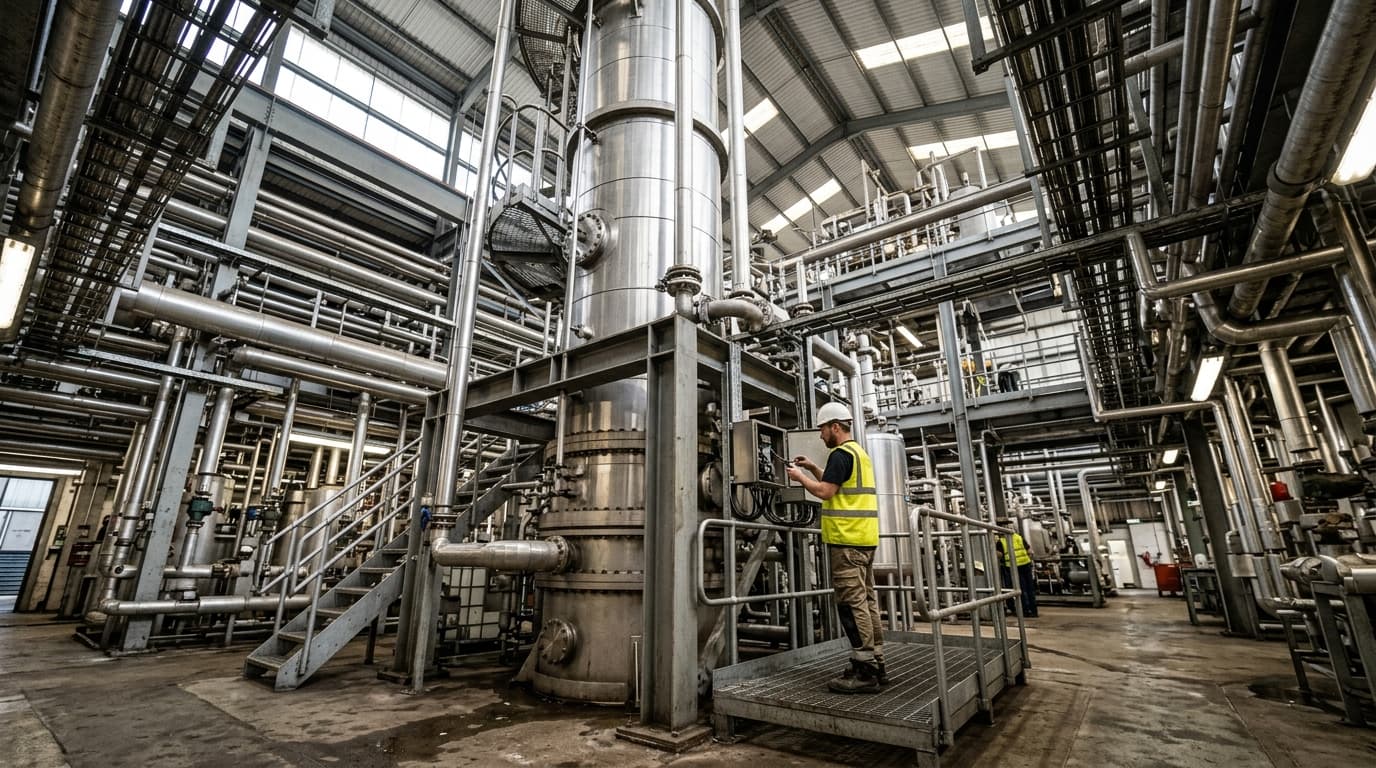
Omni Vision delivers turnkey utility metering, CO2 tracking, and AI-powered production KPI intelligence — giving you real-time dashboards and actionable insights across your entire facility.
SECR makes energy and carbon evidence a directors' report issue
The Companies (Directors' Report) and Limited Liability Partnerships (Energy and Carbon Report) Regulations 2018 introduced the core SECR requirements for financial years beginning on or after 1 April 2019.
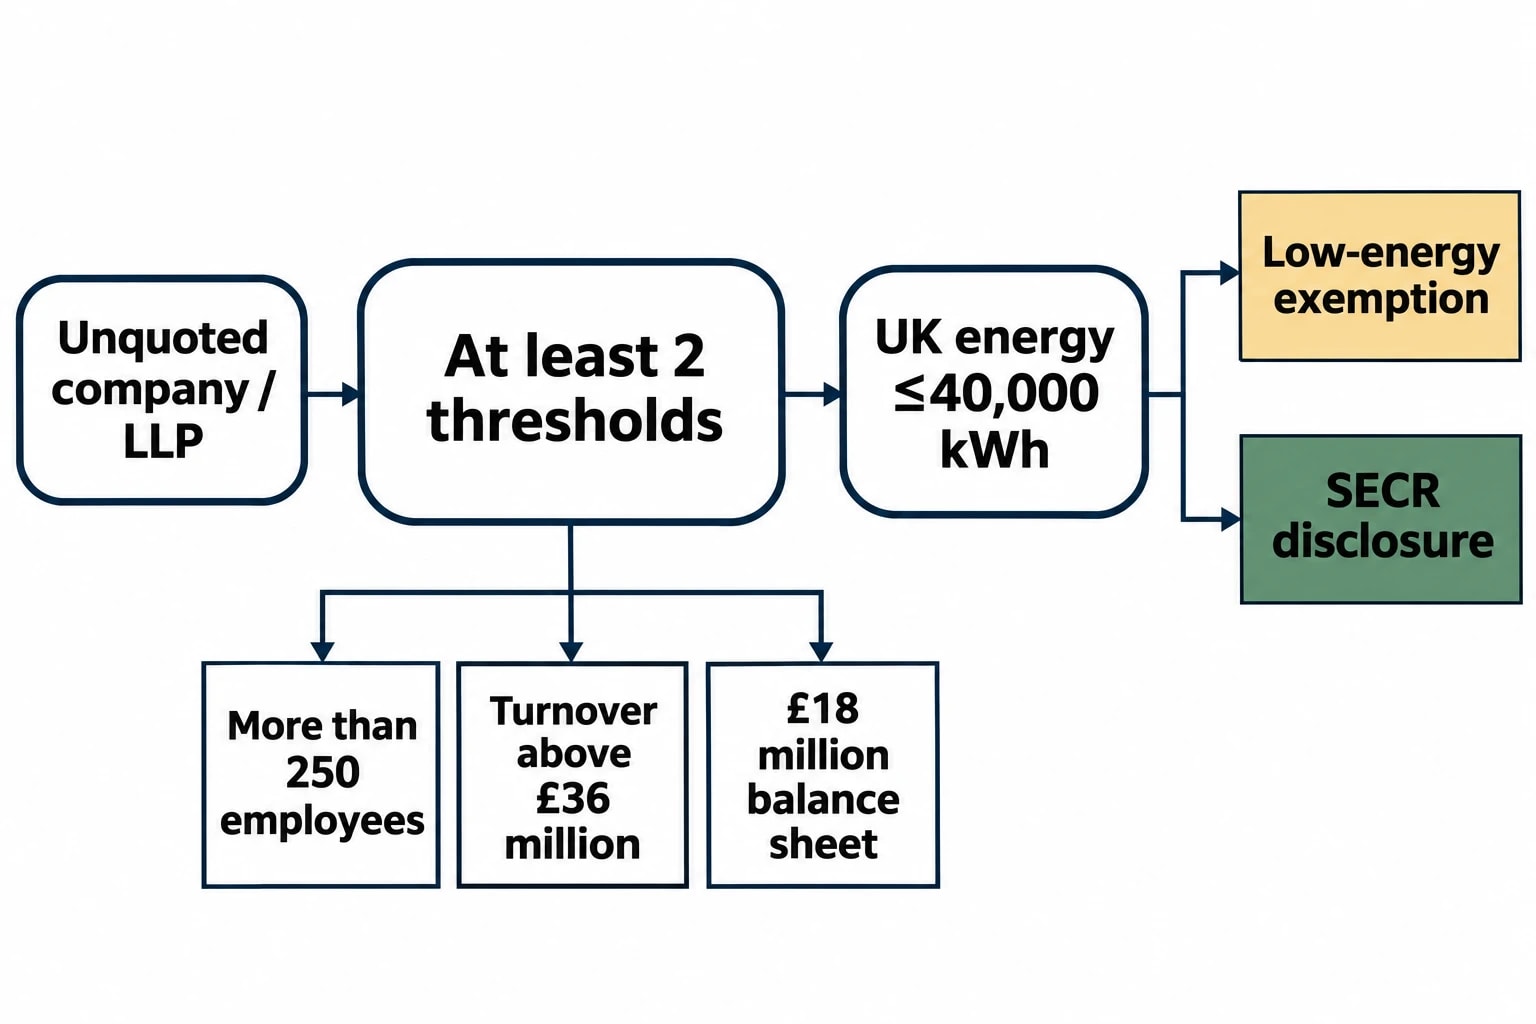
SECR applies to quoted companies and to large unquoted companies and LLPs that meet at least two of the relevant thresholds:
- More than 250 employees
- Annual turnover above £36 million
- Balance sheet total above £18 million
The low-energy-consumption exemption may apply where UK energy consumption is 40,000 kWh or less during the reporting period. Organisations claiming it must state that they have not made the detailed disclosures for that reason.
What SECR requires from industrial organisations
Large unquoted companies and LLPs in scope report UK energy use, associated greenhouse gas emissions, at least one intensity ratio, energy-efficiency action and the methodology used. They also report comparative figures for the previous year, except in their first reporting year.
Quoted companies have wider obligations, including global energy use and greenhouse gas emissions. The reporting boundary therefore matters. A UK manufacturer with overseas operations cannot treat every SECR calculation in the same way as a standalone unquoted plant.
For industrial facilities, activity data commonly includes:
- Purchased electricity
- Natural gas for boilers, furnaces and process heat
- Transport fuel
- Other fuels within the relevant reporting boundary
- Purchased heat, steam or cooling where applicable
A year-end spreadsheet can assemble these numbers. It is less effective at proving the source of each figure, the date of the reading, the person who corrected an anomaly or the factor set used to calculate CO₂e.
Intensity ratios expose poor data alignment
SECR requires at least one intensity ratio. Manufacturers often use kWh per tonne of product, tCO₂e per batch, energy cost per unit or tCO₂e per £ million turnover.
The ratio must use compatible boundaries and time periods. Dividing annual electricity consumption by a monthly production figure produces a number with little analytical value. A change in production volume can also make total consumption appear worse where the plant has improved energy performance.
Automated sustainability reporting tools can link utility and production data to the same reporting period. Environmental managers can then distinguish a production increase from a rise in energy intensity. This supports the SECR disclosure and gives engineering teams evidence to investigate excessive boiler firing, compressed-air losses, unnecessary idle operation or process changes.
ESOS Phase 4 requires verifiable energy consumption data
ESOS is a mandatory energy assessment scheme for qualifying large UK undertakings and corporate groups. The Phase 4 qualification date is 31 December 2026. Organisations must assess total energy consumption across buildings, industrial processes and transport, then identify areas of significant energy consumption.
Those areas must account for at least 95% of total energy consumption. That threshold makes incomplete data collection a compliance risk, particularly where a group operates several sites, maintains a mixed fleet or uses substantial process energy.
Energy audits must be grounded in evidence
An ESOS-compliant energy audit must use verifiable energy-consumption data measured over a 12-month period, so far as reasonably practicable. For Phase 4, the period must begin on or after 6 December 2022.
The audit must analyse energy consumption and energy efficiency, identify energy-saving opportunities and include site visits where required. Data collection cannot replace the work of an ESOS lead assessor, but it determines the quality and speed of the evidence pack available to that assessor.
Phase 4 also requires participants to report energy savings achieved since the previous compliance date. They must review action-plan commitments and explain measures that were not implemented. This increases the value of continuous metering.
A site that records only annual supplier invoices may struggle to demonstrate whether a completed energy project changed performance. A plant with time-stamped utility and production records can compare suitable baseline and post-installation periods, then document adjustments for production volume, operating hours and seasonal conditions.
Why manual collation creates discrepancies
Industrial energy data often sits with different teams and systems. Finance may hold electricity invoices. Engineering may record boiler fuel, steam and compressed-air readings. Procurement may retain oil records. Operations may manage batch or tonnage data. Fleet teams may hold transport fuel information.
This arrangement creates predictable reporting errors:
- Gas volumes may be reported in m³ while the energy inventory requires kWh.
- A new meter may be omitted after a line expansion.
- Estimated readings may be mixed with actual readings without identification.
- Duplicate invoices may be included in a reporting period.
- A formula may retain the previous year's emissions factor.
- A production denominator may cover a different period from the energy total.
Automation cannot remove the need for review, but it can identify missing intervals, duplicated records, implausible readings and changes in meter coverage while site personnel can still investigate them.
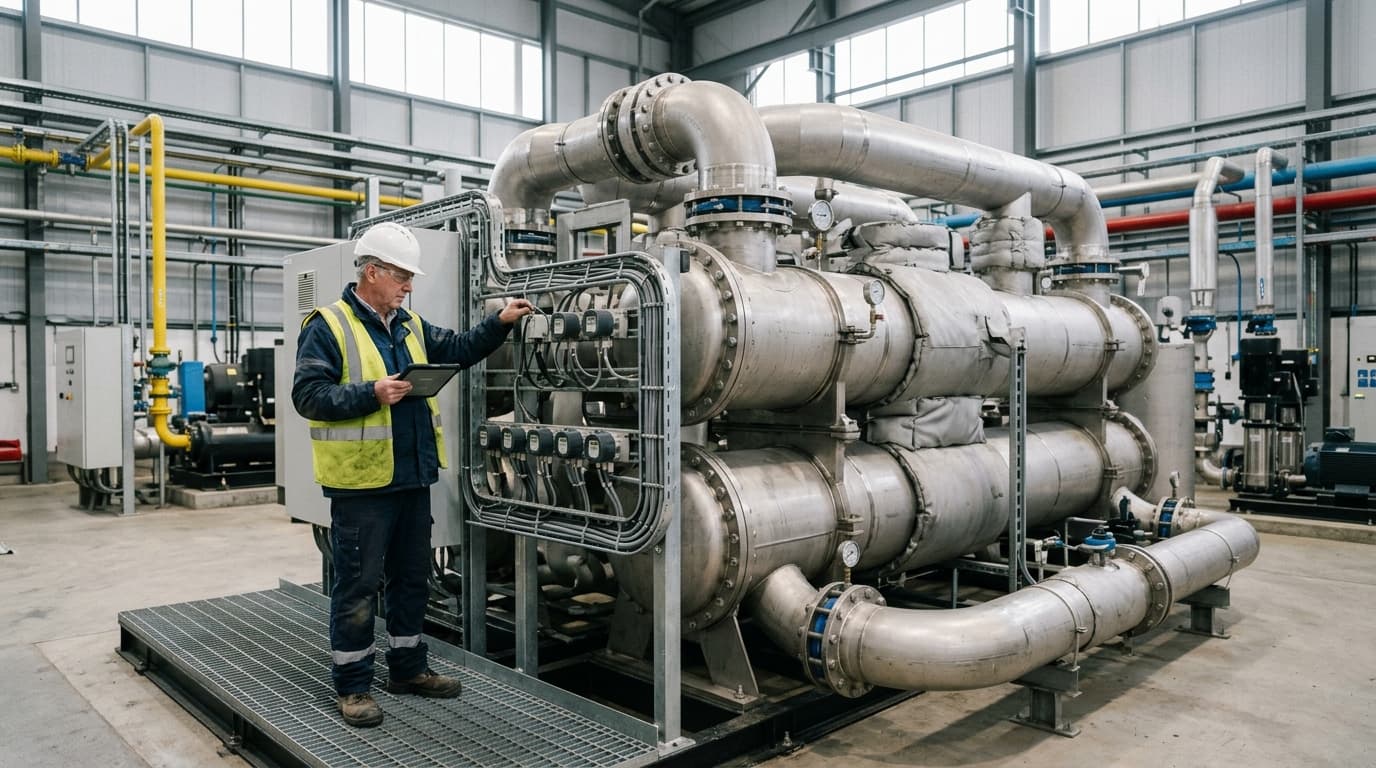
Track energy consumption, emissions, and process parameters with seamless PLC/SCADA integration via Modbus, OPC-UA, and MQTT protocols.
What automated sustainability reporting tools need to control
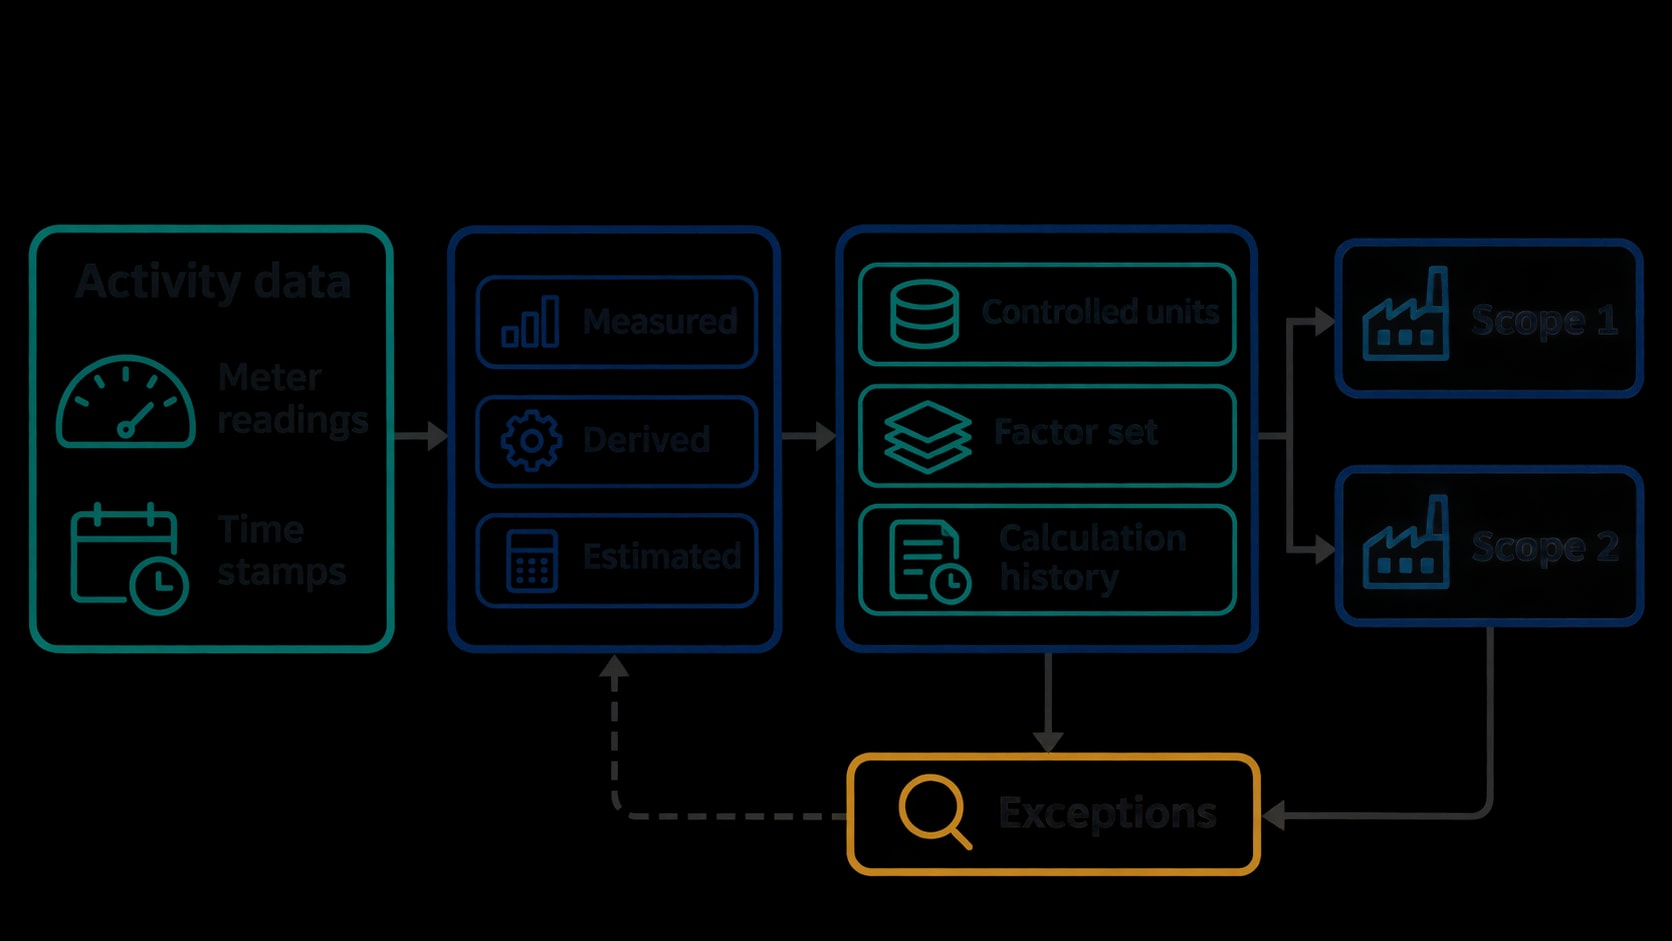
Useful automated sustainability reporting tools start with activity data and governance, not a final carbon total. They collect readings at defined intervals, retain timestamps and record whether each figure is measured, derived or estimated.
For a large manufacturing site, the reporting model should cover incoming utility supplies and material energy users. The appropriate degree of sub-metering depends on the plant's energy profile, reporting boundary and investigation needs.
| Reporting need | Supporting evidence | Practical automation function |
|---|---|---|
| SECR energy use | Meter data, supplier records and fuel records | Consolidates readings by utility and reporting period |
| Scope 1 emissions | Gas, fuel and relevant process activity data | Applies controlled units and preserves calculation history |
| Scope 2 emissions | Purchased electricity, heat, steam or cooling records | Matches activity data to the selected reporting method |
| ESOS significant energy consumption | Total consumption and coverage analysis | Aggregates data by site, asset group and activity |
| Energy-efficiency action | Baseline, operating context and post-project performance | Flags consumption changes and retains evidence for review |
Scope 1 and Scope 2 calculations need fixed methods
Scope 1 emissions arise from sources owned or controlled by the organisation. At a manufacturing site, this can include natural-gas combustion, process fuels, company vehicles and relevant process emissions.
Scope 2 emissions arise from purchased electricity, heat, steam or cooling. Electricity is often the largest Scope 2 stream for plants, but reporting teams should not assume that a single supplier invoice provides enough detail for internal monitoring.
The Department for Energy Security and Net Zero publishes UK Government greenhouse gas conversion factors annually. These factors enable organisations to calculate emissions from activity data and are relevant to SECR reporting.
The system should retain the factor set used for each reporting period, alongside the source activity data and any unit conversions. A controlled process separates a meter reading from the emissions factor applied to it. That makes updates easier to review and avoids overwriting the underlying energy record when annual factors change.
Exception management protects reporting completeness
Real-time carbon tracking has greatest value when it directs attention to exceptions. A prolonged zero reading may indicate a communications failure. A sudden step change in gas use per tonne may warrant an engineering investigation. An unusually high electricity reading may be genuine, but it should be checked before it enters the annual inventory.
Teams should define an escalation route for:
- Missing readings and estimated data
- Meter replacements, recalibration and temporary bypasses
- Significant changes to site boundaries or production lines
- Unusual consumption patterns
- Methodology or conversion-factor changes
Each resolved exception should leave a record of the cause, correction and approving person. That record is more useful to an assurance provider than a spreadsheet cell containing a brief comment.
ISO 14064-1:2018 provides a discipline for greenhouse gas inventories
ISO 14064-1:2018 specifies principles and requirements for organisation-level quantification and reporting of greenhouse gas emissions and removals. ISO confirmed the 2018 edition in 2024.
The standard is programme-neutral. It does not replace statutory SECR or ESOS duties, but it provides a recognised framework for organisations seeking a managed, externally reviewable inventory process.
Accuracy, completeness and transparency need operating controls
ISO 14064-1:2018 identifies completeness as including all relevant emissions and removals within the defined inventory boundary. Accuracy requires organisations to reduce bias and uncertainties as far as practicable. Transparency requires enough appropriate information for intended users to make decisions with reasonable confidence.
For an industrial facility, these principles translate into practical controls:
- A register of meters, fuel records and data owners
- Defined organisational and operational boundaries
- Documented treatment of estimates and exclusions
- Controlled unit conversions and factor selection
- Version history for calculations and methodology
- Retention of source evidence and approval records
Automated ingestion of metered data supports accuracy and completeness when those controls exist. The technology captures readings consistently, but the site must still define the boundary, maintain meters, assess data quality and approve corrections.
An audit-ready record shortens the route back to source data
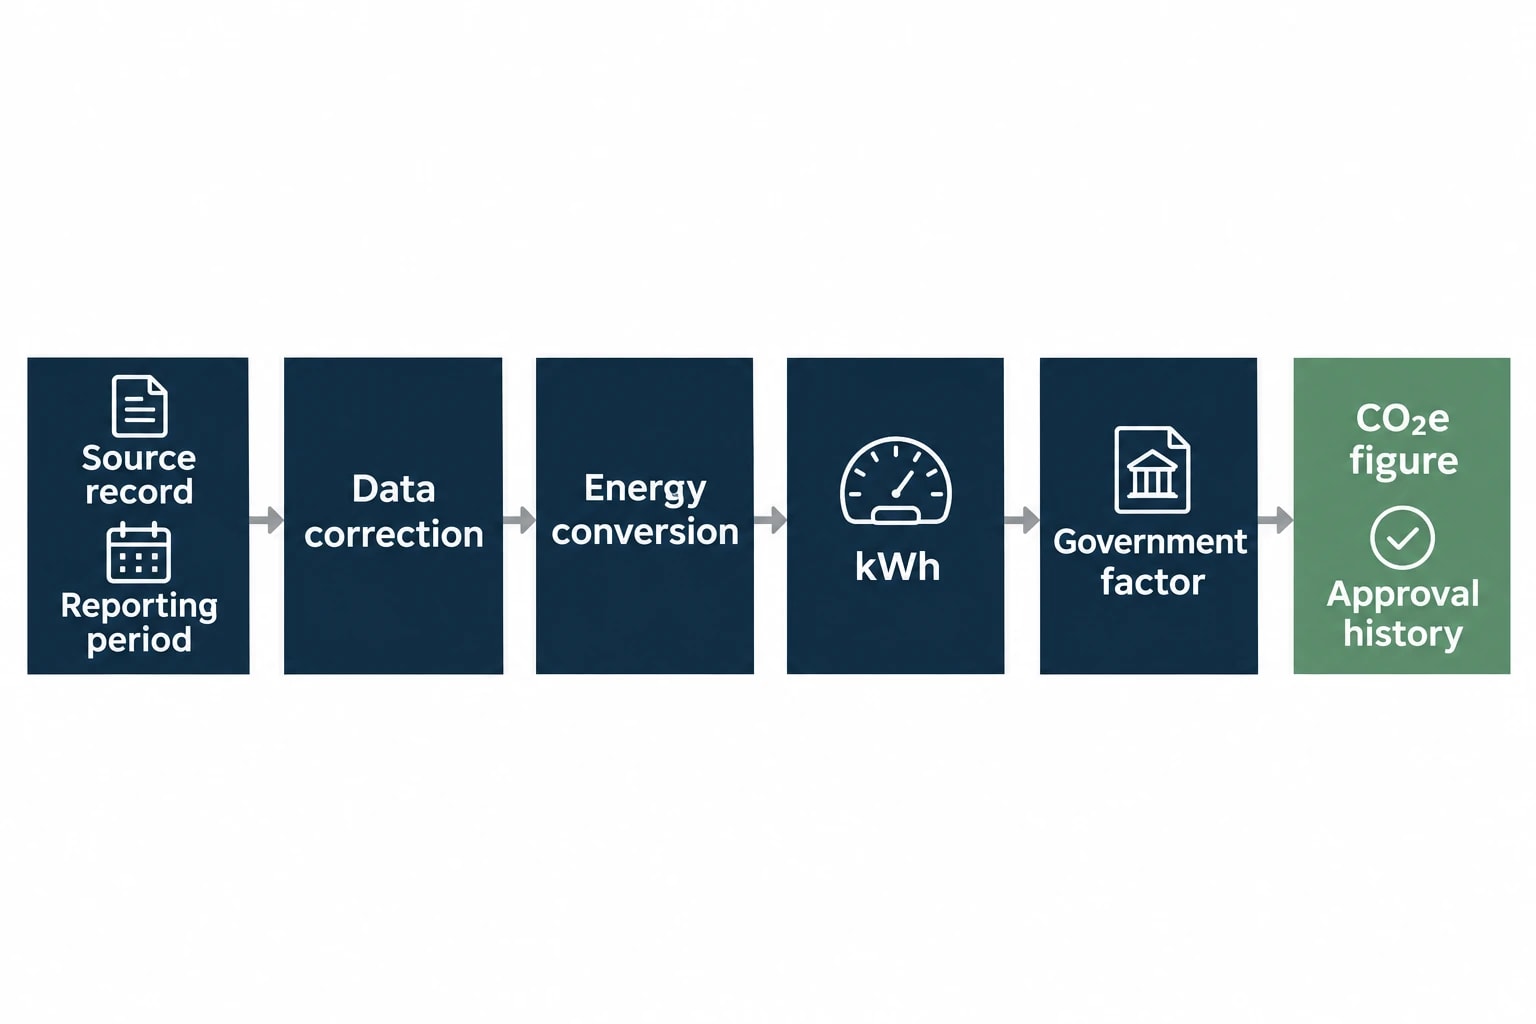
Assurance teams commonly test a reported emissions total by tracing it through the calculation chain. For natural gas, that chain may include a supplier bill or meter record, a reporting period, any data correction, a conversion to kWh, the applicable government factor and the final CO₂e figure.
A controlled reporting platform retains that sequence electronically. It also allows environmental managers to produce an evidence pack without reconstructing the inventory from multiple spreadsheet versions.
The outcome is traceability. Reviewers can identify the energy source, reporting boundary, calculation method and approval history supporting a reported figure.
A practical reporting model for UK plants
A plant does not need to automate every environmental measure on day one. It needs a reporting process that covers material energy streams, documents gaps and improves the quality of each reporting cycle.
A practical implementation sequence is:
- Define the organisational and operational boundaries for SECR, ESOS and the greenhouse gas inventory.
- Map each fuel, utility and production denominator to an accountable data source.
- Verify units, meter locations, data intervals and historical coverage.
- Configure approved emissions factors, intensity ratios and exception thresholds.
- Review missing data, anomalies and methodology changes throughout the year.
- Assemble the final report pack with calculations, assumptions, actions and approvals.
This article reflects the independent analysis and editorial opinion of EnerTherm Engineering. Product names, trademarks, and brands mentioned belong to their respective owners. EnerTherm Engineering is not affiliated with, endorsed by, or a licensee of any third-party software or product mentioned unless explicitly stated.

Technical Manager — EnerTherm Engineering
John Naranjo is Technical Manager at EnerTherm Engineering, bringing specialist expertise in chemical and environmental engineering. He recently led the implementation of Omni Vision, EnerTherm's real-time energy and utility monitoring platform. He holds an MSc in Environmental Engineering from the University of Huelva and a BSc in Chemical Engineering, with memberships in both the Energy Institute and IChemE.
