
Why Industrial IoT Energy Monitoring Needs OPC-UA
How read-only OPC-UA data supports ISO 50001 monitoring and secure PLC integration.
OPC Unified Architecture, or OPC UA, is a platform-independent industrial interoperability standard specified in IEC 62541. It enables energy-monitoring systems to read structured data from PLCs, meters and control systems.
A monthly electricity invoice cannot explain why a plant’s consumption changed. It cannot distinguish a productive sterilisation cycle from an unattended air-handling unit, a compressed-air leak from a demand-led compressor run, or a steam peak caused by a valid batch from one caused by poor sequencing.
Industrial IoT energy monitoring needs that operating context. It must connect measured utility use with the equipment state, production condition and time period that created it. OPC UA provides a common method for obtaining selected, structured operational data from the systems where that context already exists.
For automation engineers, IT/OT managers and facilities leads, the value lies in disciplined connectivity. A monitoring platform can relate electricity, gas, steam, water, compressed air and oil consumption to line operation, batch state and major equipment status without becoming a new control layer.
Why industrial IoT energy monitoring needs operational context
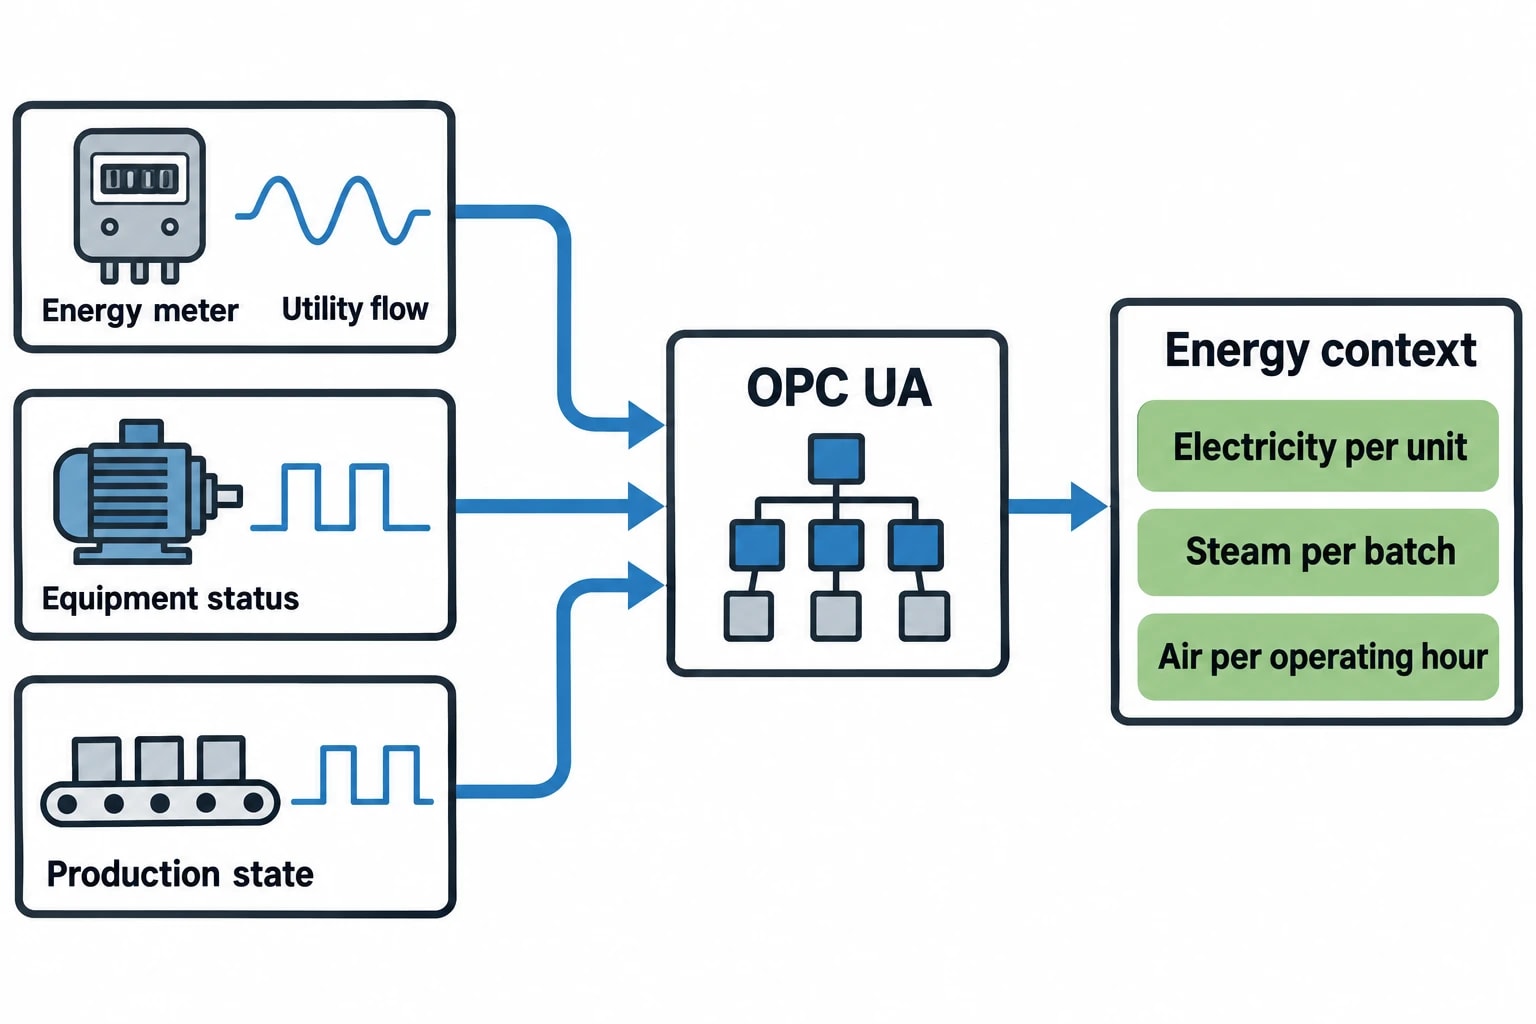
A fiscal or revenue-grade meter establishes how much energy entered a site or passed a distribution point. It does not establish whether that energy delivered saleable output.
Manufacturers need to understand energy performance at the level where decisions are made. That may be a production line, clean-in-place cycle, furnace campaign, compressor train or utility plant. Pharmaceutical sites often need a more granular view, separating production-related demand from cleanroom HVAC, purified-water systems, clean steam and other environmental loads.
Utility data needs production signals
Industrial IoT energy monitoring combines direct measurement with operational signals. The precise mix varies by plant, but useful data commonly includes:
- Electricity consumption, demand and power factor
- Gas, oil, water, steam and compressed-air flow
- Pressure, temperature and equipment run status
- Line speed, production count or operating mode
- Batch identifiers, recipe phases or campaign states
- Alarm and event states that explain abnormal conditions
This allows teams to investigate energy use in relation to work performed. Electricity per unit produced, steam per batch and compressed air per operating hour are more useful than a site total viewed in isolation.
A facilities lead reviewing elevated weekend demand can compare sub-meter readings with compressor status, refrigeration load, air-handling schedules and production activity. The investigation focuses on a defined period and asset group rather than an assumption based on a single meter total.
ISO 50001 monitoring requires valid, useful evidence
ISO 50001:2018 provides a framework for establishing and improving an energy management system. Clause 9.1, Monitoring, measurement, analysis and evaluation, requires organisations to determine what they will monitor and measure, how they will obtain valid results, when measurement will occur, and when results will be analysed and evaluated.
That requirement has practical consequences for plant data. A spreadsheet of monthly invoices supports financial reconciliation, but it rarely provides the time resolution or operating context required to assess a significant energy use.
An industrial IoT energy monitoring programme should define:
- The utility and operational variables required for each energy performance indicator.
- The source system responsible for each value.
- The unit, multiplier, sampling interval and aggregation method.
- Rules for identifying missing, stale or poor-quality data.
- Production conditions that make comparisons valid.
OPC UA helps preserve this evidence chain because it exposes more than an unlabelled numerical value.

Omni Vision delivers turnkey utility metering, CO2 tracking, and AI-powered production KPI intelligence — giving you real-time dashboards and actionable insights across your entire facility.
What OPC UA contributes to energy monitoring
OPC UA uses a client-server model. A monitoring gateway, historian connector or collection service acts as the client and requests information from an OPC UA server. The server may sit within a PLC, SCADA platform, meter gateway or dedicated integration component.
Its defining advantage is the OPC UA address space. Rather than treating every source as a disconnected register address, the address space represents information as nodes and relationships.
Structured information improves data interpretation
An OPC UA node can represent a meter reading, equipment state, process value, alarm, object or data type. The hierarchy can show how a point relates to an asset, process area or production line.
For energy monitoring, that structure improves data mapping and later analysis.
| Data element | Energy-monitoring purpose |
|---|---|
| Node identity | Provides a traceable reference to the source signal |
| Engineering unit | Distinguishes kWh, m³, bar, °C and percentage values |
| Timestamp | Supports shift, batch and interval analysis |
| Status code | Identifies uncertain, unavailable or invalid values |
| Asset hierarchy | Connects a utility point to equipment, line or area |
| Event state | Relates abnormal consumption to an operational event |
A poorly described tag creates long-term reporting risk. A value named Flow_12 may be understandable to the engineer who configured it, but it has little audit value without a documented unit, source, location and purpose. Structured naming and metadata make a metering estate easier to review when equipment changes or reporting requirements arise.
Timestamps determine whether energy data can be trusted
Energy analysis depends on time alignment. A half-hourly electricity interval must be compared with production data from the same period. A batch-energy calculation needs an agreed start and finish event. A compressed-air investigation may require shorter intervals and a corresponding pressure signal.
The collection system should retain the time generated by the source where available, alongside the time the monitoring platform received the value. Sites should also establish clear handling for time zones, clock synchronisation and daylight-saving changes.
Without those controls, a plant can misallocate consumption between shifts, create apparent demand spikes or attach a utility peak to the wrong production event.
Subscriptions help capture changing plant conditions
OPC UA supports subscriptions. A client can receive notification when a monitored value changes, rather than requesting every point continuously at a fixed rate.
This suits data such as equipment run status, batch-state transitions and alarm conditions. It can also support timely collection of changing meter or process values. The approach still requires engineering decisions on sampling, deadband and aggregation.
A steam meter totaliser may need different treatment from a rapidly changing electrical-demand value. Facilities teams should select collection intervals according to the intended use of the data:
- Half-hourly or hourly validated values for management reporting
- Shorter intervals for load-profile and leak investigations
- Event-linked data for batch and campaign analysis
- Daily totals for long-term performance reviews where finer detail adds no value
OPC UA supplies the route to data. The energy team must still define the measurement plan.
OPC UA makes PLC connectivity useful for energy performance
PLCs and SCADA systems often hold the operational signals that explain a utility reading. A production counter may show output. A process state may identify cleaning, idle, heating or production. A run signal may show whether a compressor, pump or air-handling unit should have been consuming energy.
These values convert utility monitoring from passive recording into performance analysis.
Linking utility use to operating state
Consider a compressed-air system. A site may meter compressor electrical consumption and compressed-air flow, then use PLC status signals to identify machine-running periods. If air flow remains elevated while production equipment is stopped, engineers have evidence to investigate leaks, inappropriate controls or unloaded compressor operation.
The same pattern applies across industrial utilities:
| Utility stream | Relevant OPC UA operational context | Useful monitoring question |
|---|---|---|
| Electricity | Line status, production count, motor run state | How many kWh were used per unit produced? |
| Steam | Batch phase, sterilisation state, valve position | Which stages create the highest steam demand? |
| Compressed air | Compressor state, line status, pressure | Does demand fall when production stops? |
| Water | Clean-in-place state, batch identifier, flow total | What is water use per cleaning cycle? |
| Gas | Furnace cycle, burner status, product throughput | Does gas intensity change between campaigns? |
| HVAC energy | Occupancy mode, room state, production schedule | Is non-production demand aligned with requirements? |
The table does not imply that every signal should be collected. A disciplined design starts with the energy performance question, then identifies the smallest set of meter and operational values needed to answer it.
The source hierarchy matters
A utility point needs a meaningful place in the plant hierarchy. “Steam flow to line three” has different analytical value from “steam flow to production suite three, serving two lines and a clean-in-place skid”.
The data model should identify whether a meter serves an individual asset, a process area, a shared utility header or the whole site. Shared loads require allocation rules that production, engineering and finance teams understand. An energy performance indicator becomes misleading when a common chilled-water plant is assigned wholly to one line because the source hierarchy was not defined.
OPC UA enables the monitoring system to browse and consume the structure that a source system exposes. The engineering team must validate that the structure reflects the physical plant.
Read-only OPC UA supports non-invasive monitoring
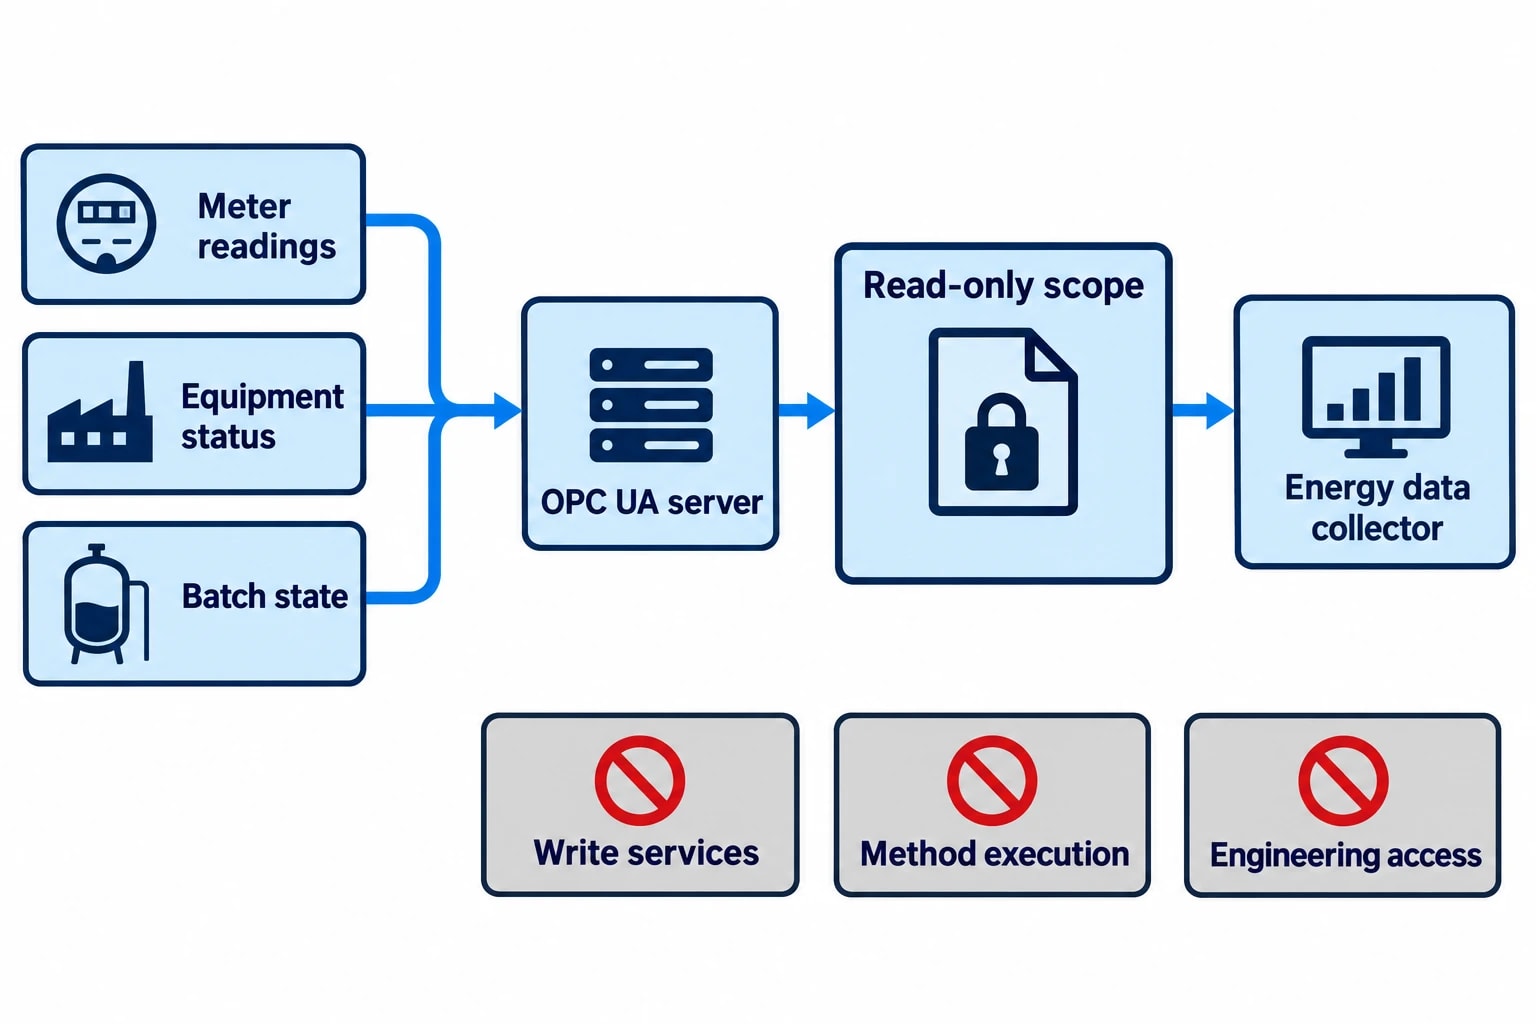
Energy monitoring should observe process operation without becoming a path for changing it. OPC UA supports read and write services, so an implementation must define a read-only monitoring scope and grant the collection client access only to approved variables.
Selected values such as meter readings, equipment status and batch-state signals are available to the data collector. Write functions, method execution and engineering access remain outside the monitoring scope.
This matters in pharmaceutical manufacturing, where validated systems, controlled changes and data integrity procedures govern plant modifications. It also matters in general manufacturing, where a utility-monitoring project must not interfere with PLC control logic or operator workflows.
The UK National Cyber Security Centre’s Cyber Assessment Framework provides a useful benchmark for organisations assessing cyber resilience around essential functions. For energy-monitoring connectivity, the discipline is clear: document the monitoring scope, assign ownership of identities and configuration, limit access to the required function, and review the arrangement when systems change.
OPC UA offers authentication, encryption, access permissions and auditing capabilities. These features require correct site configuration and governance. The protocol supplies the mechanisms; plant owners determine the permitted monitoring relationship.

Track energy consumption, emissions, and process parameters with seamless PLC/SCADA integration via Modbus, OPC-UA, and MQTT protocols.
Using OPC UA across mixed utility and control estates
Industrial sites accumulate equipment over decades. A single facility may include modern PLCs, legacy controllers, package equipment, Modbus meters, BACnet building controls and independent utility data loggers.
OPC UA does not require replacement of that estate. It can provide a standardised interface for selected data exposed by PLCs, SCADA platforms and integration gateways.
Move from tag lists to governed measurement points
Many projects begin with a tag list copied from drawings, SCADA exports and meter schedules. That list should become a governed register of measurement points before it becomes a dashboard.
Each point should record:
- Physical location and served equipment
- Data source and source-system owner
- Engineering unit and multiplier
- Expected range and update frequency
- Whether the value is cumulative, instantaneous or calculated
- Intended energy performance indicator or report
- Data-quality checks and maintenance responsibility
This register reduces ambiguity during commissioning. It also gives facilities and automation teams a shared basis for reviewing changes after a meter replacement, PLC upgrade or line reconfiguration.
Define data quality before analysis
Anomaly detection and forecasting depend on credible source data. A monitoring system should flag a flat-lined meter, missing interval, counter rollover, sudden unit change or timestamp anomaly before presenting a calculated performance indicator as fact.
Routine checks should include comparison of sub-meter totals with main-meter records, confirmation of meter scaling, review of unexpected gaps, and recording of operational events that affect energy comparisons. A site does not need perfect data before it begins monitoring, but it does need visible data quality and a process for correcting identified faults.
Industrial IoT energy monitoring in pharmaceutical plants
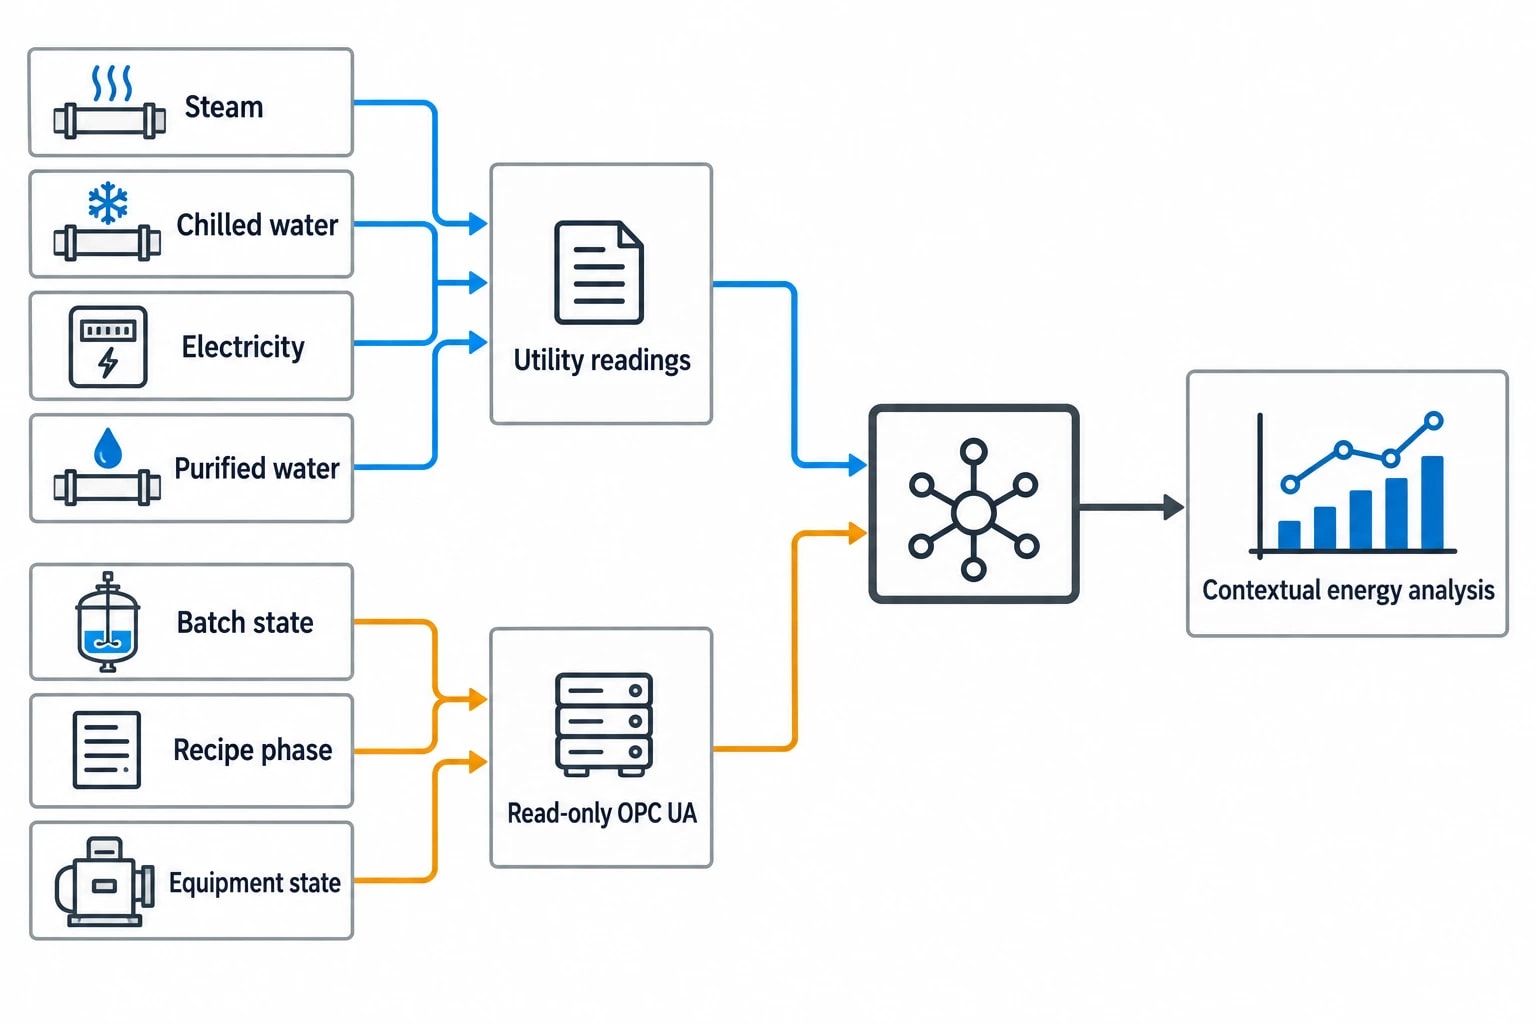
Pharmaceutical facilities present a demanding use case because utility consumption can be substantial while production schedules, cleaning regimes and environmental control requirements vary sharply between areas.
A cleanroom air-handling system may need to operate at a defined condition independent of current production. A clean-steam generator may support several suites. A purified-water system may serve both production and cleaning activities. Measuring utility use alone provides limited insight into whether consumption matches the intended operating condition.
Batch and campaign context improves investigation
OPC UA can provide selected batch, recipe-phase or equipment-state information alongside utility readings. This enables teams to investigate questions such as:
- How does steam use differ between comparable sterilisation cycles?
- Does chilled-water demand rise before, during or after a campaign?
- What is the electrical baseline for a suite between batches?
- Does water consumption during cleaning remain within the established operating range?
- Which utility changes coincide with an alarm, extended cycle or equipment fault?
The analysis must respect site validation and change-control arrangements. The monitoring system should report operational context, not redefine process records or quality decisions.
A practical deployment sequence for OPC UA energy monitoring
The strongest projects establish a clear measurement objective before configuring connectivity. A useful first phase can cover the six principal utility streams: electricity, gas, water, steam, compressed air and oil.
Start with significant energy uses
Identify the areas, equipment and processes that account for material consumption or operational risk. Then map existing meters and missing measurements against the questions plant teams need answered.
A deployment can progress through the following sequence:
- Define the priority energy performance indicators and the operating questions behind them.
- Identify the direct utility measurements and PLC or SCADA context signals required.
- Confirm source ownership, units, timestamps, scaling and expected data quality.
- Configure read-only OPC UA access to approved monitoring points.
- Validate collected values against physical observations, meter records and known production events.
- Establish reporting intervals, exception rules and review responsibilities.
- Expand only after the initial measures produce reliable operational insight.
EnerTherm Engineering’s Omni Vision Energy Intelligence Platform supports non-invasive PLC connectivity through OPC UA, Modbus, BACnet and MQTT. Its monitoring approach combines precision instrumentation with selected read-only plant data and encrypted outward data transmission for analysis in EPSA cloud analytics.
The objective is not to collect every available PLC tag. It is to produce trustworthy answers about energy use, production conditions and abnormal consumption.
Why OPC UA is central to industrial IoT energy monitoring
Industrial IoT energy monitoring needs meter readings that retain their source, unit, timestamp, quality and operational meaning.
OPC UA provides a structured industrial interface for obtaining that context from PLCs, SCADA systems and connected equipment. It supports the disciplined measurement required for ISO 50001:2018, helps teams associate utility use with plant operation, and maintains a defined read-only monitoring relationship with operational systems.
This article reflects the independent analysis and editorial opinion of EnerTherm Engineering. Product names, trademarks, and brands mentioned belong to their respective owners. EnerTherm Engineering is not affiliated with, endorsed by, or a licensee of any third-party software or product mentioned unless explicitly stated.

Technical Manager — EnerTherm Engineering
John Naranjo is Technical Manager at EnerTherm Engineering, bringing specialist expertise in chemical and environmental engineering. He recently led the implementation of Omni Vision, EnerTherm's real-time energy and utility monitoring platform. He holds an MSc in Environmental Engineering from the University of Huelva and a BSc in Chemical Engineering, with memberships in both the Energy Institute and IChemE.
