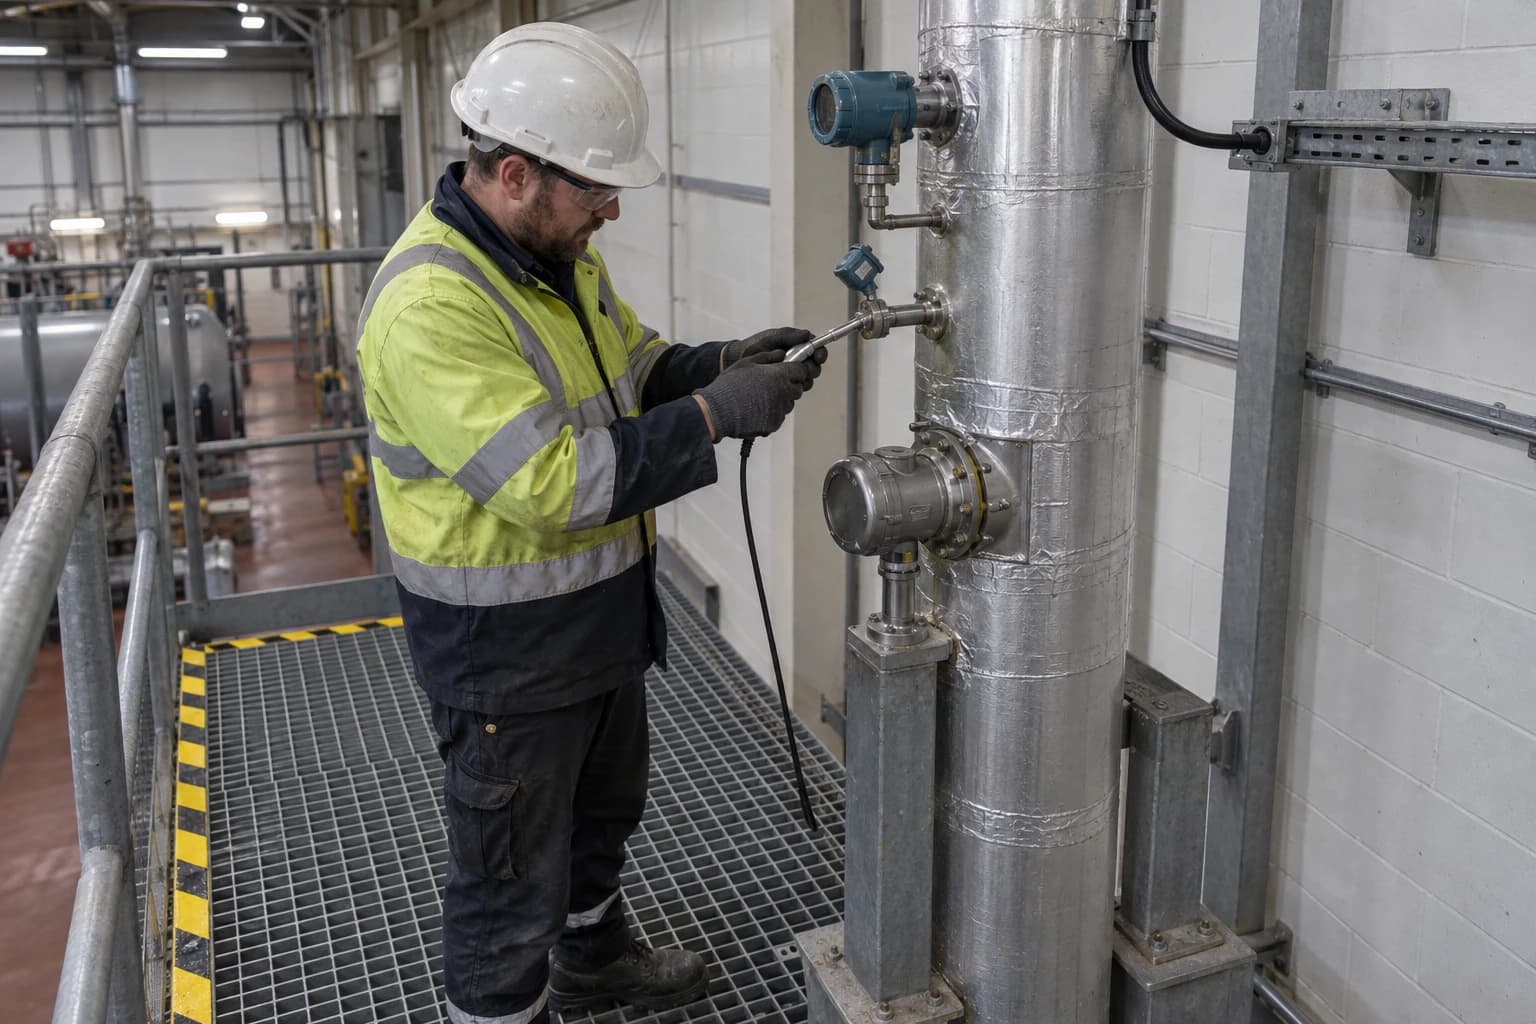
How Industrial Energy Consumption Monitoring Supports ESOS
ESOS Phase 3 requires 12 months of verifiable data to assess consumption and efficiency.
Industrial energy consumption monitoring is the continuous measurement and analysis of electricity, gas, steam and process-heat use across an industrial site to identify waste, allocate costs and verify energy savings.
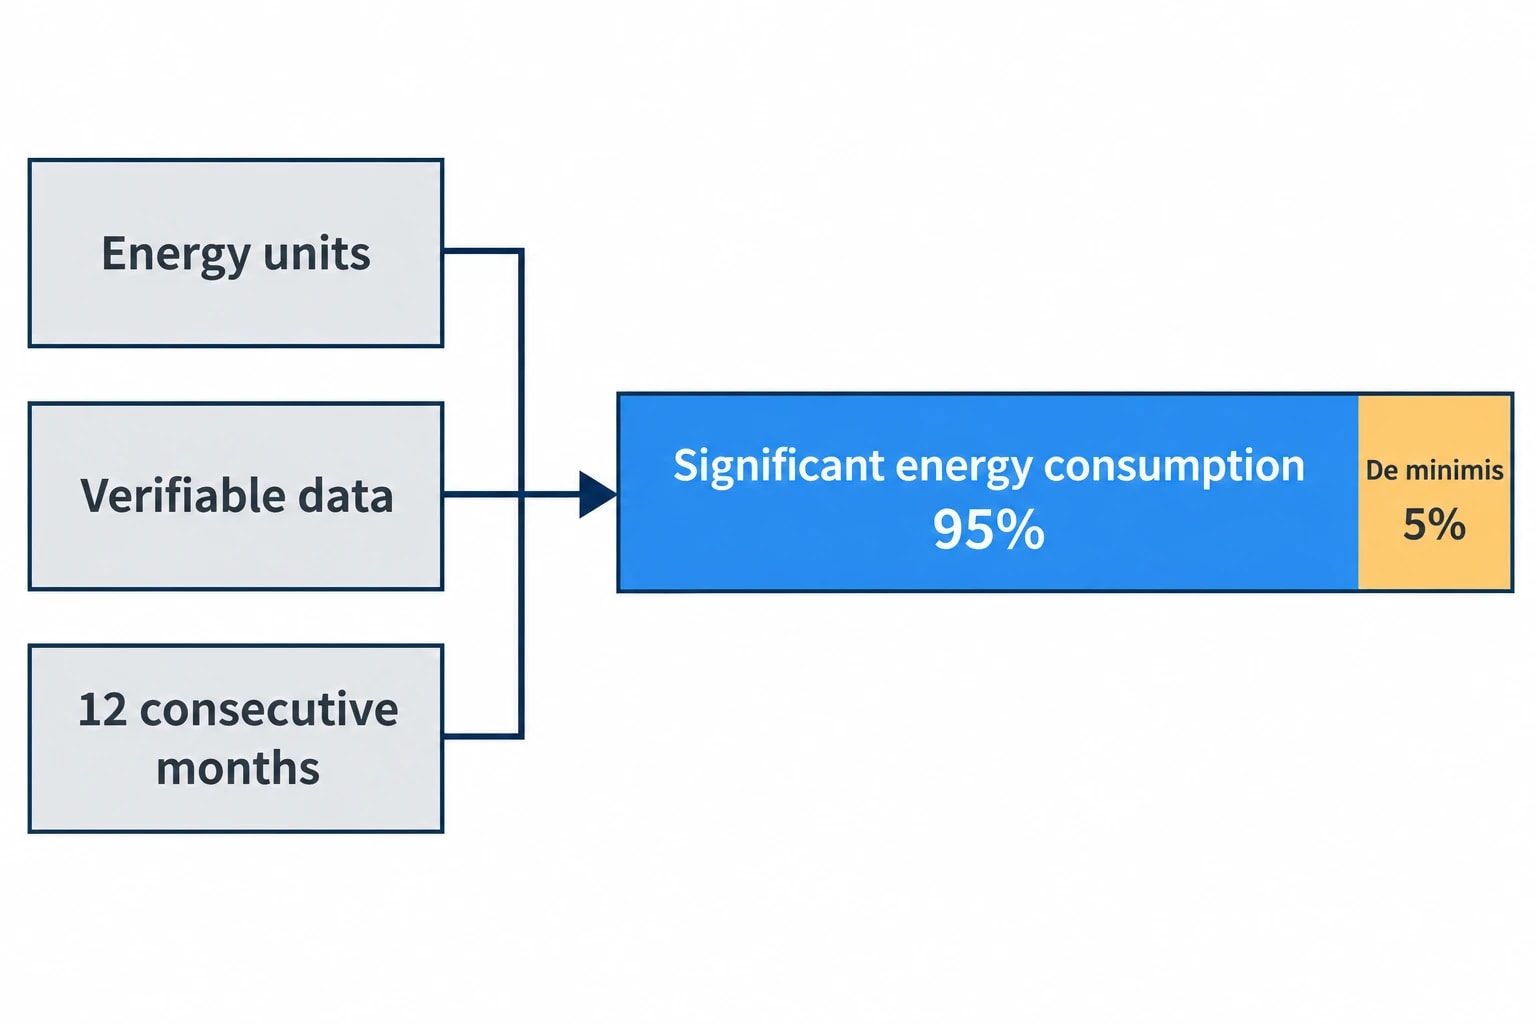
For UK manufacturers, this capability has moved from useful management information to practical ESOS evidence. Phase 3 required energy audits to use 12 consecutive months of energy-consumption data measured in energy units, verifiable and representative of the assessed activity. Organisations must cover at least 95% of total energy consumption through an energy audit or an alternative compliance route.
The second and final Phase 3 progress update is due on 5 December 2026. It must identify measures implemented since the previous notification, show whether committed actions were completed on time, estimate energy saved in the relevant 12-month period, and record the estimation method. A utility invoice can establish annual consumption, but rarely explains which process used the energy, why consumption changed or whether a completed project delivered the expected result. Meter and sub-meter data fills that gap.
For energy-intensive sites, industrial energy consumption monitoring provides the operating evidence behind the audit. It converts a site-wide total into a structured account of energy entering boilers, compressors, refrigeration systems, furnaces, dryers, production lines and utilities.
What ESOS Requires From Industrial Energy Data
ESOS is an assessment and energy-saving scheme for qualifying large UK undertakings and qualifying groups. In Phase 3, organisations had to establish total energy consumption, identify significant energy consumption, calculate energy intensity ratios and assess opportunities for improvement.
An audit cannot rely on energy spend. Energy prices change independently of process performance. Gas consumption must be recorded as an energy quantity, electricity in kWh, and other fuels converted consistently so different energy carriers can be assessed on the same basis.
Twelve Months of Verifiable Consumption Data
The Environment Agency states that, so far as reasonably practicable, an ESOS energy audit must use energy data that is:
- Measured in energy units rather than monetary cost
- Verifiable and capable of evidencing the participant's consumption
- Recorded across 12 consecutive months
Where a full 12-month record is unavailable, the organisation may use a shorter verifiable period or a reasonable estimate, but must record the reason and retain supporting evidence. Continuous industrial energy consumption monitoring reduces the need for assumptions. It establishes a retained, time-stamped record rather than a reconstruction from invoices, delivery notes and manual readings.
For a process plant, the primary meter alone cannot establish causation. A monthly gas bill may show that consumption rose by 8%, while monitoring can show whether the increase followed higher production volume, longer boiler operating hours, failed steam traps, increased dryer load, a change in product mix or abnormal weekend baseload.
Significant Energy Consumption and the 95% Test
ESOS Phase 3 allows up to 5% of total energy consumption to be excluded as de minimis. The remaining 95% or more must be covered by an audit or another valid compliance route.
This places emphasis on a sound energy map. Process engineers need to know which assets and activities sit behind the major loads, then determine whether the monitoring arrangement can distinguish them. In a chemical facility, these may include steam generation, reaction heating, distillation, chilled-water generation, compressed air and solvent recovery. In food and beverage, they may include refrigeration, pasteurisation, cooking, cleaning-in-place, compressed air and packaging.
The energy map should identify both where energy enters the site and where it is consumed or transformed. This prevents a common weakness in audit evidence: treating all electricity, gas or steam as one undifferentiated figure.
Identify where your plant is losing energy and quantify the savings potential — our audits map every heat source, sink, and waste stream in your facility.
How Industrial Energy Consumption Monitoring Builds Audit Evidence
Industrial monitoring starts with boundaries. The metering plan should reflect how the site buys, generates, distributes and uses energy, as well as how it reports production.
Main Meters Establish the Site Balance
Revenue meters and supplier invoices establish the overall quantity purchased. They help check the total electricity and gas records used in ESOS reporting, but have limited resolution. A site import meter cannot distinguish between energy consumed by a boiler house, production line, office space or electrically driven cooling plant.
A practical energy balance compares meter readings at each level of the site:
| Energy area | Typical monitored quantity | Audit value |
|---|---|---|
| Grid electricity import | kWh and maximum demand | Establishes site electricity consumption and load profile |
| Natural gas intake | kWh or m³ converted to energy | Supports boiler, furnace and direct-fired process analysis |
| Boiler house | Fuel input, feedwater and steam output | Identifies generation efficiency and distribution losses |
| Steam distribution | Steam mass flow, pressure and temperature | Allocates steam demand to process areas |
| Compressed-air plant | Electricity input and operating hours | Identifies idling, poor control and avoidable baseload |
| Refrigeration plant | Electricity input, temperatures and operating state | Connects cooling energy with process demand |
| Production line | Electricity, fuel or steam per line | Enables energy allocation and output-normalised analysis |
The balances expose gaps and inconsistencies. If a boiler-house meter records materially more gas than the site gas total, the issue may be a time-period mismatch, incorrect meter scaling, an unmetered supply or a data-quality problem. If the combined electricity use of sub-metered areas remains below the main meter, the residual demand becomes a defined investigation rather than an unexplained variance.
Sub-Meters Make Waste Visible
Sub-metering should begin with significant energy uses, not a wish to meter every motor. The right meter answers an operational question.
A sub-meter on a large compressed-air system can separate productive demand from overnight leakage and inappropriate use. A gas meter on a thermal oxidiser can distinguish abatement fuel from process heating. Steam meters downstream of a boiler house can identify the highest-consuming departments and support cost allocation. Electricity meters on refrigeration compressors can reveal whether rising consumption tracks throughput, ambient conditions or control changes.
A meter alone does not create an energy-saving opportunity. Useful analysis pairs consumption data with operating context:
- Production quantity, batch count or tonnes processed
- Product type and moisture content where these affect thermal load
- Shift pattern and planned shutdowns
- Ambient temperature for weather-sensitive services
- Boiler, furnace, chiller or compressor operating status
- Maintenance events, cleaning cycles and process changes
This context allows site teams to separate legitimate increases in energy demand from avoidable consumption.
Energy Intensity Ratios and ISO 50001:2018
ESOS requires at least one energy intensity ratio for each relevant organisational purpose: buildings, transport, industrial processes and other energy uses. For industrial processes, the Environment Agency recommends relating process energy consumption to a meaningful measure of output, such as tonnes, litres or units produced.
A paper mill may monitor electricity and steam per tonne of saleable paper. A food producer may use kWh per tonne of finished product, while retaining separate indicators for high-temperature processing and refrigeration where product mix makes one site-wide ratio misleading. An automotive plant can relate process energy to vehicles or assemblies produced, but should account for production stage and operating hours where those variables materially affect the result.
Why Total Consumption Is an Incomplete Measure
Total annual energy consumption rises when a factory produces more. That does not automatically indicate poorer performance. Equally, falling total consumption can conceal worse efficiency if output has fallen faster.
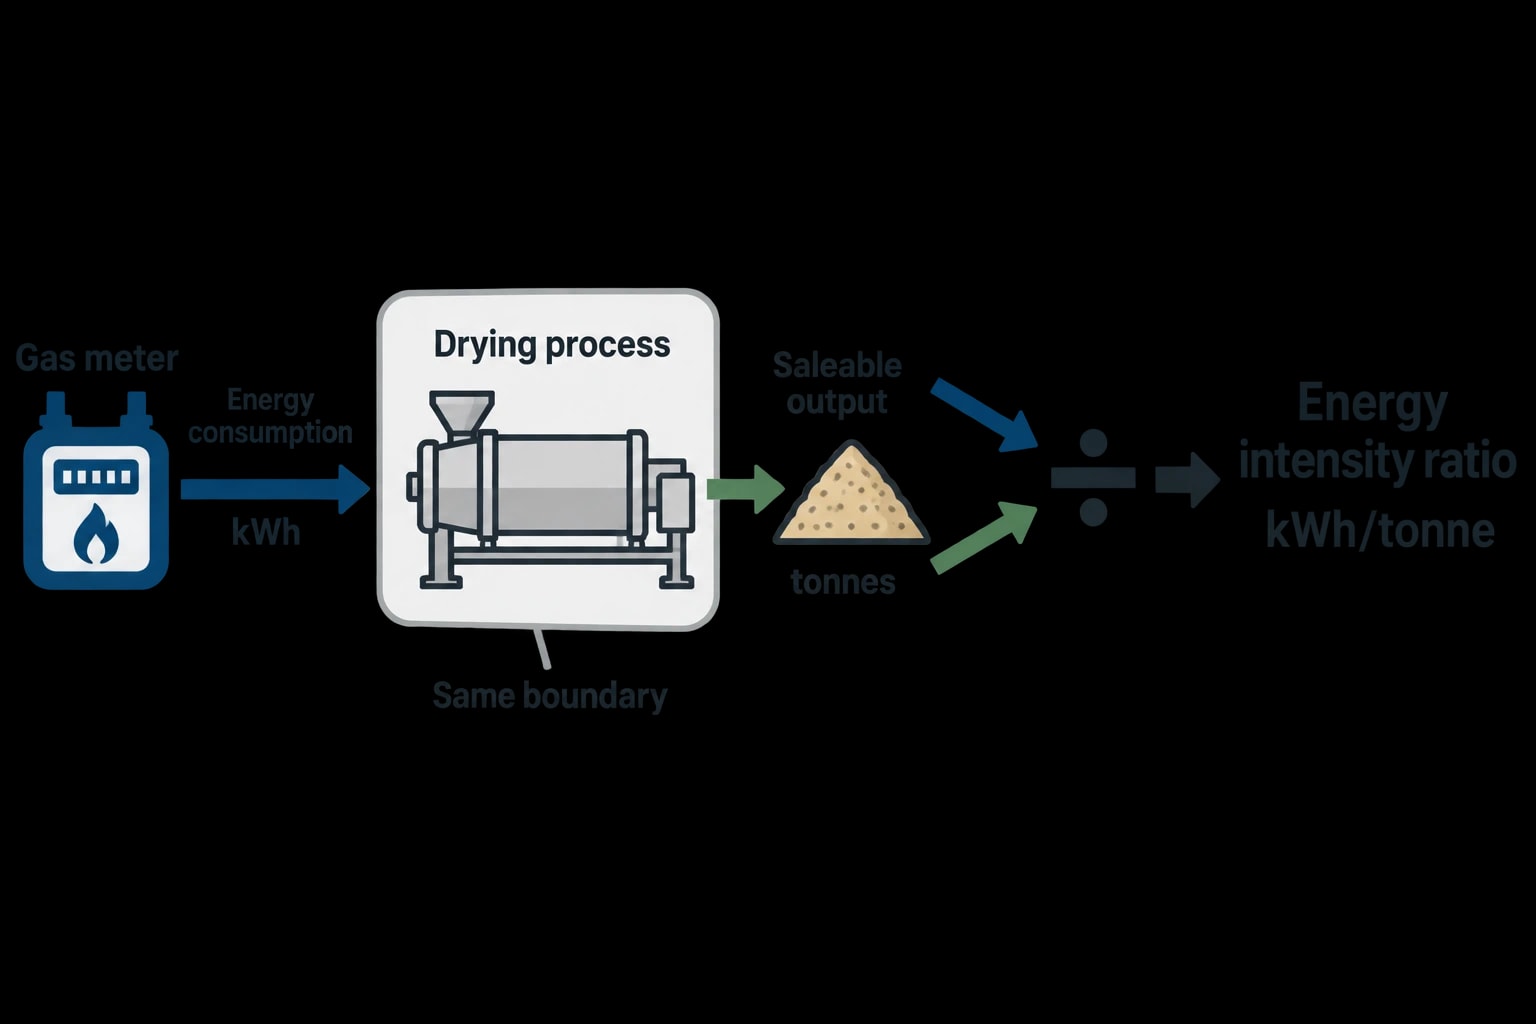
The meaningful comparison is energy consumption against the activity that drives it. ESOS defines the energy intensity ratio as energy consumption in kWh divided by an appropriate indicator of activity. The indicator must be quantifiable and relevant to the assessed energy use.
Industrial energy consumption monitoring makes these ratios more defensible because it captures the numerator at the same operational boundary as the output data. A gas meter serving a drying process should be compared with the production volume or moisture removal associated with that dryer, rather than the output of an unrelated finished-product line.
Using EnPIs and EnBs
ISO 50001:2018 provides a useful management structure alongside ESOS. It uses Energy Performance Indicators, known as EnPIs, to quantify energy performance, and Energy Baselines, known as EnBs, as reference points for comparison.
An EnPI may be a straightforward measure such as kWh per tonne of product. It may also account for relevant variables, including production output, weather, operating hours and product characteristics. The appropriate level of complexity depends on the process and the purpose of the comparison.
For example, a site could establish a baseline for boiler-house gas consumption using historical production, steam demand and operating hours. After installing improved burner controls or repairing steam-distribution losses, it can compare actual use with the established baseline under comparable conditions. The baseline method, data period, meter locations and relevant variables should be documented. This supports ISO 50001:2018 and gives an ESOS assessor a clearer record of how the saving estimate was produced.
A baseline needs review when static factors change. New equipment, major capacity expansion, a change in product portfolio or a different steam-distribution arrangement can make an old benchmark unsuitable. Retaining the reason for each adjustment prevents a site from presenting an apparent saving caused by changed production conditions.

Identify where your plant is losing energy and quantify the savings potential — our audits map every heat source, sink, and waste stream in your facility.
Monitoring Thermal Processes for ESOS Opportunities
Thermal systems commonly dominate industrial gas consumption and can also drive significant electrical loads through fans, pumps, compressors and refrigeration equipment. Monitoring should track both the utility and the process it serves.
Boilers and Steam Networks
A boiler-house monitoring arrangement should normally distinguish fuel input from steam output. Steam flow, pressure and temperature data help plant teams understand distribution patterns and identify periods of high demand. Feedwater quantity and temperature provide useful context where condensate recovery or economiser performance is under review.
A sustained rise in gas input at unchanged steam output may justify investigation of boiler combustion, blowdown practice, feedwater conditions, insulation, leakage or metering quality. A rise in steam flow during non-production hours may point to distribution losses, failed steam traps or equipment left in operation.
Steam cost allocation becomes more credible when departments are metered by mass flow rather than charged from a simple floor-area or headcount basis. This gives production managers a direct view of the energy consequences of operating choices.
Furnaces, Ovens and Dryers
Direct-fired process equipment requires monitoring that reflects its duty cycle. Gas consumption should be linked to product throughput, line speed, firing schedule, temperature setpoint and, where relevant, moisture content.
A dryer can consume more energy for the same finished tonnage if incoming moisture rises. An oven may consume substantial fuel during warm-up and standby periods even if no product passes through it. Separating these states prevents misleading comparisons and helps teams assess improved scheduling, reduced standby time, insulation upgrades or control adjustment.
Heat-loss surveys and thermal efficiency audits complement metered data. Consumption monitoring can identify which furnace or dryer deserves investigation first; field assessment can establish whether heat escapes through refractory condition, doors, ductwork, flues, uninsulated surfaces or poor combustion control.
Refrigeration and Cooling
Food, beverage and pharmaceutical sites often have material refrigeration demand. Electricity monitoring should be read with temperature, operating state and production data. Rising energy use can result from higher cooling load, but may also point to poor condenser performance, inappropriate setpoints, defrost operation, equipment cycling or a control fault.
The same principle applies to chilled-water systems in chemical and pharmaceutical production. Monitoring chiller electrical input without recording chilled-water temperature and flow limits the conclusions an auditor can draw. The data should show both energy consumed and the service delivered.
Turning Meter Data Into ESOS Action-Plan Evidence
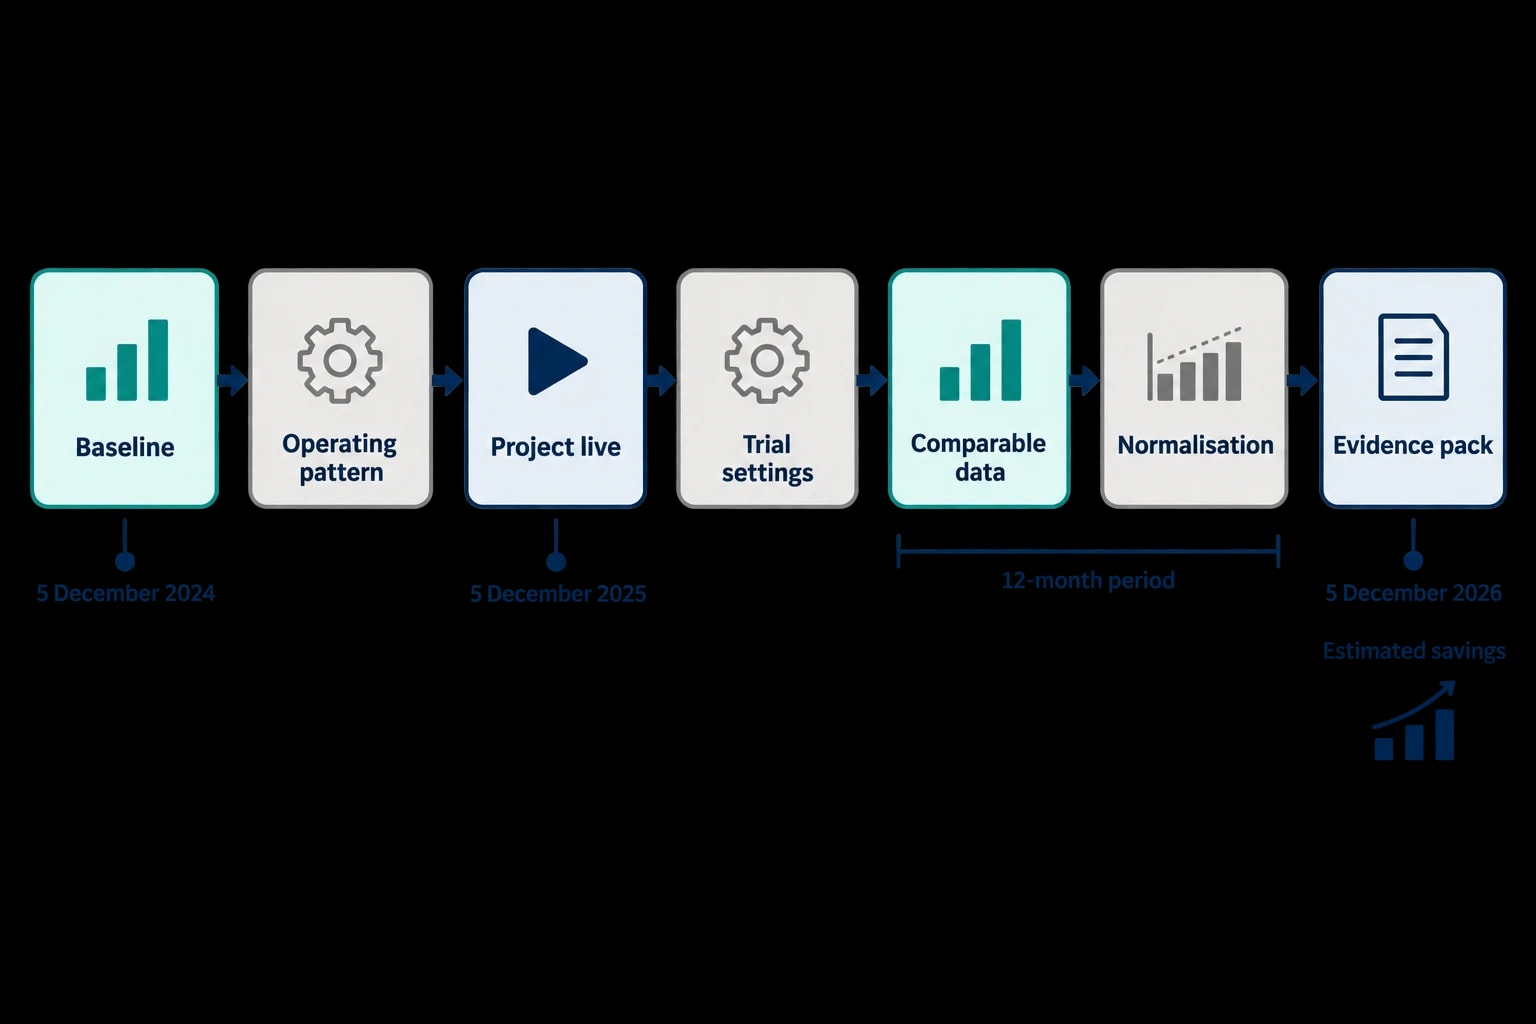
Phase 3 action plans were due on 5 December 2024. The first progress update was due on 5 December 2025, and the second is due on 5 December 2026. Each update must identify relevant measures, report whether they were implemented by the planned date, estimate savings for the 12-month reporting period and describe the estimation method.
Monitoring supports each stage.
Before Implementation
Before a project begins, collect enough representative data to establish the operating pattern. Confirm the meter boundary, verify that data is complete, and record factors likely to affect energy use. A compressed-air project should record production hours and demand profile. A boiler-control upgrade should record gas input, steam output and the production or process conditions that drive steam demand.
This establishes pre-project evidence and prevents an inflated claim based on a short period with unusually high consumption.
During Commissioning
Commissioning can alter energy performance before a project reaches steady operation. Meter data should identify the date the measure became operational, periods affected by trial settings, and any outages or production disruption. Where savings are estimated rather than directly measured, the estimate should be clearly distinguished in the evidence pack.
This matters when a site reports a project completed late, delivered in phases or not operating as expected immediately.
After Implementation
After implementation, compare consumption against the agreed baseline under comparable conditions. The analysis should show the data window, normalisation method, operational changes and excluded periods. Managers can then identify whether a saving persists through changing throughput and seasonal conditions.
For the December 2026 ESOS update, sites should not leave evidence gathering to the reporting deadline. A current meter record enables the responsible undertaking to report actual data where available and explain the method used for any remaining estimate.
A Practical Monitoring Plan for Energy-Intensive Sites
A useful programme is phased. It should start with the largest loads and the decisions site teams need to make.
-
Confirm annual electricity, gas, fuel and imported steam totals against supplier data and site records.
-
Map energy flow from the site boundary to significant processes, utilities and buildings.
-
Prioritise meters at energy uses that contribute most to the ESOS 95% coverage requirement or show the greatest potential for improvement.
-
Collect production, weather and operating-hour data alongside energy records.
-
Set EnPIs for major processes, using units that production and engineering teams recognise.
-
Establish an EnB and document the data period, meter boundary, variables and calculation method.
-
Review exceptions routinely, then investigate causes with operations and maintenance teams.
-
Retain source data, meter specifications, calibration records, calculations and assumptions in the ESOS evidence pack.
EnerTherm Engineering combines industrial thermal efficiency audits, heat-loss assessments and pinch analysis with Ecolog consumption monitoring and process optimisation. The objective is to link measured energy use to the physical behaviour of boilers, steam systems, furnaces, dryers, refrigeration plant and production processes. This gives energy managers a stronger basis for prioritising projects, allocating costs and evidencing savings reported under ESOS.
This article reflects the independent analysis and editorial opinion of EnerTherm Engineering. Product names, trademarks, and brands mentioned belong to their respective owners. EnerTherm Engineering is not affiliated with, endorsed by, or a licensee of any third-party software or product mentioned unless explicitly stated.

Simulation Engineer — EnerTherm Engineering
Rajesh Sekar is a Simulation Engineer at EnerTherm Engineering, specialising in computational fluid dynamics (CFD), finite element analysis (FEA), and thermal process simulation. He holds a degree from Cranfield University and brings extensive experience in simulation-based product development from the automotive, aerospace, and energy sectors.
