
How UK Factories Calculate an Energy Baseline for ISO 50001
A practical method using production, weather and operating-hours data.
An energy baseline is a quantified reference point for a factory’s energy performance, built from historical energy data and adjusted for operational factors that materially influence consumption.
For a UK manufacturing site, that reference point can determine whether a claimed energy saving stands up to internal finance review, an ISO 50001 audit or ESOS evidence requirements. A monthly electricity total alone rarely provides that assurance. Production output changes. Operating hours shift. Winter temperatures affect space heating and process losses. A new line, furnace, compressor or shift pattern can make a previously useful comparison invalid.
ISO 50001:2018, as amended by ISO 50001:2018/Amd 1:2024, requires an organisation to establish energy baselines from its energy review. Clauses 6.4 and 6.5 require organisations to normalise Energy Performance Indicators where relevant variables significantly affect performance, and to revise the baseline when major static factors change or it no longer represents energy performance.
That places the emphasis on disciplined calculation, documented assumptions and traceable source data. For metals, plastics, assembly and process plants, the strongest baseline connects utility bills and meter data with what the factory produced and how it operated.
What an industrial energy baseline measures
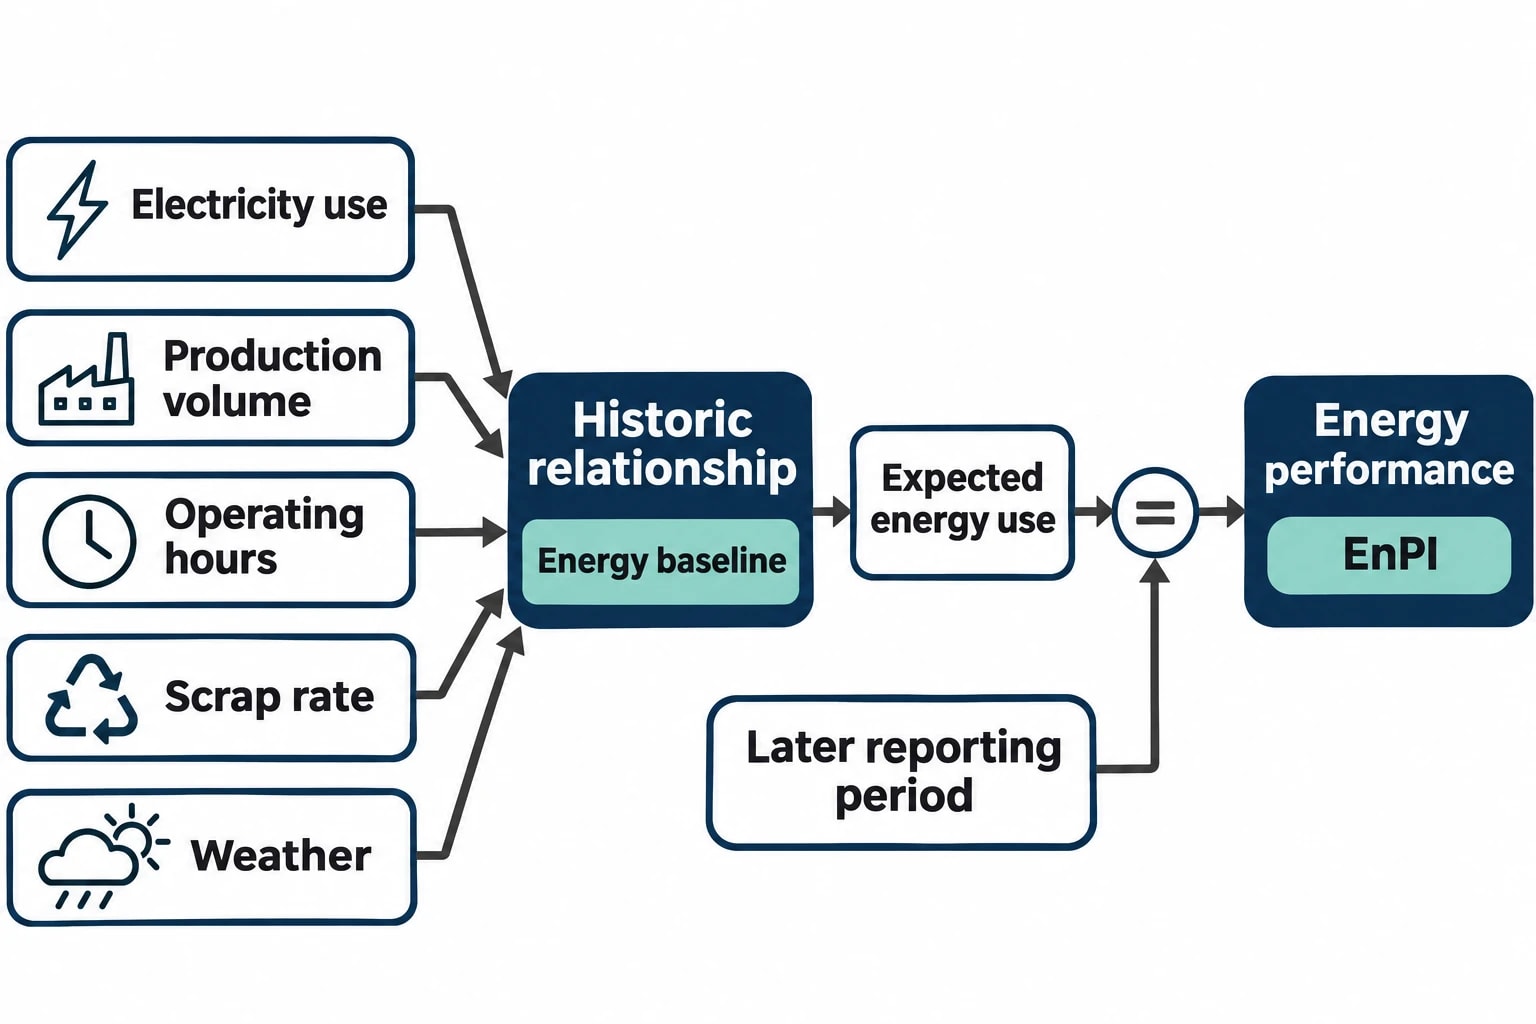
An energy baseline records expected energy use under defined operating conditions. It gives managers a fair comparison point for later reporting periods.
A factory may establish more than one baseline. A site-wide electricity and gas baseline can support annual management reporting, while separate baselines for a melting furnace, compressed-air system or injection-moulding department can support a specific improvement project.
Energy baseline versus energy target
An energy baseline describes past performance under stated conditions. An energy target defines the planned improvement from that reference point.
For example, a plastics factory might set a target to reduce electricity use per tonne of acceptable product by 8%. The baseline must first establish the historic relationship between electricity use, production volume, operating hours, scrap rate and, where relevant, weather. Without that work, a fall in total electricity use could reflect fewer production orders rather than better energy performance.
Energy baselines and EnPIs
ISO 50001 uses Energy Performance Indicators, or EnPIs, to measure energy performance. An EnPI can be simple, such as:
- kWh per tonne of finished steel
- kWh per moulded component
- gas use per operating hour
- compressed-air electricity per m³ of delivered air
- kWh per machine hour for a production cell
A ratio can work well where one factor dominates energy demand and the operating range is stable. It becomes less reliable where several factors move together. A coating line, for instance, may consume substantial fixed energy for extraction, ovens and standby operation before a single part passes through it. Production-normalised consumption can then look poor during low-volume weeks even where equipment efficiency has not changed.
A multivariable baseline handles this more fairly by modelling expected energy from the variables that drive it.

Identify where your plant is losing energy and quantify the savings potential — our audits map every heat source, sink, and waste stream in your facility.
Start with a defined energy boundary
A baseline calculation fails quickly if the energy boundary changes without anyone recording it. The first task is to state exactly which meters, fuels, processes and buildings sit inside the baseline.
Map the factory’s energy flows
Most manufacturing sites begin with purchased electricity and gas, then add other energy streams where relevant. These can include LPG, diesel, fuel oil, steam, compressed air generated on site, exported electricity and recovered heat.
The boundary should identify whether the baseline covers:
- the whole factory
- a building or production department
- a significant energy use, such as process heating
- a discrete project area, such as a compressor house
- a production line or asset group
The meter hierarchy must match the chosen boundary. A whole-site baseline may use half-hourly electricity and gas-meter data. A furnace baseline needs dedicated fuel measurement, production records and evidence of operating state. A compressed-air project may need power-analyser data from compressor motors, plus air-flow and pressure measurements.
Check the meter data before modelling
Energy managers should reconcile interval data against supplier invoices and main meters before drawing conclusions. Missing intervals, estimated reads, clock changes, duplicated files and unit-conversion errors can distort a baseline model.
A practical data-quality register should record:
| Check | Why it matters | Typical response |
|---|---|---|
| Missing meter intervals | Creates false dips in consumption | Obtain corrected data or document the replacement method |
| Estimated billing data | May not reflect actual demand | Prioritise meter downloads or actual reads |
| Meter resets or replacements | Breaks a consumption series | Split the series and document the change |
| Production-data gaps | Weakens normalisation | Use verified production records or exclude affected periods |
| Unusual shutdowns | Can distort average performance | Flag them for possible separate treatment |
| Changed meter boundaries | Invalidates direct comparison | Rebuild or adjust the baseline boundary |
Factory teams should retain original meter exports, invoices, production-system extracts and data-cleaning records. An auditor must be able to follow the path from a reported EnPI back to its source.
Select the variables that drive factory energy use
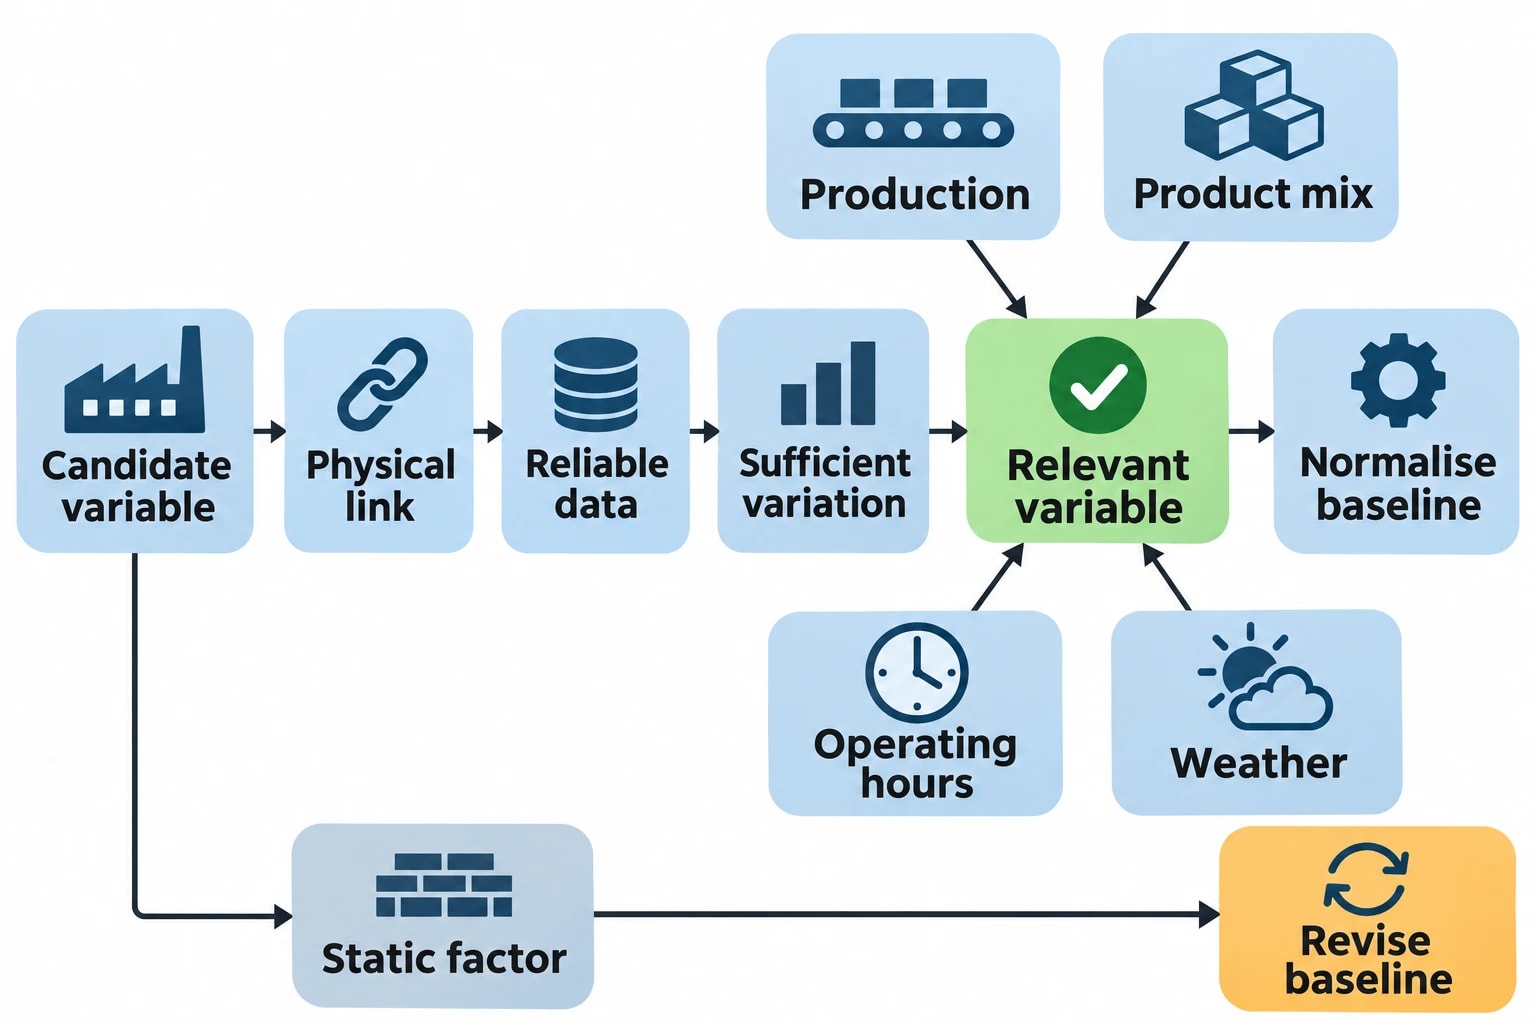
A useful variable has a plausible physical connection to energy consumption, reliable historical data and sufficient variation across the baseline period. Including variables merely because they are available produces a complicated model with little practical value.
Production volume and product mix
Production is the most common variable in industrial energy baseline calculation. A fabricated-metal factory may use tonnes shipped, tonnes cut, press strokes or production hours. An assembly plant may use units produced, but should distinguish high-energy and low-energy product families where they differ materially in welding, test time, paint curing or machining.
Product mix often matters more than total output. A factory that produces both thick and thin plastic components, for example, may see different moulding-cycle times, dryer loads and reject rates. A single units-produced measure can conceal those changes.
Possible ways to manage product mix include separate product-family baselines, weighted production units, or an output variable based on machine hours for a process with highly variable part size.
Operating hours and shift pattern
Operating hours often explain fixed and semi-fixed loads. Extraction systems, compressors, pumps, lighting, heated circulation systems and control panels may run through breaks, weekends or idle shifts.
A move from two shifts to three can increase energy consumption even when output per unit remains unchanged. A baseline should therefore capture scheduled operating hours and, where possible, actual machine or line runtime.
Weather and temperature
Weather affects heating, cooling and some process loads. For UK factories, external temperature can materially influence warehouse heating, office loads, make-up air heating, curing processes and thermal losses from buildings.
Monthly weather data may suit a site-level gas baseline. Daily or half-hourly temperature data may be warranted for weather-sensitive facilities with high-quality interval meter data. The chosen weather station and method should remain consistent through the reporting period.
Heating degree days may be useful where heating demand has a clear relationship with outdoor temperature. Engineers should test that relationship rather than assume it applies to every fuel stream. Process gas for furnaces or ovens may dominate a meter, leaving weather with little explanatory power.
Static factors that require special attention
Static factors change less frequently but can alter the relationship between energy use and operating activity. Examples include:
- a new production line or major capital equipment
- a furnace rebuild or altered burner arrangement
- a factory extension or changed building area
- a permanent shift-pattern change
- a large change in product specification
- closure of a department served by shared utilities
- a new compressed-air ring main or major pressure change
ISO 50001 requires the organisation to revise the baseline where static factors change significantly or the baseline no longer represents energy performance. The energy team should record the date, technical description, affected meters and expected direction of impact. This prevents later disputes about whether a claimed saving arose from efficiency work or a permanent change in the factory.
Build a defensible baseline period and model
A baseline period must represent normal operations. For whole-facility work, 12 months of continuous utility data is commonly used because it captures seasonal conditions, holidays and the full production cycle. IPMVP Core Concepts 2022 identifies Option C for whole-facility or sub-facility measurement using utility-meter data.
A longer period may improve confidence where output is seasonal or the plant has infrequent campaigns. A shorter period may be appropriate for a tightly bounded project with stable operation, but it requires clear justification.
Exclude abnormal events carefully
A period with a prolonged outage, flood, strike, major maintenance shutdown or commissioning programme may be unrepresentative. Removing data indiscriminately can make a baseline look better than the plant’s real historic performance.
Each exclusion needs a stated reason and evidence. Retain the raw record, flag the event, test its influence on the model and document the decision. This gives reviewers visibility of the underlying operation rather than a selectively cleaned data set.
Choose the simplest model that explains performance
The calculation method should fit the energy use.
A stable assembly line may use a fixed-load-plus-production model. A batch process may need batch count, batch size and oven runtime. A process plant with heating demand may need production and outdoor temperature. For a simple fixed-load operation, a ratio such as kWh per unit can remain the clearest EnPI.
The model should be tested against historical data. Engineers should examine whether predicted consumption tracks actual consumption without systematic seasonal or production-related error. Residual plots, error statistics and review by process staff can reveal a weak model. A statistically neat relationship that conflicts with known plant behaviour deserves investigation before it enters management reporting.
Record the baseline calculation
The baseline file should state:
- The purpose and energy boundary.
- Baseline start and end dates.
- Meters, fuels and units included.
- Data sources, cleaning rules and missing-data treatment.
- Relevant variables and why each was selected.
- The calculation method and model results.
- Excluded periods and their justification.
- Static factors already present in the period.
- Review frequency, ownership and approval.
This record is as important as the final baseline figure. It allows a new energy manager, external auditor or finance reviewer to repeat the calculation.

Identify where your plant is losing energy and quantify the savings potential — our audits map every heat source, sink, and waste stream in your facility.
Calculate savings without confusing operational change with efficiency
IPMVP treats savings as the difference between baseline-period energy and reporting-period energy, adjusted for changes in conditions. For a manufacturer, the question is straightforward: how much energy would the factory reasonably have used during the reporting period if the energy conservation measure had not been introduced?
Routine adjustments
Routine adjustments account for expected variations in the selected independent variables. If production volume rises, a properly normalised baseline predicts the extra energy the plant would have used at historic performance. If winter temperatures fall, a weather-sensitive gas baseline can allow for the increased heating load.
Routine adjustments should use the relationships established in the baseline model. They should not be changed each month to obtain a preferred result.
Non-routine adjustments
Non-routine adjustments address unexpected or permanent changes outside the original baseline relationship. Installing an additional production line, changing the occupied factory area or closing an energy-intensive department can require a non-routine adjustment.
A site should maintain a change log and assign responsibility for notifying the energy manager before major changes occur. Production, maintenance, engineering and facilities teams often hold different parts of this information. The log should include commissioning dates, operating impact, metered evidence where available and the method used to quantify the adjustment.
A practical factory example
Consider a metalworking site that installs variable-speed drives on its compressed-air compressors and lowers system pressure after repairing major leaks. The site compares total compressor-house electricity before and after the work.
If production fell by 15% during the reporting period, raw electricity use cannot demonstrate the saving. The project team needs to compare actual reporting energy with the energy predicted by the baseline model at the reporting period’s production volume, operating hours and other applicable variables. If a new compressor was also installed to meet capacity growth, that permanent equipment change needs separate treatment.
The same discipline applies to combustion tuning, insulation upgrades and heat-recovery projects. Savings claims need an explicit measurement boundary, relevant operating variables and records of changes that affect demand.
Align the baseline with ISO 50001, ESOS and investment decisions
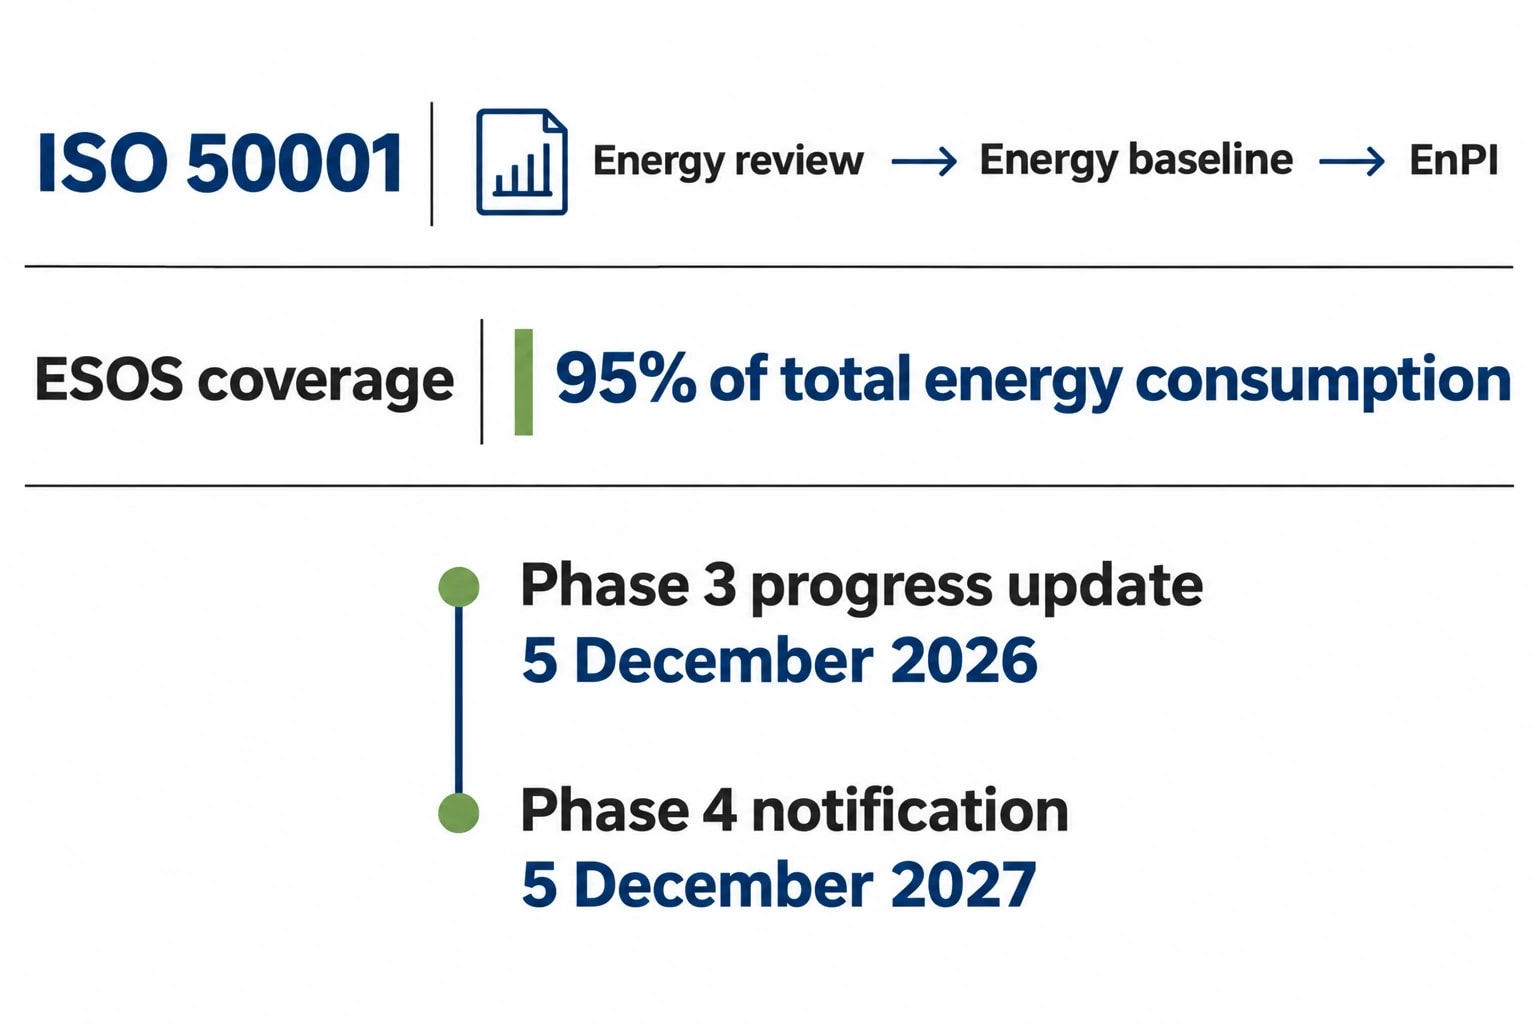
A well-maintained baseline supports more than certification. It provides a common reference for audits, carbon-reduction plans and capital approval.
ISO 50001 energy review requirements
ISO 50001:2018 requires the energy review to analyse energy use and consumption, identify significant energy uses and identify variables affecting those uses. The baseline and EnPIs turn that review into ongoing performance measurement.
At management review, an energy team should present performance against the baseline alongside explanations for material variances. A rising EnPI may point to compressed-air leakage, poor burner performance, degraded insulation, unplanned standby loads or changed production conditions. The baseline provides an investigative starting point. It does not replace engineering diagnosis.
ESOS Phase 4 evidence
The Energy Savings Opportunity Scheme Regulations 2014, most recently amended by the Energy Savings Opportunity Scheme (Amendment) Regulations 2026, require eligible UK organisations to assess energy used in buildings, industrial processes and transport. Areas of significant energy consumption must account for at least 95% of total energy consumption.
For Phase 4, the notification of compliance deadline is 5 December 2027. Organisations that participated in Phase 3 have a second annual progress update due by 5 December 2026 in relation to their action plan.
A defensible energy baseline helps a site quantify measures identified through an ESOS audit and report progress against action-plan commitments. It also separates implemented savings from changes in output or business activity, improving board-level reporting.
Connecting audits to a usable baseline
EnerTherm Engineering’s seven-step audit methodology can provide the field evidence needed for an industrial baseline. Initial consultation defines production and compliance objectives. On-site assessment then tests the site’s data against physical operation using instrumentation such as power analysers, ultrasonic leak detectors and thermal imaging.
That work can identify whether an apparent baseline change reflects energy waste or a changed operating condition. Examples include:
- ultrasonic surveys that quantify compressed-air leakage and support pre- and post-repair demand measurement
- load profiling that identifies motors operating at low load or during non-production periods
- power analysis that separates high-demand production events from base load
- combustion checks that identify excess-air or control issues affecting fuel use
- thermal imaging that highlights insulation defects and abnormal heat loss
The completed baseline should feed directly into ranked energy conservation measures. Each measure needs a stated energy-saving estimate, carbon impact, capital requirement, implementation risk, measurement approach and financial case. Payback periods can aid screening, while net present value and internal rate of return provide a stronger basis for larger investments with multi-year benefits.
Keep the baseline useful after it is approved
A baseline loses value when it becomes an annual spreadsheet exercise. Manufacturing conditions change continuously, so energy teams need a defined review routine.
Monthly review and annual validation
Monthly review should compare actual energy with the normalised expectation, flag unusual variance and connect it to production, maintenance and weather records. This can identify waste quickly, especially overnight electrical base load, compressor demand outside production hours and unexpected fuel use.
Annual validation should test whether the baseline still represents the site. The review should ask whether the energy boundary changed, whether relevant variables remain valid, whether model accuracy has degraded and whether any static factor requires a revised baseline.
Establish clear ownership
Facilities teams may manage invoices and utilities. Production teams own output data. Maintenance teams understand equipment changes. Sustainability leads may report carbon results. ISO 50001 works best when one named owner governs the baseline process and each data source has an accountable contributor.
This article reflects the independent analysis and editorial opinion of EnerTherm Engineering. Product names, trademarks, and brands mentioned belong to their respective owners. EnerTherm Engineering is not affiliated with, endorsed by, or a licensee of any third-party software or product mentioned unless explicitly stated.

Managing Director — EnerTherm Engineering
Dr. François Pierrel is Managing Director of EnerTherm Engineering with over two decades of expertise in thermal design, heat transfer, and industrial energy optimisation. He holds a PhD in Heat Transfer from Cranfield University and a Post-Doctorate from Heriot-Watt University.
