IPMVP Energy Verification Framework: Four Routes to Savings
A practical explanation of adjusted baseline comparisons for ESOS Phase 4 reporting
The IPMVP energy verification framework measures and verifies energy savings by comparing energy use before and after an efficiency project, adjusted for changed operating conditions.
A factory cannot meter energy it did not use. It can meter electricity, gas, steam, compressed air and production output. It can then establish what consumption would reasonably have been without the project and compare that adjusted baseline with post-project consumption. That distinction turns a projected saving into evidence for a capital-approval paper, an ESOS report or an ISO 50001 energy-performance review.
Efficiency Valuation Organisation’s IPMVP Core Concepts 2022 sets out four option families: A and B for retrofit isolation, C for whole-facility measurement, and D for calibrated simulation. The right route depends on the measure, available data, process variability and required certainty.
Why IPMVP energy savings verification matters in manufacturing
Industrial projects often produce a calculated saving at the audit stage. A compressor replacement may have a quoted kW reduction. A variable-speed drive may have a predicted annual kWh benefit. Furnace insulation may have a heat-loss estimate. These are useful engineering estimates, but they do not prove the result when a site changes shift patterns, production mix, throughput or ambient conditions.
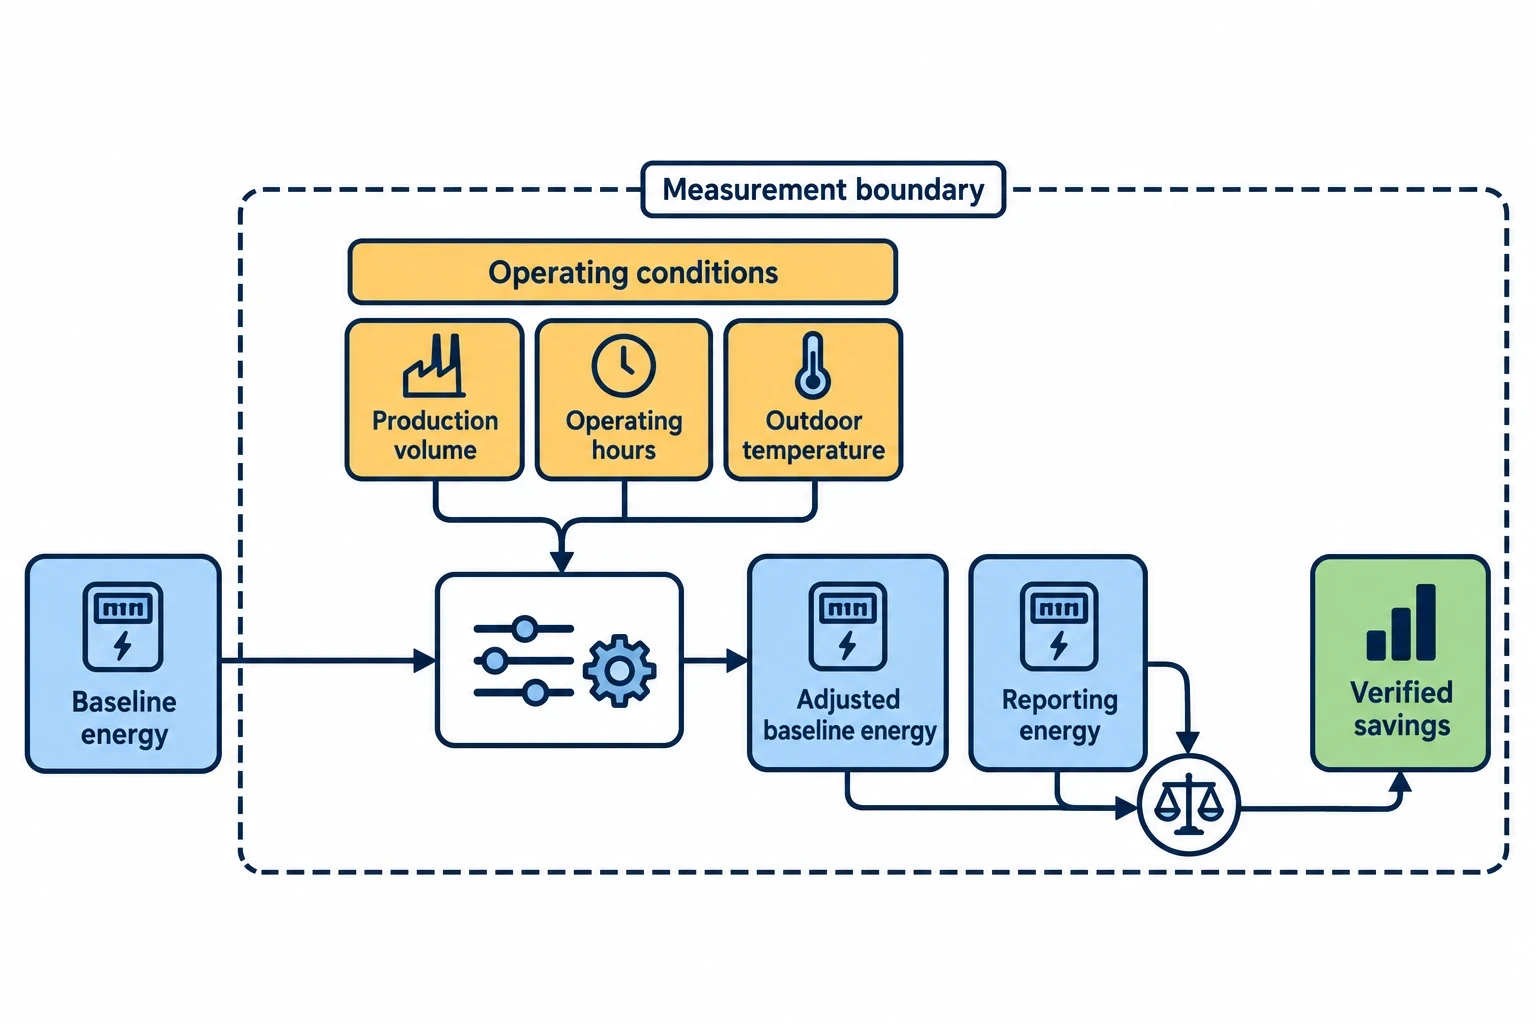
IPMVP closes the gap between design intent and operating performance. It requires a defined measurement boundary, baseline period, reporting period, adjustment method and documented approach to uncertainty.
Savings are determined, not directly measured
An energy-efficiency measure changes consumption within a chosen boundary. The verifier compares baseline-period energy with reporting-period energy after accounting for factors that influence demand.
Typical independent variables in a manufacturing setting include:
- Production volume, tonnes processed or units assembled
- Product type, grade or recipe
- Operating hours and shift patterns
- Outdoor temperature for space-heating or cooling loads
- Compressed-air demand and pressure setpoint
- Material moisture content, where it affects drying energy
- Steam load, process temperature or batch count
A plastics moulding site, for example, may install variable-speed control on chilled-water pumps. It must separate energy changes caused by the drive from those caused by production hours, mould temperatures and new machine installations. A credible verification plan records these conditions before commissioning rather than reconstructing them months later.
Measurement and verification supports investment discipline
A verified result gives finance teams a clearer view of project performance. It can also reveal commissioning issues that an invoice comparison would miss, such as a compressor running unloaded, a drive operating in hand mode or insulation removed during maintenance.
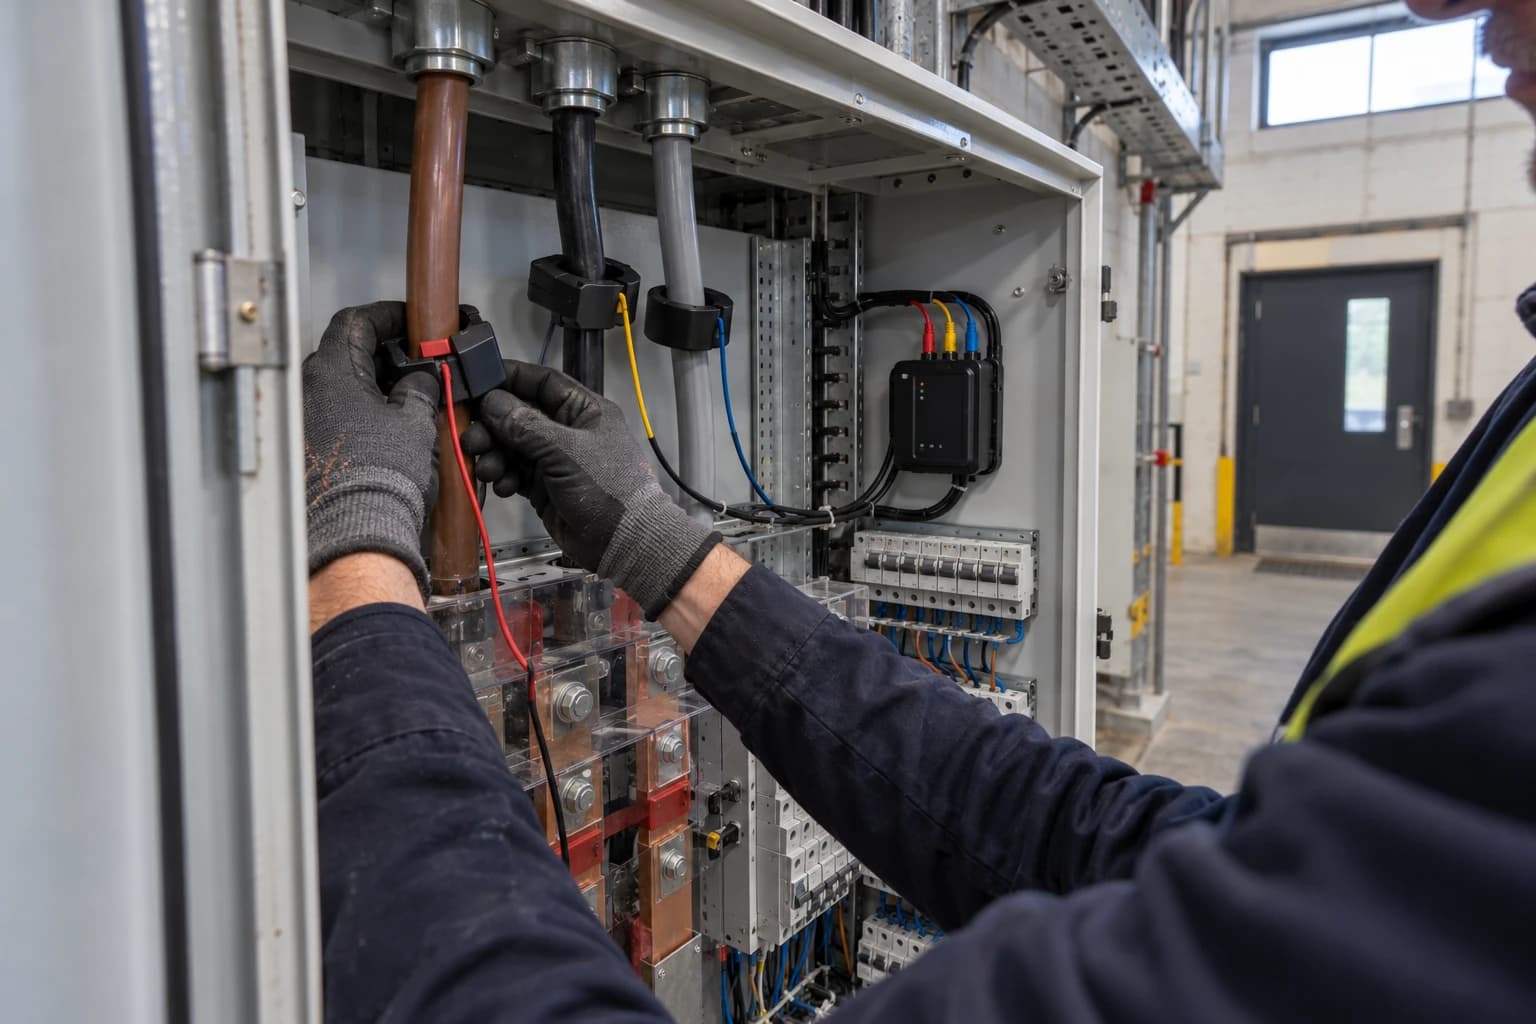
For EnerTherm Engineering’s audit methodology, M&V should follow naturally from the on-site assessment. Power analysers can profile electrical loads, ultrasonic instruments can identify compressed-air leakage, and thermal imaging can support insulation and combustion assessments. The measurements should inform both the energy-conservation measure and its verification method.

Identify where your plant is losing energy and quantify the savings potential — our audits map every heat source, sink, and waste stream in your facility.
The four IPMVP routes to energy savings
The IPMVP options are not a hierarchy of quality. Each has a suitable application. An overly elaborate metering programme can consume the value of a small project, while a low-cost approach based on unjustified assumptions can undermine a major investment case.
| IPMVP option | Measurement boundary | Main method | Suitable industrial application |
|---|---|---|---|
| Option A | Retrofit isolation | Measure key parameter(s), estimate justified remaining values | Fixed-speed motor replacement, lighting upgrade, stable-duty equipment |
| Option B | Retrofit isolation | Measure all relevant energy or demand parameters | VSDs, variable-load motors, compressor controls, process equipment |
| Option C | Whole facility or major section | Analyse supply-meter data against independent variables | Multiple interacting measures, site energy programmes |
| Option D | Whole facility or system | Calibrated physical simulation | New construction, major expansion, unavailable baseline data |
Option A: retrofit isolation with key parameter measurement
Option A measures the parameter or parameters with the greatest effect on the savings calculation and estimates the remainder. Estimates must be documented, technically justified and acceptable in terms of their contribution to uncertainty.
For a motor replacement with stable operating hours, a site may measure electrical demand before and after replacement while using a verified schedule to estimate annual run hours. For an LED retrofit, the connected load may be measured while operating hours are derived from production schedules or time-switch settings.
Option A suits measures where one factor dominates the calculation and unmeasured values remain stable. It is less suitable where operating hours, load or process conditions fluctuate materially.
The central risk is the estimate. An assumed annual run time can distort the verified result more than a precise power measurement can improve it. The M&V plan should state the source of each estimate, its plausible range and its effect on reported savings.
Option B: retrofit isolation with all parameter measurement
Option B uses field measurement of the energy, demand or validated proxy variables relevant to the affected system. It is appropriate for measures with variable load, operating hours or several consumption drivers.
A compressed-air project illustrates the distinction. Replacing a constant-speed compressor with a variable-speed compressor may affect compressor kW, delivered airflow, system pressure and unloaded running. Option B can meter the compressor supply and record pressure, flow or production-related demand through the baseline and reporting periods. It can then identify whether savings persist as production conditions change.
Motor-drive optimisation also suits Option B. A power analyser can measure electrical demand at the motor control centre, while process data records pump speed, flow, pressure or throughput. The installation team can verify that the variable-speed drive is commissioned correctly and that operators have not reverted to fixed-speed bypass operation.
Option B usually requires more meters, a clear sampling strategy and meter-accuracy checks. This produces stronger evidence where operational variation is significant, as well as operational data for maintenance and performance management after the reporting period.
Option C whole-facility M&V for multiple measures
Option C uses utility meters, whole-facility meters or major-section sub-meters to evaluate collective energy performance. It is useful where measures interact or where isolating each item would be impractical.
A metals plant might combine compressed-air leak reduction, furnace combustion tuning, motor controls and lighting changes within one programme. A whole-site electricity and gas assessment can show the collective result, provided expected savings are large enough to stand out from normal variation.
Build a defensible baseline model
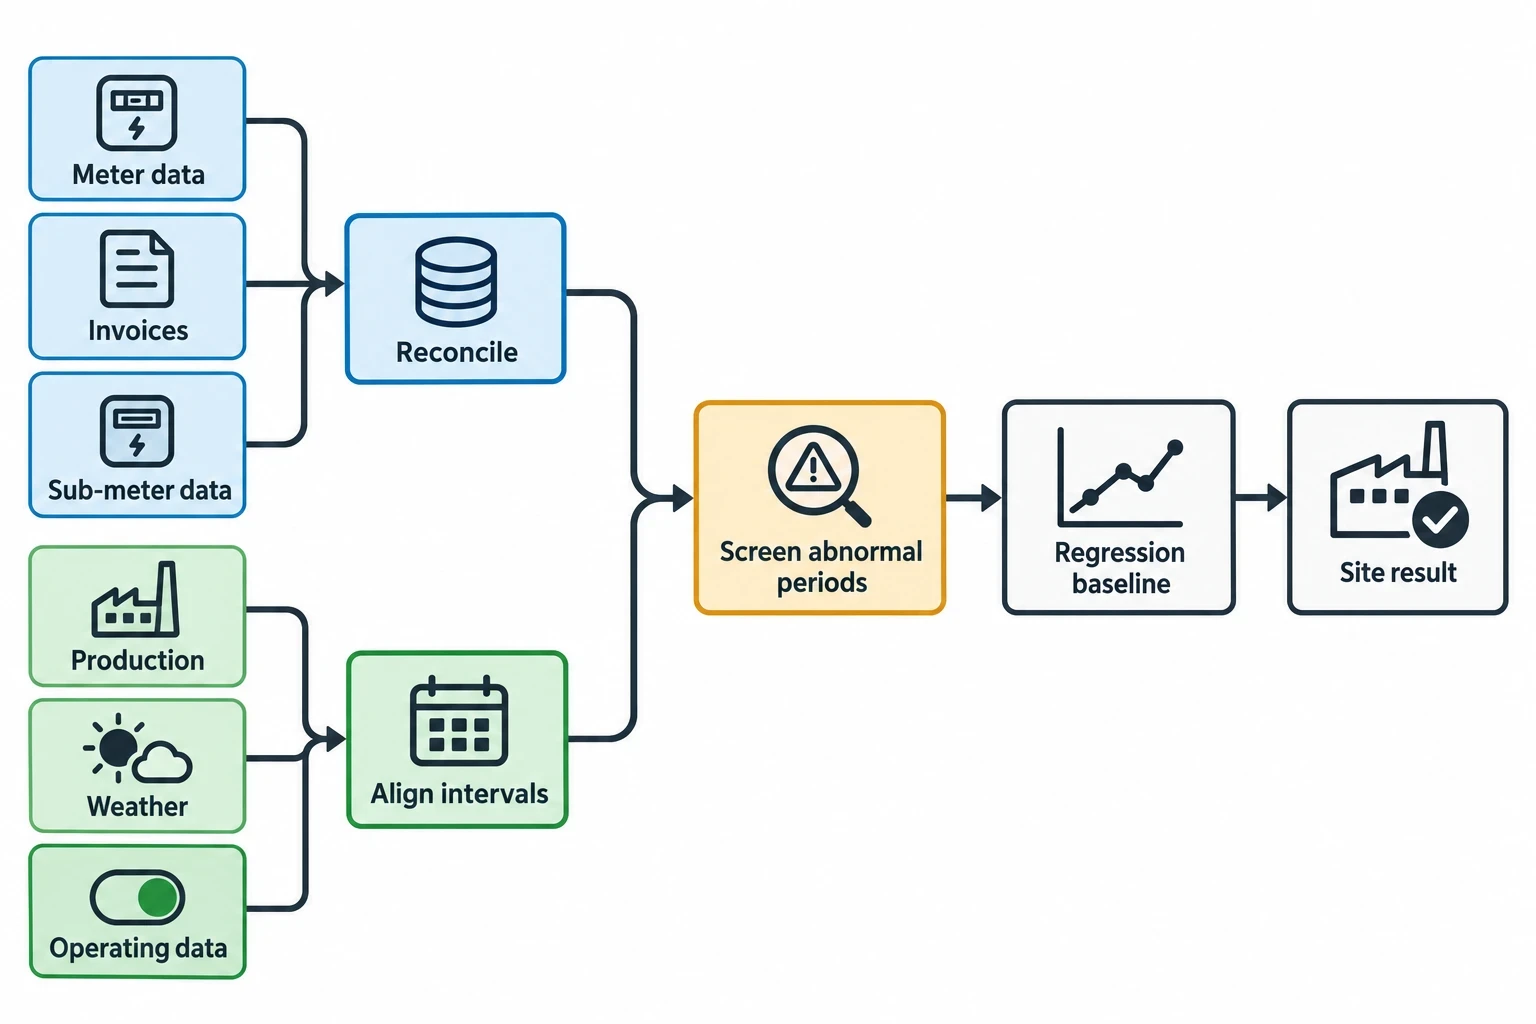
Option C commonly uses regression analysis to relate energy consumption to independent variables. The model may use monthly, daily or interval data, depending on the measure, available metering and rate of variation.
A good industrial baseline starts with data quality:
- Reconcile meter readings, invoices and sub-meter data.
- Identify estimated utility bills and gaps in interval data.
- Record production, weather and operating data for the same intervals as the energy data.
- Separate abnormal shutdowns, major maintenance events and commissioning periods.
- Check whether the model is applied within the range of baseline operating conditions.
Production-normalised energy use can be useful, but a simple kWh-per-unit figure does not replace a documented baseline. Product mix, reject rates, start-up losses and changes in material specification can make a ratio appear better or worse without reflecting the measure’s performance.
Account for changes in conditions
IPMVP distinguishes between routine and non-routine adjustments.
Routine adjustments address expected, regularly changing factors. Weather correction for a heated assembly area and normal production-volume adjustment are familiar examples. The M&V plan should identify the relevant independent variables before implementation and specify how they will be measured.
Non-routine adjustments address unexpected changes that materially affect energy use within the boundary. Examples include a new production line, extended weekend operation, changed furnace duty, additional warehouse space or a permanent change to compressed-air pressure requirements.
These changes need disciplined change control. A production manager, maintenance lead and energy manager should agree who records changes, what threshold triggers review and how the baseline will be adjusted. Without this record, a whole-facility result can incorrectly attribute energy growth or reduction to the project.
Recognise the limits of Option C
Option C gives a site-level answer. It does not prove the contribution of each individual measure. Savings reported under the method can include the effects of unrelated operational changes within the boundary.
It works best when:
- Savings are substantial relative to natural energy variation
- Regular meter data is available
- There is a reasonable relationship between energy use and known drivers
- Future site changes can be tracked
- The project needs a collective site-performance result
For a minor motor change at a variable manufacturing site, Option C may bury the saving in production noise. Retrofit isolation can then provide better evidence with lower analytical risk.

Identify where your plant is losing energy and quantify the savings potential — our audits map every heat source, sink, and waste stream in your facility.
Option D calibrated simulation where a baseline is absent
Option D uses a calibrated simulation model of a facility, process or system. It is appropriate where baseline data is unavailable or unreliable, including new construction and separately assessed expansions.
A new manufacturing building may have no historic gas or electricity profile. A calibrated model can represent proposed process loads, ventilation, heating, cooling and operating conditions. Post-completion energy and operational data can then calibrate the model.
Simulation needs engineering evidence
Option D is not a desktop estimate. The model must represent the physical systems within the measurement boundary and use documented assumptions. Calibration may draw on meter data, operating schedules, process temperatures, material flows, measured efficiencies and production records.
For an industrial thermal project, the model may require data on:
- Burner efficiency and excess-air settings
- Furnace or oven duty cycles
- Product throughput and inlet conditions
- Surface temperatures and insulation condition
- Exhaust temperature and heat-recovery arrangement
- Operating hours and batch profile
The model should capture a sufficient range of process conditions. A calibration period during a factory ramp-up may not represent stable production. The M&V plan should define the data to be collected, calibration period, model version control and calibration acceptance criteria.
Where Option D adds value
Option D can evaluate individual measures in a large project where interactions make Options A and B costly. It can also assess a facility expansion where the original site meter covers both old and new loads.
The approach demands experienced modellers and clear quality assurance. Poor input data or undocumented assumptions can create a precise-looking answer with weak evidential value. For many established plants, existing meters and targeted retrofit isolation provide a simpler verification route.
Building an IPMVP M&V plan before implementation
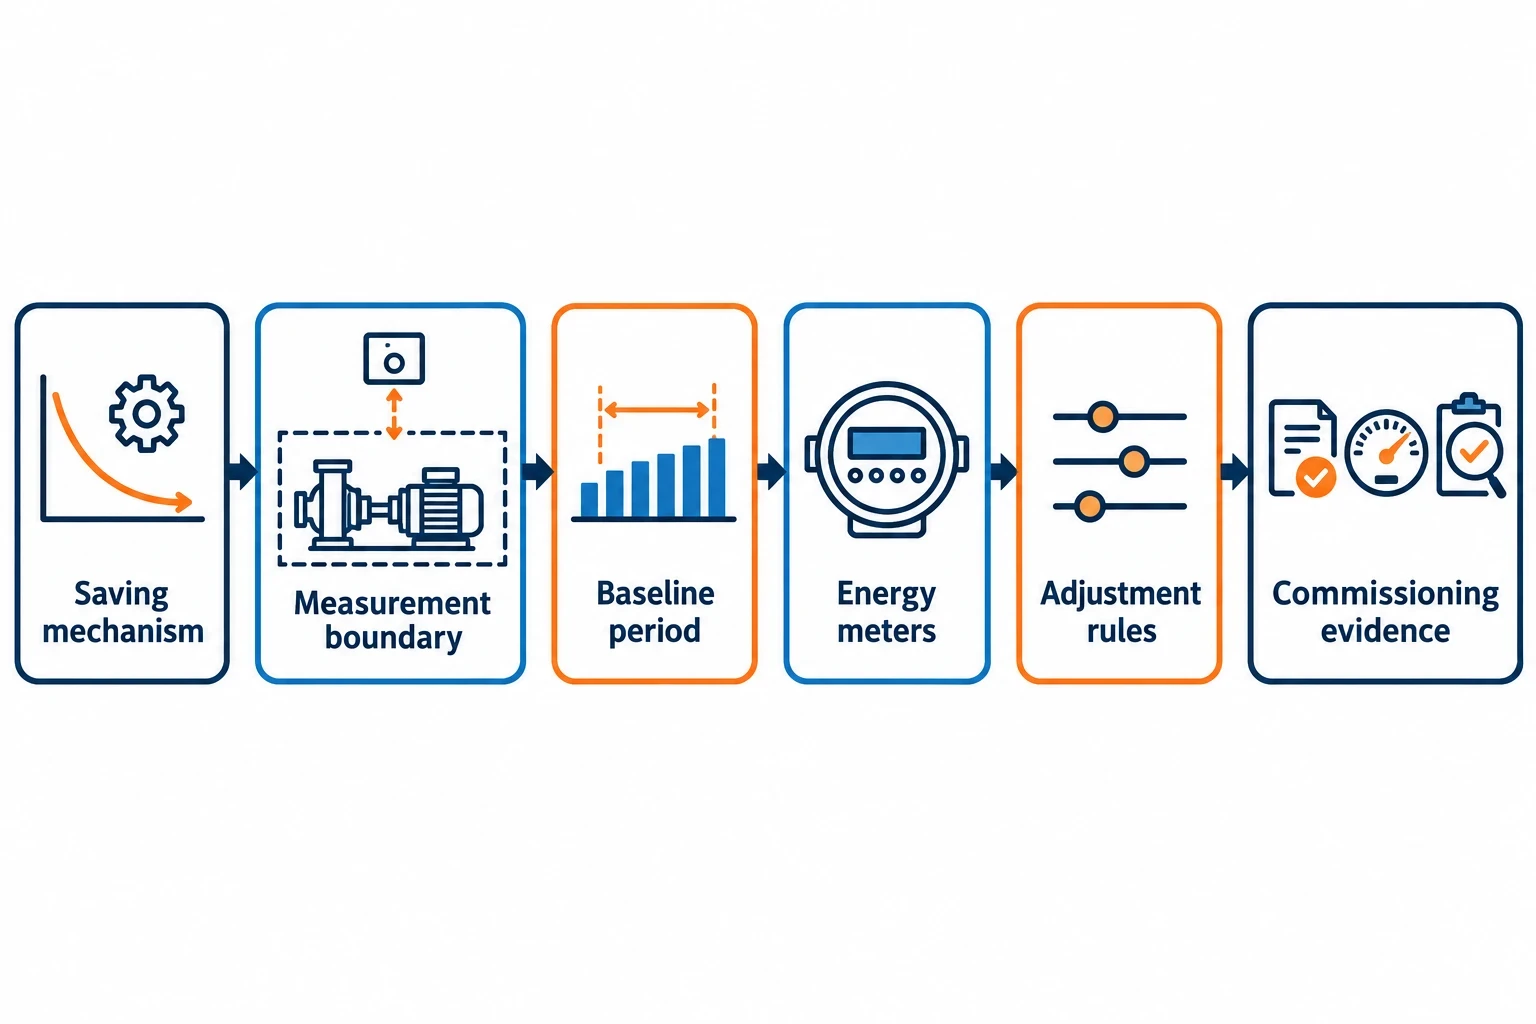
An M&V plan should be agreed before equipment is ordered or installed. It protects the project against retrospective disputes over baseline dates, data gaps and adjustment methods.
Core contents of an industrial M&V plan
A practical plan should include:
- Project description and intended energy-saving mechanism
- Selected IPMVP option and measurement boundary
- Baseline period, reporting period and data intervals
- Energy sources, meters, instruments and accuracy requirements
- Independent variables and data owners
- Routine and non-routine adjustment rules
- Assumptions, estimates and uncertainty sources
- Commissioning and operational-verification activities
- Calculation method, report format and review responsibilities
- Rules for missing data, meter faults and production shutdowns
The measurement boundary needs particular care. A variable-speed drive fitted to a pump may reduce electrical demand at the motor but increase a related control load elsewhere. A combustion-tuning project may reduce fuel use while changing fan power. The boundary should include material interactive effects or document their treatment.
Commissioning is part of verification
M&V does not replace commissioning. It confirms that installation and operation match the saving mechanism described in the investment case.
For compressed-air projects, this may include leak-repair records, pressure-setpoint checks and compressor-control sequencing. For motor drives, it may include rotation tests, control logic, bypass status and load profiles. For thermal measures, it may include burner-tuning records, flue-gas measurements, insulation inspection and process-temperature trends.
This evidence allows the energy manager to distinguish between a measure that failed to commission correctly and one that performed as designed under changed production conditions.
ESOS Phase 4, ISO 50001 and verified savings
The Energy Savings Opportunity Scheme Regulations 2014, as amended in 2026, place greater emphasis on implemented measures and achieved savings. ESOS Phase 4 participants must report details of measures implemented to achieve savings, the level of savings achieved by each measure and each measure’s energy-saving category. The Phase 4 compliance-notification deadline is 5 December 2027.
An IPMVP-based plan gives a manufacturing organisation a repeatable method for documenting achieved-savings evidence. It does not replace the ESOS assessment or reporting requirements, but creates an auditable route from identified opportunity to post-installation result.
Fit verification into ISO 50001
ISO 50001:2018 remains the current edition of the energy management standard. Its focus on energy performance, energy baselines and energy performance indicators aligns with disciplined M&V.
Manufacturers can assign an M&V route to significant energy projects during the energy review, then carry the resulting data into performance evaluation and management review. This creates a chain from audit finding to approved capital measure, commissioned asset, verified saving and revised carbon-reduction roadmap.
For projects with a financial case, the verified energy result should feed back into the investment record. That allows NPV, IRR and payback assumptions to be tested against operational reality. A site that knows which measures delivered under which production conditions can direct capital towards repeatable results rather than headline estimates.
This article reflects the independent analysis and editorial opinion of EnerTherm Engineering. Product names, trademarks, and brands mentioned belong to their respective owners. EnerTherm Engineering is not affiliated with, endorsed by, or a licensee of any third-party software or product mentioned unless explicitly stated.

Managing Director — EnerTherm Engineering
Dr. François Pierrel is Managing Director of EnerTherm Engineering with over two decades of expertise in thermal design, heat transfer, and industrial energy optimisation. He holds a PhD in Heat Transfer from Cranfield University and a Post-Doctorate from Heriot-Watt University.
