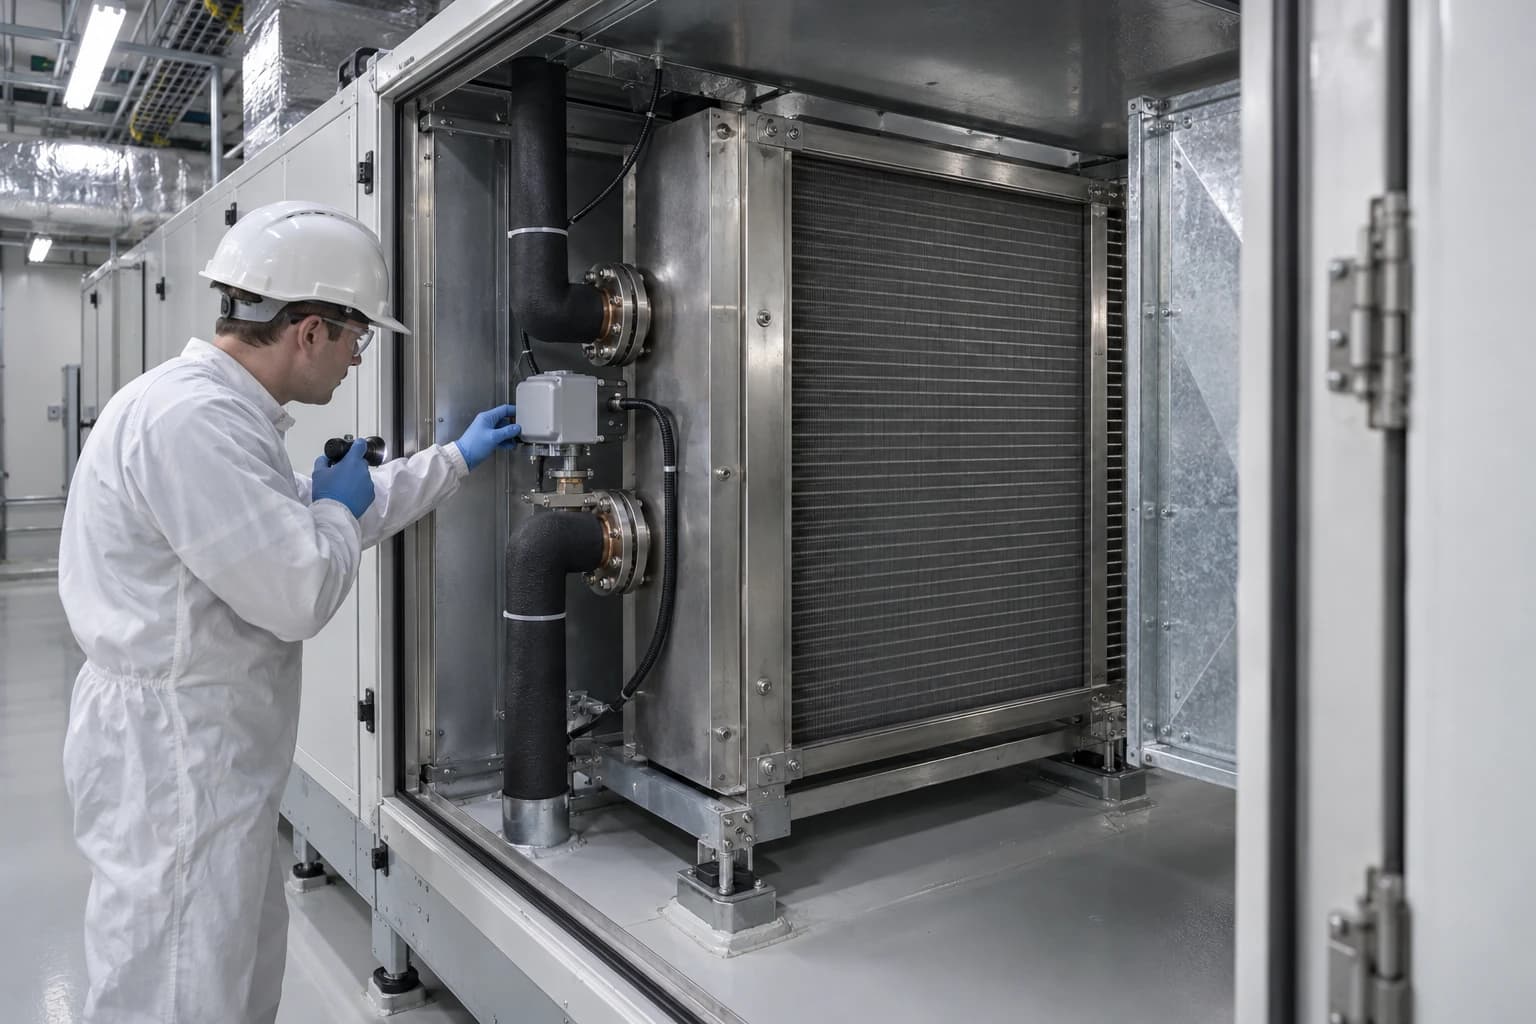
Predictive Analytics for Pharmaceutical Cleanroom HVAC Drift
How advisory, read-only AI flags HVAC anomalies while preserving GMP validation status.
Predictive analytics for pharmaceutical manufacturing uses live and historical operating data to identify developing deviations in equipment performance before defined cleanroom environmental limits are affected.
A supply fan drawing more power at unchanged airflow can be an early warning. So can a chilled-water valve that remains further open than normal, widening room-pressure variation after routine door activity, or a longer return to stable conditions following a changeover. Each signal may sit within an individual alarm limit, but their combined pattern can indicate HVAC drift.
For pharmaceutical operations managers, process engineers and Quality Assurance leads, the aim is early, evidence-based intervention. Engineers can inspect a filter, actuator, coil, sensor or damper while maintenance remains planned. Quality teams retain the established environmental-monitoring programme and its alert and action limits. The predictive model provides a separate analytical warning that system behaviour has changed.

Omni Vision delivers turnkey utility metering, CO2 tracking, and AI-powered production KPI intelligence — giving you real-time dashboards and actionable insights across your entire facility.
Why cleanroom HVAC drift matters in pharmaceutical manufacturing
Cleanroom HVAC protects controlled conditions while consuming significant electrical and thermal energy. Air-handling units maintain supply airflow, room-pressure cascades, temperature, humidity and filtration performance. Chillers, boilers, humidifiers, pumps and extract systems support the same environmental objective.
EU GMP Annex 1 treats contamination control as a system-wide responsibility. The environmental-monitoring programme must reflect the process, room classification, qualification data and routine operating evidence. Sites must establish alert levels and action limits for particle and microbiological monitoring, then trend excursions and deterioration.
HVAC degradation often develops before a particle or differential-pressure result reaches its site-defined limit. A conventional building-management alarm answers a narrow question: has the current value crossed a configured threshold? Predictive analytics tests whether several values still behave as expected under prevailing operating conditions.
Drift is a relationship problem
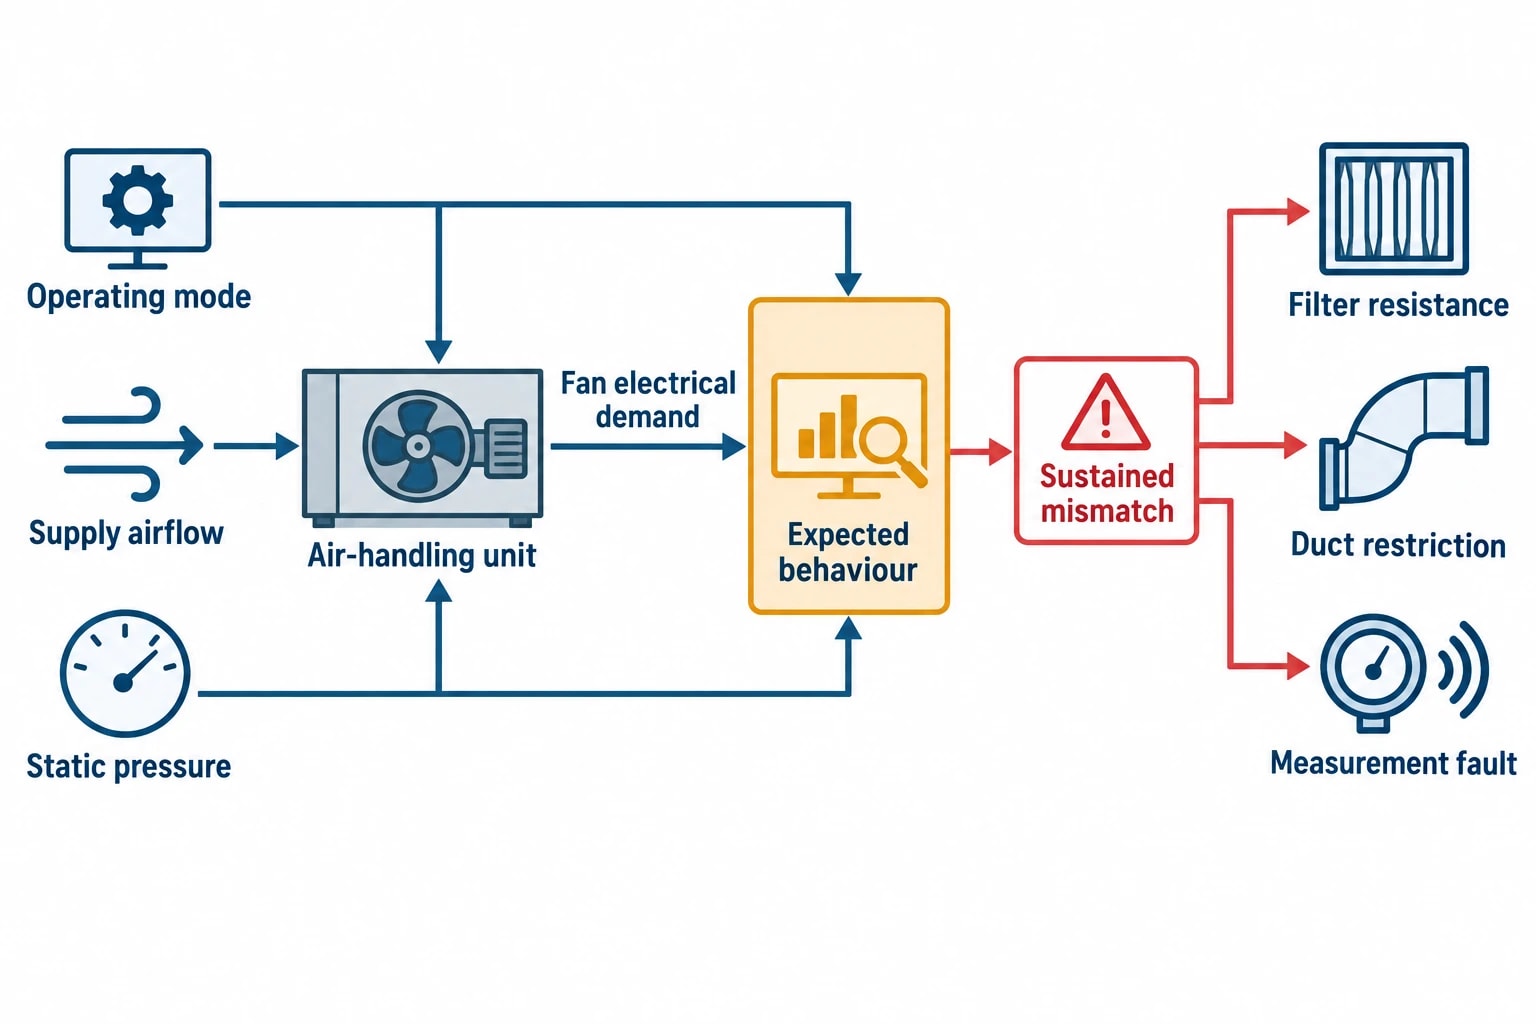
An air-handling unit should not be judged by fan speed alone. Fan electrical demand rises when airflow rises. Cooling-valve demand rises with outdoor temperature and humidity. Pressure response changes with room use and door openings.
The analytical task is to test the relationship between these signals. Examples include:
- Fan power relative to measured supply airflow and static pressure.
- Supply-air temperature relative to chilled-water valve position, coil entering-water temperature and outside-air condition.
- Room-pressure recovery time after documented door-opening events.
- Heating or humidification energy relative to air volume, ambient moisture and operating mode.
- Extract and supply-air balance relative to the approved pressure cascade.
A sustained change in one relationship can indicate a physical or control problem. A fan operating at higher speed with unchanged airflow may indicate increasing resistance from filters, duct restrictions or a measurement issue. A cooling valve driven open while supply-air temperature rises may warrant investigation of chilled-water flow, coil condition, valve authority or sensor accuracy.
Production context prevents false alarms
A useful forecast separates expected operational variation from abnormal behaviour. Batch activities, cleaning, maintenance, occupancy, weather and shutdown states all change HVAC demand.
Models should classify operating periods before scoring them. A supply-fan forecast trained during stable production should not assess a post-cleaning recovery period as routine production. Similarly, a cleanroom suite in reduced-hours operation needs a separate baseline from one operating through a full production campaign.
This segmentation gives engineering teams a clearer alert: abnormal fan energy during the same operating mode, at similar airflow and outdoor conditions. That is more actionable than a generic notification of high electricity consumption.
Building a cleanroom HVAC forecasting baseline
The model begins with known-good operating history, not an arbitrary annual average. The training period should exclude commissioning activity, confirmed sensor faults, major maintenance work, unusual campaigns and documented environmental incidents. Including these events normalises poor performance and weakens future detection.
Select signals that explain HVAC behaviour
The data set should include enough variables to distinguish load from loss of performance. For a cleanroom air-handling unit, this normally includes electrical power, fan speed, airflow, duct static pressure, supply and return-air temperatures, valve positions, room differential pressure and selected outdoor-air measurements.
The required measurement set depends on the fault question. A fan-energy model can operate with fan power, airflow and static pressure. A cooling-performance model also needs water-side temperatures, valve command and supply-air temperature. A model without relevant signals cannot distinguish a fouled coil from a shift in production heat load.
| Analytical question | Core variables | Likely investigation path |
|---|---|---|
| Is fan energy rising at comparable duty? | Fan kW, airflow, fan speed, static pressure | Filter loading, duct resistance, fan condition, sensor error |
| Is cooling response degrading? | Supply-air temperature, valve position, chilled-water temperatures, airflow | Coil fouling, low water flow, valve fault, sensor drift |
| Is pressure control becoming unstable? | Differential pressure, supply and extract airflow, door-event records | Supply-extract imbalance, actuator issue, leakage, room-use change |
| Is recovery taking longer? | Event timestamp, room pressure, airflow, damper and fan response | Control-loop tuning, door discipline, airflow capacity, obstruction |
For forecasting, a multivariable regression model provides a transparent starting point. It estimates expected fan power or thermal demand from operating context. More complex machine-learning models may improve accuracy where the relationship is nonlinear, but a pharmaceutical site still needs an explanation of which variables influenced the result and how the alert rule operates.
Score the residual, not the raw meter value
The useful measurement is the residual: the difference between actual consumption or performance and the model’s forecast for that operating condition. A 20 kW fan load may be normal at high airflow and abnormal at low airflow. Residual analysis resolves that distinction.
Each residual should be standardised using variation observed during the accepted baseline period. This allows engineering teams to compare different parameters on one scale and apply a consistent escalation method.
A forecast must also be checked against held-out historical periods before operational use. Teams should inspect error by operating mode, season and production state. A model that performs well in mild weather but poorly during humid summer conditions will create unreliable humidity-control alerts.

Track energy consumption, emissions, and process parameters with seamless PLC/SCADA integration via Modbus, OPC-UA, and MQTT protocols.
Quantitative methods for identifying HVAC drift
Cleanroom HVAC drift is gradual. Individual high or low readings can result from a door event, short control response or temporary production load. Statistical process-control methods distinguish this noise from a sustained shift.
Use three complementary alert rules
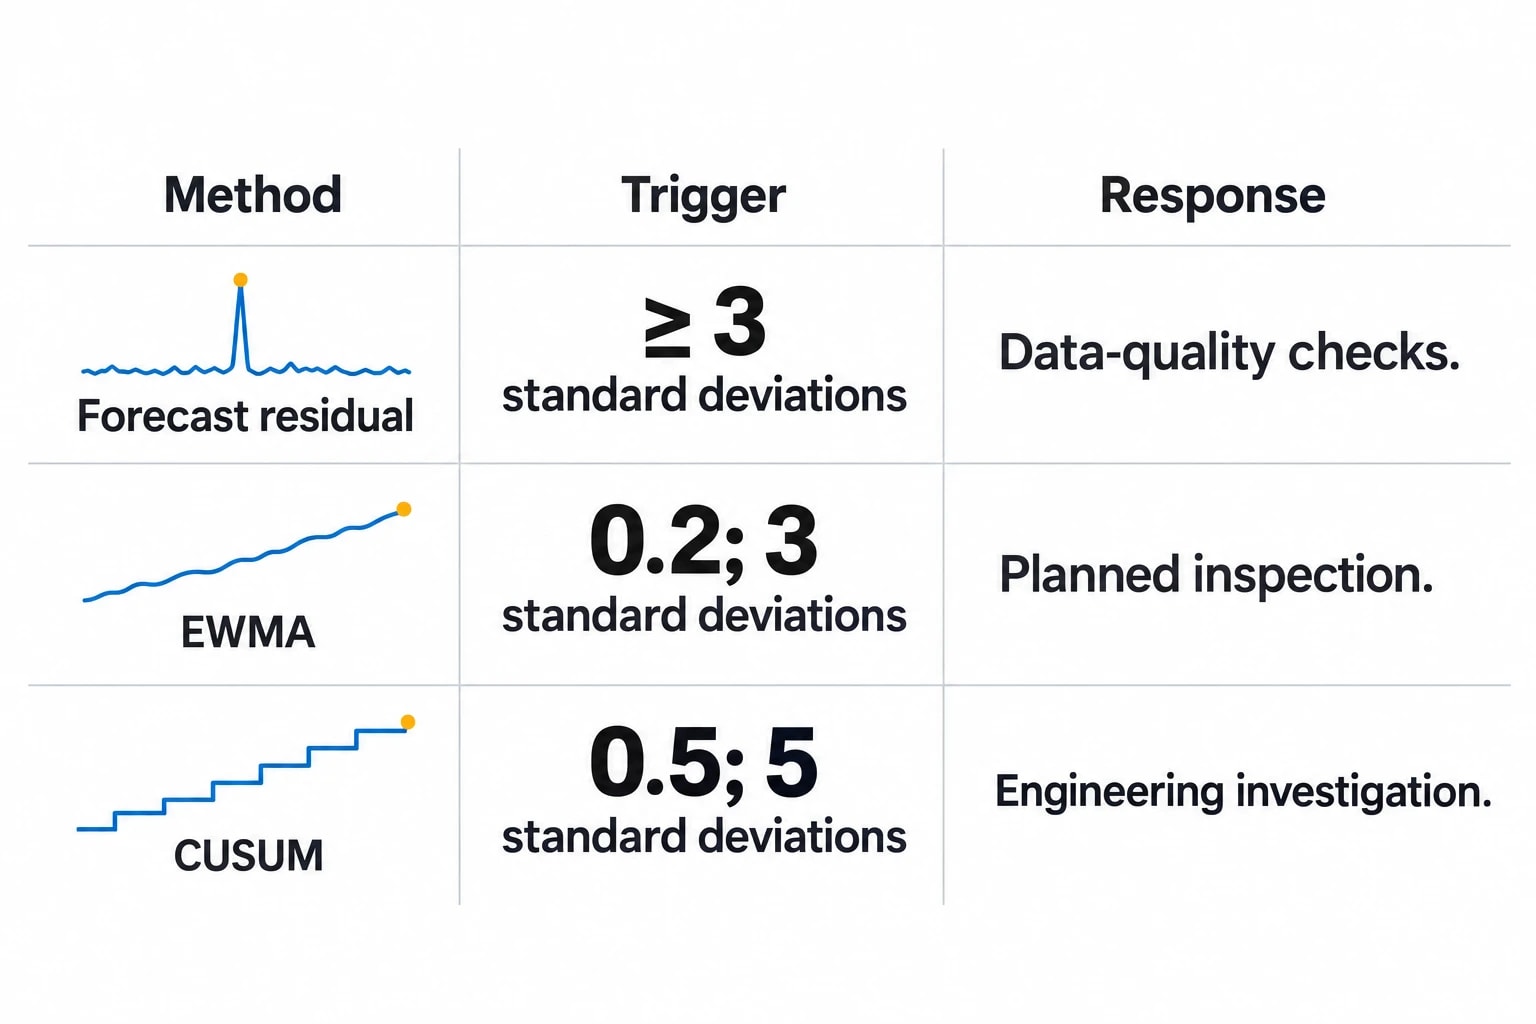
A practical programme can combine forecast residuals with exponentially weighted moving average, or EWMA, and cumulative sum, or CUSUM, control charts. The rules below are established statistical starting points, not universal GMP limits. The site should document and approve parameters against its equipment, sampling interval and false-alert tolerance.
| Method | Quantitative rule | What it detects | Escalation use |
|---|---|---|---|
| Forecast residual | Absolute standardised residual of 3 or more | A single substantial departure from expected behaviour | Engineering review after data-quality checks |
| EWMA chart | Weighting factor of 0.2 and control limits at 3 standard deviations | Small, persistent movement in a mean value | Planned inspection when the EWMA crosses its control limit |
| CUSUM chart | Reference value of 0.5 standard deviations and decision interval of 5 standard deviations | Sustained shift of about 1 standard deviation | Investigate developing degradation even if no individual point is extreme |
The National Institute of Standards and Technology describes EWMA charts as suitable for detecting small shifts. A weighting factor between 0.2 and 0.3 is commonly used for this purpose. CUSUM also detects persistent changes: its reference value and decision interval can be selected against the shift of interest and the site’s intended false-alarm performance.
For example, a fan-power forecast sampled every 15 minutes may produce a one-off residual beyond 3 standard deviations after an unusual door event or sensor glitch. The alert should first confirm data quality and operating state. If the EWMA subsequently crosses its 3-standard-deviation limit, or the CUSUM reaches its decision interval, the evidence supports a planned engineering investigation.
Separate statistical alerts from GMP environmental limits
A model threshold is an analytical trigger. It does not replace a cleanroom’s qualified environmental limits, particle limits, viable-monitoring limits or pressure-differential criteria.
EU GMP Annex 1 requires a site to define its monitoring approach, alert levels and action limits from qualification and routine operating data. It also requires assessment and follow-up after alert-level excursions, and root-cause investigation and product-impact assessment after action-limit excursions.
The two systems should remain distinct:
- A forecast anomaly identifies a change in HVAC behaviour that merits engineering assessment.
- A GMP environmental alert or action-limit excursion follows the site’s approved monitoring and quality procedures.
- A confirmed relationship between predictive alerts and environmental outcomes can strengthen maintenance planning, but does not change established environmental limits without formal assessment.
This prevents treating a statistically unusual energy pattern as proof of an environmental failure, or normal energy use as proof of environmental control.
Applying ASHRAE Guideline 36 to anomaly detection
ASHRAE Guideline 36-2024 provides high-performance sequences of operation intended to improve HVAC efficiency, performance, control stability and real-time fault detection and diagnostics. It gives teams a disciplined reference for expected equipment behaviour.
In a cleanroom, the sequence cannot be adopted without considering the facility’s contamination-control strategy, qualified operating ranges and pressure-cascade design. The guideline can, however, define relationships that analytics can monitor.
Test behaviour against the intended sequence
A model should compare actual operating trends with the approved sequence for the air-handling unit. Useful examples include:
- Fan-speed response to static-pressure demand.
- Supply-air temperature response to cooling or heating-valve movement.
- Damper movement during observed occupied, reduced-operation and recovery modes.
- Simultaneous heating and cooling signals.
- Excessive movement between operating states.
- Repeated failure to reach a selected supply-air or pressure-control condition within the approved response time.
ASHRAE Guideline 36 includes automatic fault-detection and diagnostic concepts for air-handling units. Its logic applies time delays to avoid reporting transient conditions as faults. Predictive analytics can extend that principle by assessing cumulative evidence in fan, coil, damper and pressure data.
Focus on repeatable fault signatures
An actionable anomaly needs a fault signature, not a broad label such as “HVAC inefficiency”. Consider a supply-air temperature deviation combined with a cooling valve held near its upper operating range, rising chilled-water temperature difference and stable airflow. That cluster narrows the engineering investigation towards water-side flow, coil performance, valve operation or temperature measurement.
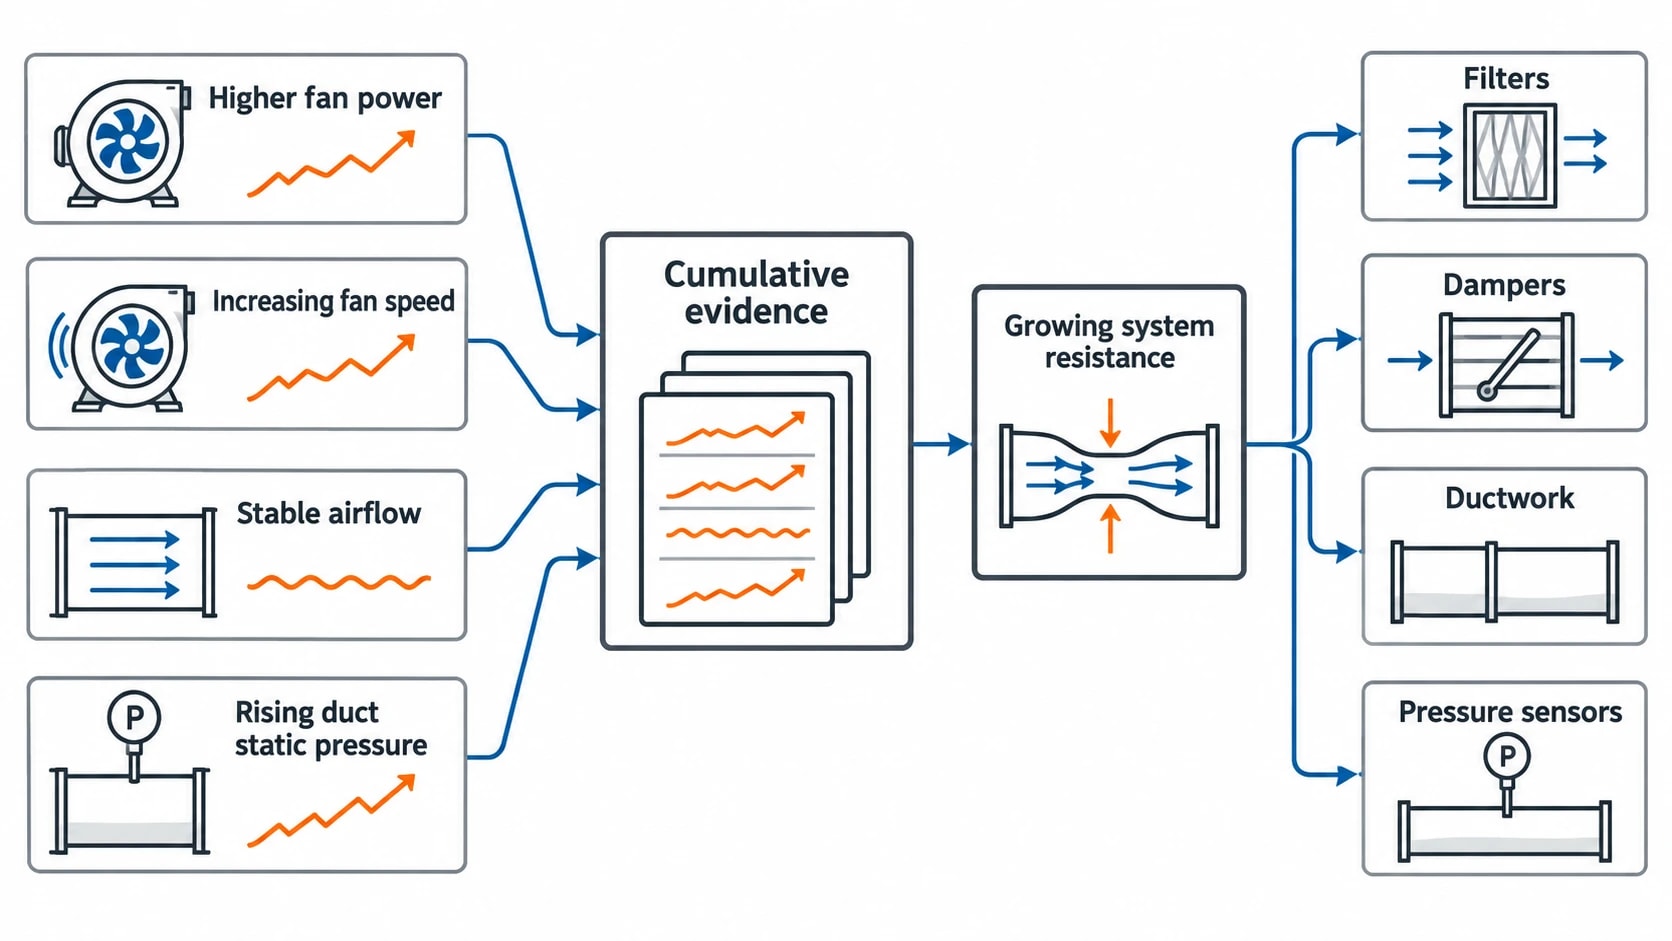
Likewise, higher fan power, increasing fan speed, stable airflow and rising duct static pressure point towards growing system resistance. An engineer can then inspect filters, dampers, ductwork and pressure sensors in a planned order.
The model does not diagnose root cause by itself. It ranks evidence and directs attention to the HVAC relationship that changed.
Predictive energy forecasting and ISO 50001:2018
ISO 50001:2018 requires a structured energy management system and identifies Energy Performance Indicators, or EnPIs, as measures of energy performance. Clause 9.1 addresses monitoring, measurement, analysis and evaluation. It requires organisations to decide what they will monitor and measure, how valid results will be obtained, when analysis will occur and how outcomes will be evaluated.
Predictive analytics can support this work where a cleanroom HVAC EnPI has a defensible operating context.
Set EnPIs that reflect HVAC duty
Whole-site electricity consumption is useful for financial reporting but too broad for diagnosing cleanroom drift. More useful EnPIs include:
- Fan electricity per unit of measured airflow for a defined air-handling unit.
- Heating, cooling or humidification energy by approved operating mode.
- Air-handling-unit electricity per operating hour, adjusted for airflow and weather.
- Forecast-versus-actual HVAC energy for a cleanroom suite.
- Pressure-recovery duration following defined operational events.
- Number of validated statistical drift alerts per asset and operating hour.
The forecast residual becomes an EnPI support measure. It shows whether consumption differs from the expected value after adjusting for operating conditions. Repeated positive residuals can expose waste from control instability, fouling or mechanical degradation before a monthly energy review.
Make the review auditable
For Clause 9.1 purposes, the important output is not a dashboard alone. Teams need to retain the EnPI definition, source measurements, baseline period, forecast method, alert parameters, review records, investigation outcome and verified post-maintenance performance.
A completed maintenance loop gives the data operational value. The model identifies a sustained deviation, engineering confirms a cause, the site performs approved work, and the same EnPI verifies whether expected performance returned. If the residual does not return towards baseline, the investigation continues.
This article reflects the independent analysis and editorial opinion of EnerTherm Engineering. Product names, trademarks, and brands mentioned belong to their respective owners. EnerTherm Engineering is not affiliated with, endorsed by, or a licensee of any third-party software or product mentioned unless explicitly stated.

Technical Manager — EnerTherm Engineering
John Naranjo is Technical Manager at EnerTherm Engineering, bringing specialist expertise in chemical and environmental engineering. He recently led the implementation of Omni Vision, EnerTherm's real-time energy and utility monitoring platform. He holds an MSc in Environmental Engineering from the University of Huelva and a BSc in Chemical Engineering, with memberships in both the Energy Institute and IChemE.
