
How PFD Stream Tables Expose Heat Loss in Dairies
A validated dairy PFD tracks 72°C for 15 seconds with heat, steam and rework.
A PFD stream table is an engineering record that assigns flow, temperature, pressure, composition and energy data to each product, utility and waste stream in a dairy process. The Food Standards Agency gives 72°C for 15 seconds as an example time-temperature combination for continuous-flow milk pasteurisation.
A dairy pasteuriser can achieve that validated temperature and holding time while consuming more steam than the process requires. Extra demand can arise when regeneration performance falls, condensate bypasses recovery, a hot-water loop has no receiving duty, or a diverted product route sits outside the original process flow diagram.
A process-flow diagram (PFD) optimisation exercise makes these conditions measurable. The PFD identifies the physical route. Its embedded stream table provides the numbers needed to reconcile heat entering, moving through and leaving that route. It also keeps energy work tied to the HACCP controls that govern pasteurisation, product routing and hygienic separation.

Map every energy and material flow in your process with detailed heat and mass balance calculations — the foundation for any optimisation or design project.
Why heat loss hides in dairy production routes
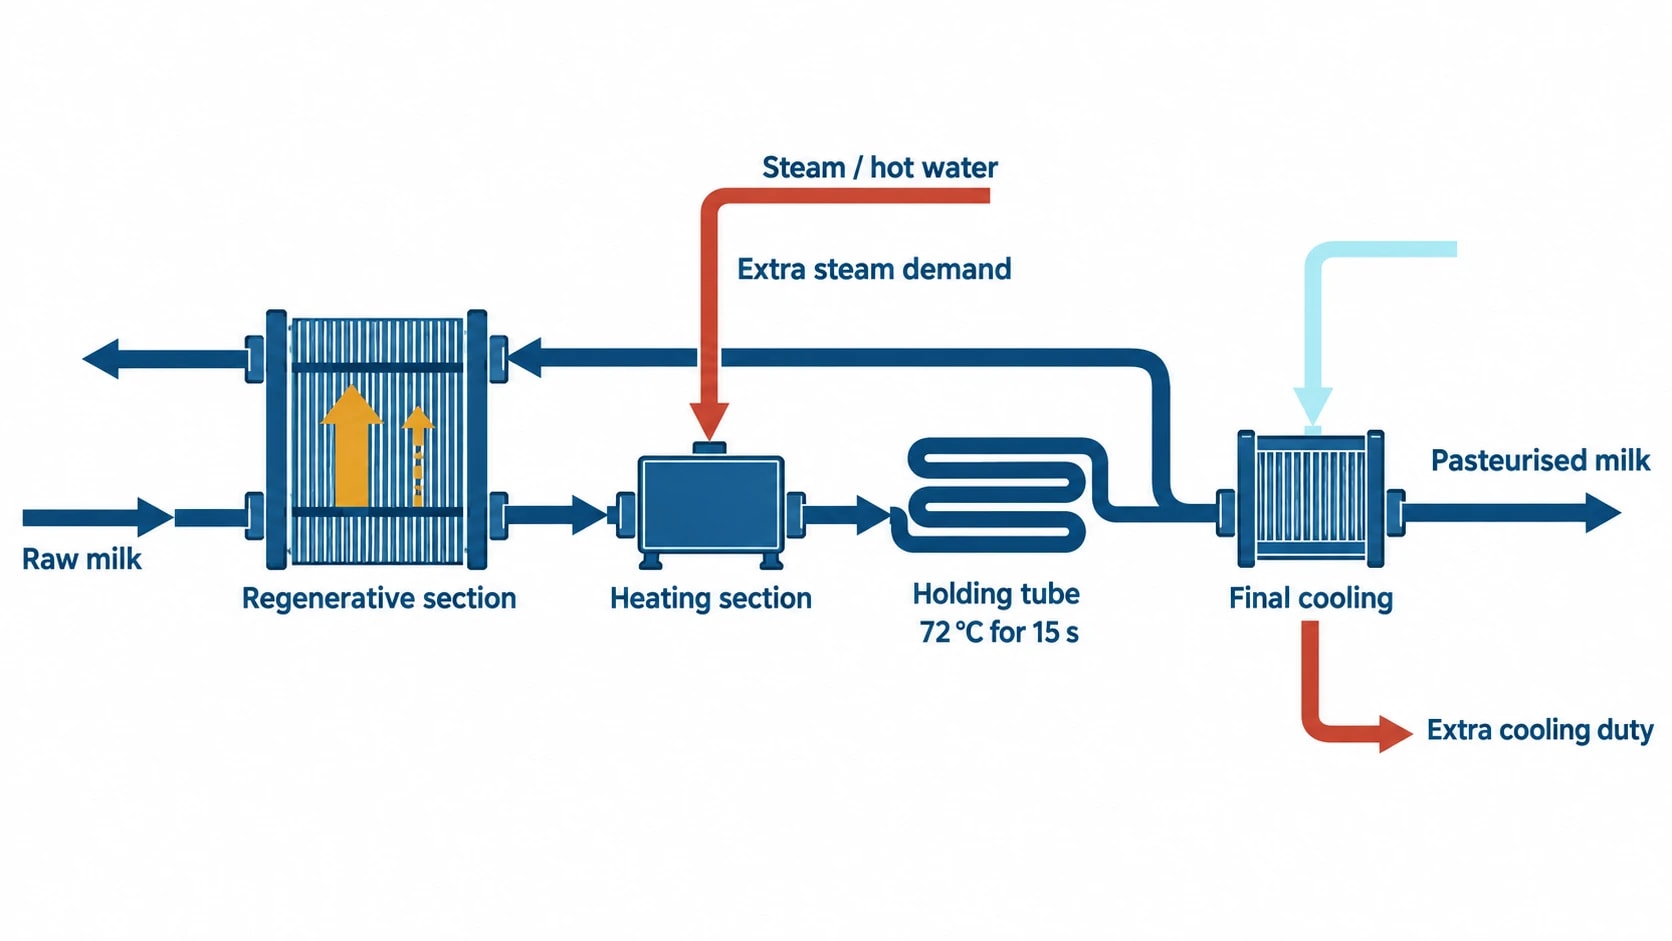
Dairy factories move heat between raw milk, standardised milk, cream, whey, chilled water, hot water, steam, condensate and cleaning-in-place circuits. Equipment can appear to run correctly while the wider process consumes avoidable utility energy.
A high-temperature short-time pasteuriser provides a clear example. Cold incoming milk receives heat from outgoing pasteurised milk in the regenerative section. The heating section supplies the remaining duty needed to meet the validated outlet temperature. If regeneration performance declines, the final heater compensates by drawing more steam or hot water. Production continues, but steam use rises and the final cooling section removes more heat.
The same pattern appears in less obvious streams:
- Diverted product returns to a balance tank at a temperature different from normal feed.
- A lower production rate changes plate heat exchanger performance.
- A water flush carries residual product and sensible heat towards effluent.
- Condensate reaches drain rather than the return system.
- A CIP return contains recoverable heat but lacks a suitable, hygienically separated receiving duty.
- One utility system rejects heat while another produces it with steam.
A line diagram alone cannot quantify these issues. A stream table turns the PFD into a heat and mass balance. It lets engineers compare process conditions across normal production, changeover, divert, rework and cleaning.
What a dairy PFD stream table should contain
Set the study boundary before gathering data
For a liquid-milk line, the process boundary may run from raw-milk reception through separation, standardisation, homogenisation, pasteurisation, cooling, filling and cold storage. The utility boundary should include steam supply, condensate return, hot-water loops, chilled water, cooling water, CIP supply and CIP return.
A narrow boundary can produce the wrong conclusion. A large chilled-water duty after pasteurisation may appear to be the principal energy issue, while product temperatures show that poor regeneration upstream has forced extra heating and subsequent cooling. The PFD stream table exposes both sides of that cycle.
The table should also identify operating states. A stable run at maximum throughput rarely represents the full annual utility load.
| Operating state | Stream-table requirement | Reason for inclusion |
|---|---|---|
| Normal production | Product and utility flow, temperatures, pressures | Establishes the baseline balance |
| Start-up and warm-up | Duration, utility use, product destination | Captures heat supplied before stable production |
| Product changeover | Flush-water volume, temperature and route | Identifies product, water and heat sent to recovery or effluent |
| Divert and recirculation | Flow, temperature, duration and return point | Protects pasteurisation traceability |
| Rework addition | Mass, temperature, composition and timing | Maintains yield and thermal accounting |
| CIP and rinsing | Supply and return temperatures, flow and destination | Identifies heat-recovery opportunities and hygiene constraints |
Tag every process and utility stream
Each stream needs a unique tag shared by the PFD, table, historian extract, field data sheet and project calculations. That link prevents a common failure in energy studies: a spreadsheet figure that cannot be traced to a pipe, valve or operating condition.
For liquid streams, useful fields include stream description, product type, mass or volumetric flow, temperature, pressure, solids or fat content where relevant, destination, operating state, data source and timestamp. The table should distinguish measured values from calculated values, engineering assumptions and data awaiting confirmation.
Steam and condensate need the same discipline. A utility stream labelled only as “steam to pasteuriser” cannot support a loss assessment. The corresponding records should identify supply pressure, metered flow, condensate temperature, return pressure, receiver destination and any discharge route.
Put the pasteurisation CCP in the stream table
The critical control point should appear explicitly on the PFD and in the stream table. The product stream at the pasteuriser outlet should record the validated temperature, holding-tube residence time, flow rate and diversion route.
The Food Standards Agency states that critical limits must be measurable and monitored. Temperature and time therefore belong alongside energy data, rather than in a separate quality file with different assumptions about operating rate.
| Stream | Service | Key data to record | Control purpose |
|---|---|---|---|
| P-101 | Standardised milk to regeneration | Flow, inlet and outlet temperature, solids | Regeneration balance |
| P-102 | Pasteurised milk from regeneration | Flow, inlet and outlet temperature | Cooling and recovery balance |
| P-103 | Diverted product | Flow, temperature, duration, return point | Product-routing record |
| U-101 | Steam to final heater | Flow, supply pressure, condensate condition | Heating-duty reconciliation |
| U-102 | Condensate return | Flow, temperature, pressure, destination | Recovery assessment |
| U-103 | Chilled water | Flow and supply-return temperatures | Cooling-duty confirmation |

Map every energy and material flow in your process with detailed heat and mass balance calculations — the foundation for any optimisation or design project.
How PFD stream tables identify heat loss
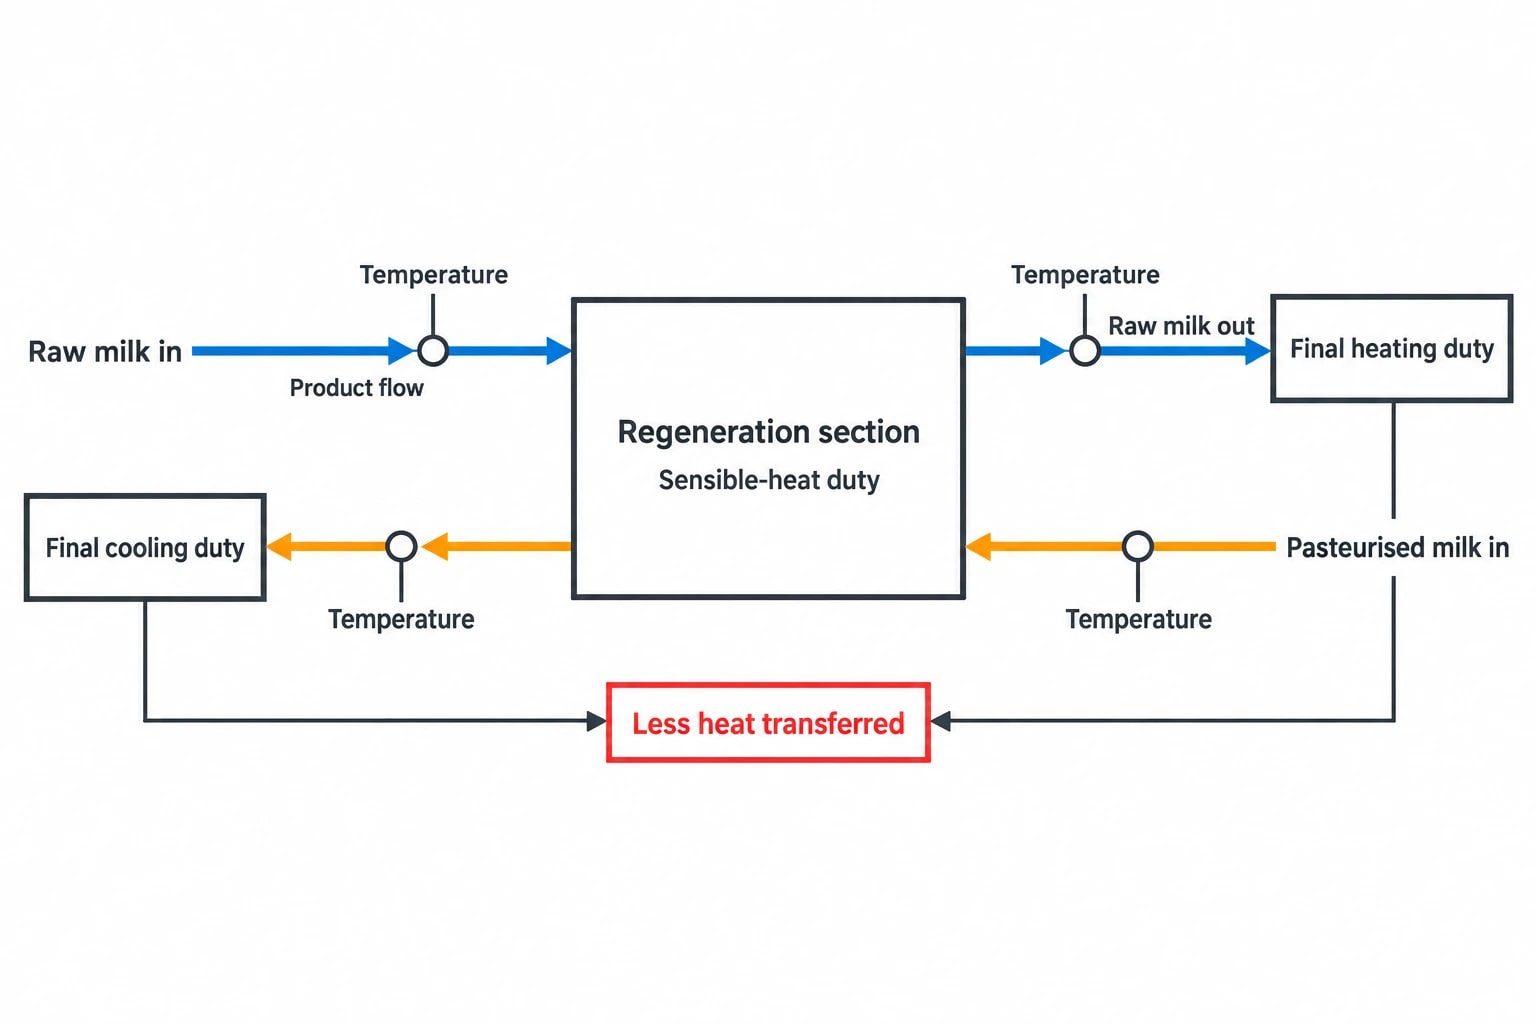
Measure pasteuriser regeneration performance
A regeneration review begins with four product temperatures:
- Raw milk entering regeneration.
- Raw milk leaving regeneration.
- Pasteurised milk entering regeneration.
- Pasteurised milk leaving regeneration.
The table should pair these readings with synchronised product flow and operating state. A lower raw-milk outlet temperature increases final heating duty. A higher pasteurised-milk outlet temperature increases final cooling duty. Together, these readings indicate that less heat is transferring between the product streams.
Engineers can calculate sensible-heat duty from measured product flow and temperature change, using product properties appropriate to the milk, cream or dairy blend under review. The assessment should compare the calculated duty with the metered steam or hot-water duty over the same interval.
The PFD stream table narrows the next investigation. Plate fouling, altered flow balance, bypass leakage, control-valve behaviour, product composition and low throughput can affect regeneration. The table identifies the thermal mismatch and the operating condition in which it occurs.
Use a defined energy-balance acceptance test for effluent streams
Warm effluent can represent lost useful energy, but temperature alone is insufficient evidence for a recovery project. The stream table should record flow, temperature, duration, contamination category, destination and the availability of a receiving duty.
A practical acceptance method is a time-aligned sensible-heat-duty calculation for the source stream and its proposed heat sink. The engineering team should set a site-specific minimum recoverable-duty threshold, a minimum overlap period between source and sink, and an uncertainty limit for supporting flow and temperature measurements. Those thresholds belong in the project basis of design.
This avoids vague labels such as “high-temperature drain”. A 50°C drain with substantial, sustained flow and an available clean-water preheat duty may merit action. A hotter intermittent stream with no compatible sink may not.
The PFD must also show product flushes, first rinse, final rinse, separator discharge, whey, permeate and condensate. Changeover routes matter because they can carry product, water and heat away from the intended recovery path.
Reconcile steam, flash steam and condensate
The utility side of the PFD should extend beyond the pasteuriser heating section through the control valve, heat exchanger, condensate outlet, steam trap, return main, receiver and boiler-house interface.
Flash steam forms when high-pressure condensate enters a lower-pressure system. The UK Energy Technology List identifies condensate and flash steam as recoverable energy sources where suitable heat exchangers, receiving duties and controls are in place.
A condensate opportunity should be assessed through a metered condensate-return ratio and an energy-balance closure test. The site should define the expected condensate mass return for each operating mode, based on measured steam use and known intentional losses such as start-up venting. It should also set an action limit that reflects meter uncertainty and operating variability.
The following PFD conditions deserve investigation when they breach that agreed acceptance basis:
- Condensate sent to drain.
- Return mass below the site-defined condensate-return action limit.
- Steam-trap discharge inconsistent with the site’s trap-survey acceptance criteria.
- Flash steam vented while a coincident approved heat sink exists.
- Steam-heated water produced while a separate process rejects recoverable heat.
- Insulation defects identified during the site’s thermal survey programme.
PFD optimisation must preserve HACCP controls
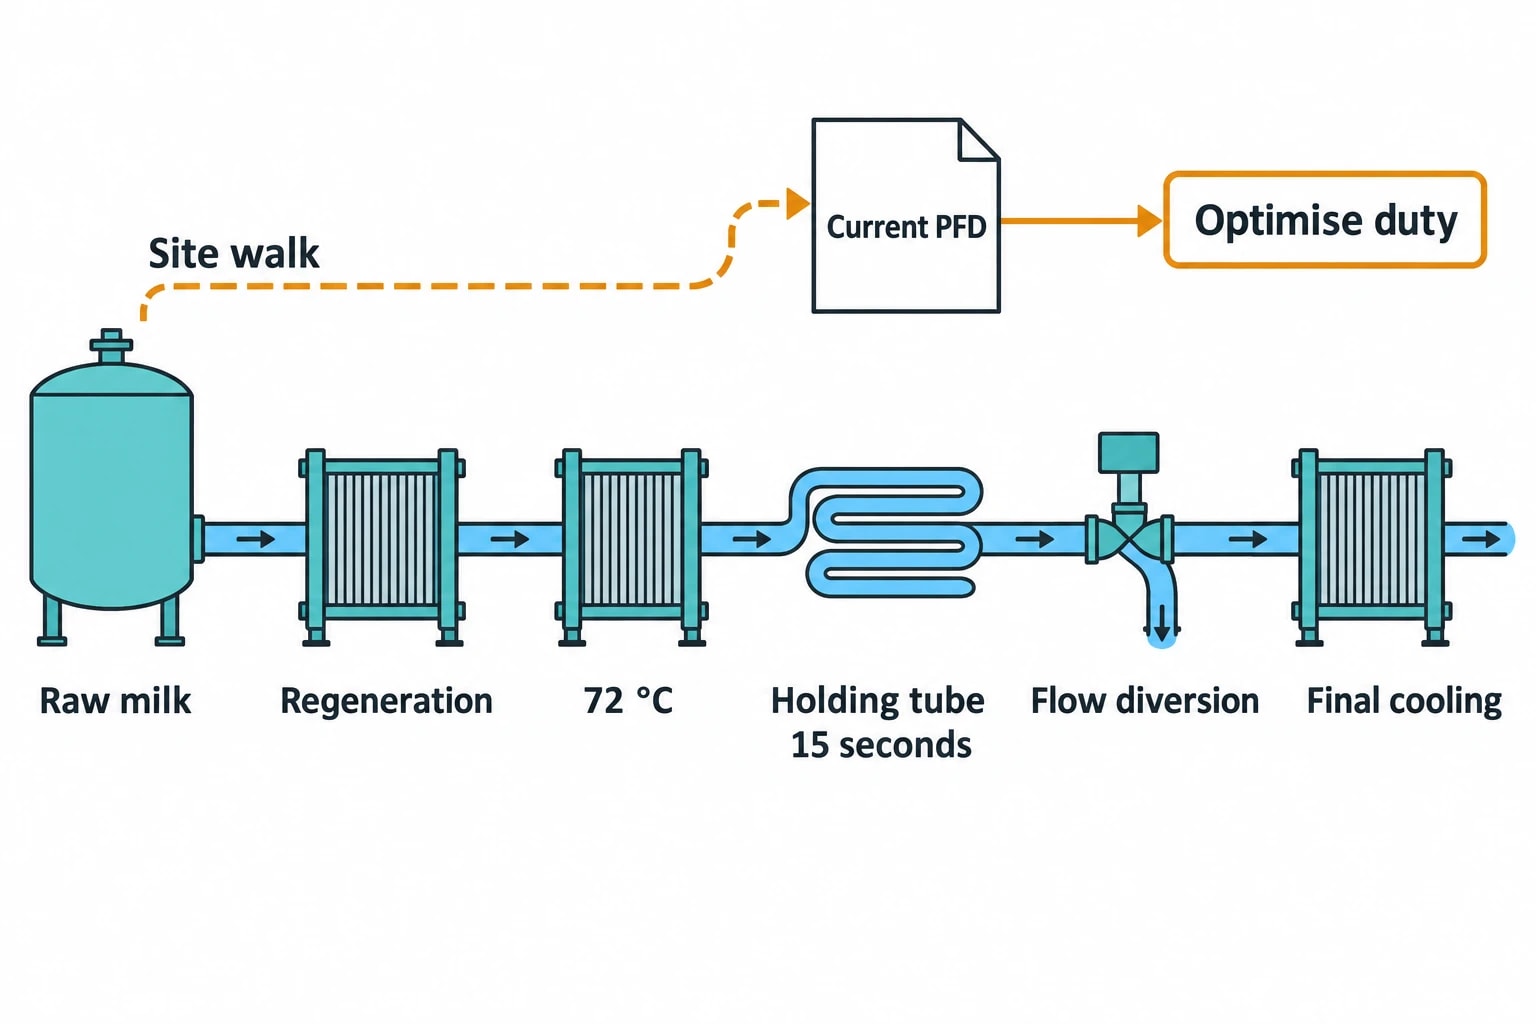
Validate the flow diagram on the factory floor
Regulation (EC) No 852/2004 requires food business operators to put in place, implement and maintain permanent procedures based on HACCP principles. The Food Standards Agency advises teams to walk the production route and confirm that the flow diagram includes all inputs, intended delays, shift variations, rework and by-products.
That validation supports loss analysis. A site walk can expose temporary hoses, manual transfers, alternate return routes, drain connections, unmetered utility branches and diverter positions absent from historic drawings.
The review team should include process engineering, operations, quality, maintenance, utilities and cleaning specialists. The objective is one current, dated PFD that reflects actual operation.
Keep energy targets outside the CCP decision
A PFD optimisation project must retain the validated pasteurisation basis. Engineers should assess reductions in avoidable duty around the process while keeping the critical temperature, holding time, flow basis and diversion logic intact.
Before approving a change, the project record should cover:
- Validated time-temperature requirements for the product.
- Holding-tube flow basis and flow-diversion operation.
- Instrument calibration, alarm records and data integrity.
- Product route during a divert event.
- Hygienic separation between product, water and utilities.
- Plate integrity and pressure relationships where heat recovery occurs.
- Cleaning validation after equipment or operating changes.
Commission Regulation (EC) No 2073/2005 provides relevant process-hygiene context. For pasteurised milk and other pasteurised liquid dairy products, its Enterobacteriaceae sampling plan specifies n = 5, c = 2, m = 1 cfu/ml and M = 5 cfu/ml at the end of manufacture, using ISO 21528-1. Unsatisfactory results require checks on heat-treatment efficiency, prevention of recontamination and raw-material quality.
The criterion does not validate a heat-recovery alteration. It reinforces the need to assess recontamination routes, hygienic design, cleaning procedures and heat-treatment performance before changing process conditions.
A practical workflow for PFD stream table optimisation
Build the balance from plant evidence
A reliable PFD optimisation study follows a controlled sequence:
- Collect current P&IDs, production records, utility data, CIP schedules, instrument lists and HACCP flow diagrams.
- Define the process, utility and waste-stream boundary.
- Walk the line during production, changeover, divert and cleaning.
- Assign stream tags and prepare the embedded table.
- Gather synchronised flow, temperature, pressure and composition data.
- Reconcile the product, water, steam and condensate balance for each operating state.
- Apply site-defined energy-balance closure and utility-return acceptance limits.
- Develop options and review each against HACCP, quality, cleanability and maintenance requirements.
- Validate approved changes, then update the PFD, stream table and operating records.
ISO 50001:2018 provides a framework for using measured energy data, energy performance indicators and continual improvement. A maintained PFD stream table gives that system process-level evidence, connecting a site energy meter to the product route and the utility streams responsible for consumption.
Select projects with a defined source, sink and owner
The strongest projects have a measured imbalance, a compatible receiving duty and a named operating owner. Common examples include restoring pasteuriser regeneration, returning clean condensate, reducing changeover-flush losses and matching a recoverable heat source to a controlled water-preheat duty.
Capital decisions require more than a promising temperature difference. The source must exist at useful flow for long enough, and the sink must require heat at the same time. Hygienic separation may require indirect heat transfer. The PFD stream table makes these constraints visible before equipment is specified.
This article reflects the independent analysis and editorial opinion of EnerTherm Engineering. Product names, trademarks, and brands mentioned belong to their respective owners. EnerTherm Engineering is not affiliated with, endorsed by, or a licensee of any third-party software or product mentioned unless explicitly stated.

Managing Director — EnerTherm Engineering
Dr. François Pierrel is Managing Director of EnerTherm Engineering with over two decades of expertise in thermal design, heat transfer, and industrial energy optimisation. He holds a PhD in Heat Transfer from Cranfield University and a Post-Doctorate from Heriot-Watt University.
