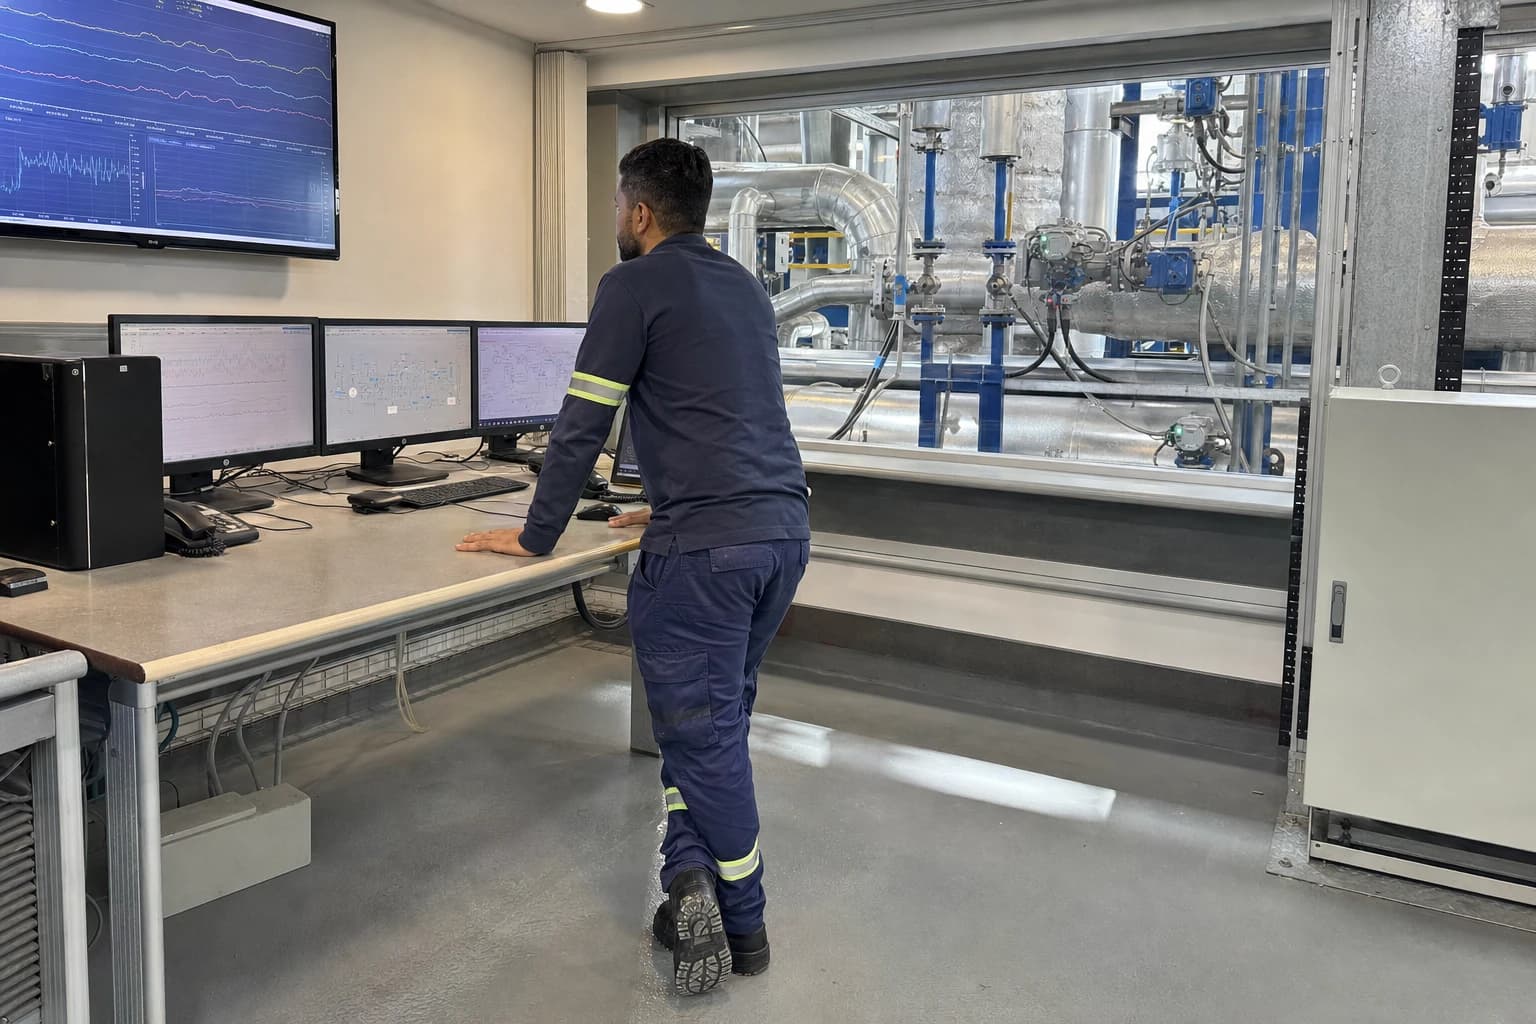
Steam System Optimisation Cuts Food Plant Fuel Costs
A case study on cutting fuel consumption by up to 18% with condensate recovery loops.
Steam generation and distribution consume between 20% and 60% of the total energy budget in a typical industrial food and beverage processing facility. For site energy managers and utility engineers at large-scale UK dairies, breweries, and food processing plants, rising fuel prices and strict decarbonisation directives mean that steam system optimisation initiatives in the food industry are no longer optional. These systems drive thermal operations from pasteurisation and Clean-in-Place (CIP) sanitation to multi-zone baking, cooking, and evaporation. Yet, suboptimal distribution networks, uninsulated valves, and failing steam traps quietly drain plant profitability.
Comprehensive steam system optimisation can reduce fuel consumption and utility costs by 12% to 18%. It also plays a key role in ensuring absolute compliance with UK safety legislation. By combining systematic steam trap auditing, thermodynamic condensate recovery loops, and rigorous thermal profiling, food manufacturers can secure rapid paybacks on capital expenditure (CapEx) while hitting their environmental targets.
The Financial and Regulatory Reality of Food Plant Steam Systems
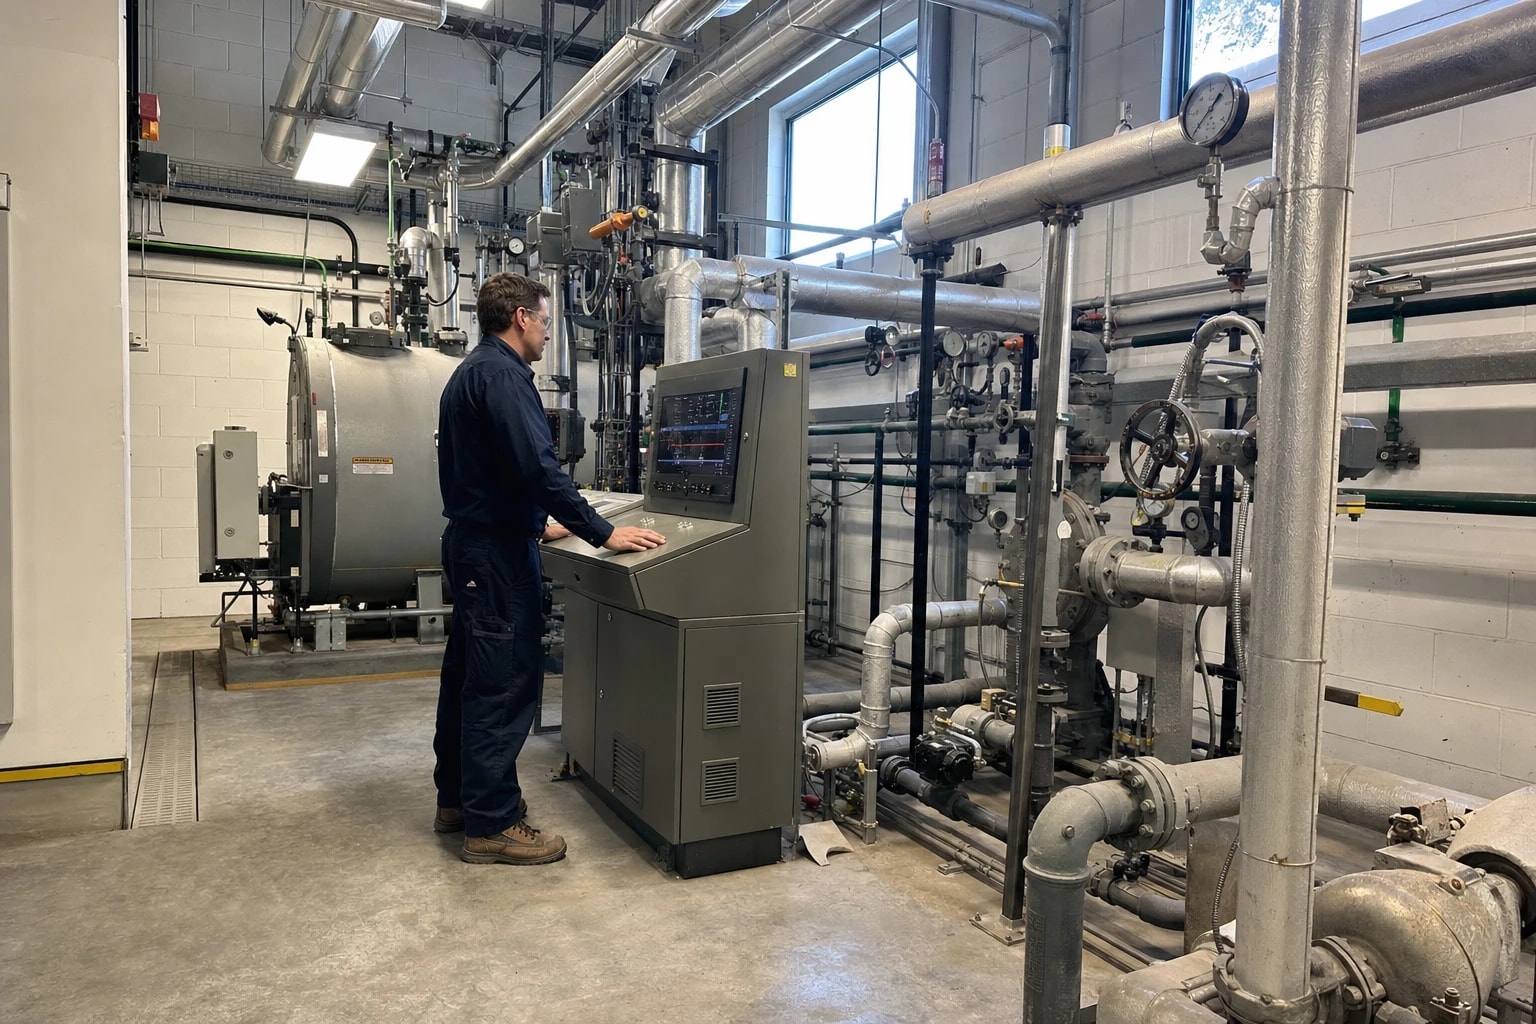
Large-scale food manufacturing relies on the rapid, reliable, and sterile transfer of heat. Steam is the primary medium because it carries a massive amount of latent heat, which can be precisely controlled by modulating system pressure. However, managing this high-energy utility requires balancing strict cost control with statutory safety rules.
Escalating Fuel Costs and Carbon Directives
Natural gas remains the primary fuel source for industrial steam boilers across the UK. This reliance exposes food manufacturers to highly volatile fossil fuel markets. In an industry where profit margins are notoriously slim, a sudden rise in natural gas pricing immediately inflates the unit cost of production.
Concurrently, the food and drink sector is working towards a net-zero target by 2050, with interim government goals requiring a 68% reduction in greenhouse gas emissions by 2030 compared to 1990 levels. Industrial heat accounts for a major portion of these emissions. Reducing fossil fuel consumption at the boiler is the most direct path to lowering Scope 1 emissions, satisfying corporate sustainability targets, and avoiding potential carbon taxes.
Compliance and Safety: The Role of PSSR 2000
Beyond energy economics, steam systems represent high-pressure hazards that are strictly regulated under the UK’s Pressure Systems Safety Regulations 2000 (PSSR). The primary objective of PSSR is to prevent serious injury from the sudden release of stored thermal energy caused by system failure.
Because steam systems fall under these regulations at any pressure and any volume, every food plant operator has a legal duty to maintain their system safely. Key obligations include:
- Establishing a Written Scheme of Examination (WSE): A competent, independent person must draw up and certify a WSE before the system is operated. The WSE specifies which parts of the pressure system require periodic inspection, including boilers, pipework, protective devices, and pressure vessels.
- Operating Within Safe Limits: Operators must define and monitor maximum allowable working pressures and temperatures.
- Preventative Maintenance and Record-Keeping: Maintenance teams must keep clear records of all system examinations, repairs, and modifications.
Unplanned steam leaks, water hammer, and corroded pipework do more than waste energy. They constitute immediate compliance failures that can result in HSE prosecutions, high fines, or forced plant shutdowns.

Map every energy and material flow in your process with detailed heat and mass balance calculations — the foundation for any optimisation or design project.
Quantification of Steam System Optimisation Opportunities
Systematic energy audits consistently reveal that steam distribution networks operate far below their design efficiency. By treating steam optimisation as a structured engineering project, utility teams can identify exactly where fuel energy is being lost and map out a pathway to recover it.
Fuel Savings and Efficiency Targets in UK Food Manufacturing
Typical steam system optimisation, condensate recovery, and carbon reduction initiatives in the UK food industry demonstrate that simple, non-invasive retrofits yield substantial returns. In food processing plants, average thermal energy demand can be reduced by 10% to 12% in the first phase of an optimisation programme. If a plant deploys an integrated approach, overall boiler fuel costs can fall by 12% to 18%.
The Three-Tier Framework: Generation, Distribution, and Recovery
Optimisation strategies are traditionally divided into three distinct operational zones:
- Steam Generation (The Boiler House): Focuses on combustion efficiency, burner tuning, flue gas heat recovery using economisers, and minimising boiler blowdown losses. Installing digital combustion controls and variable speed drives on combustion air fans helps match steam output precisely to instantaneous plant demand.
- Steam Distribution (The Pipe Network): Focuses on reducing radiation losses through high-performance insulation jacket installation on exposed valves, flanges, and main headers. This stage also requires eliminating direct steam leaks and maintaining pressure-regulating valves.
- Condensate Recovery (The Thermal Loop): Captures high-temperature liquid condensate from process vessels and routes it back to the boiler house. This process directly reduces the need for cold makeup water, chemical water treatment, and fossil fuel combustion.
The High Price of Neglect: Steam Trap Failure Rates and Costs
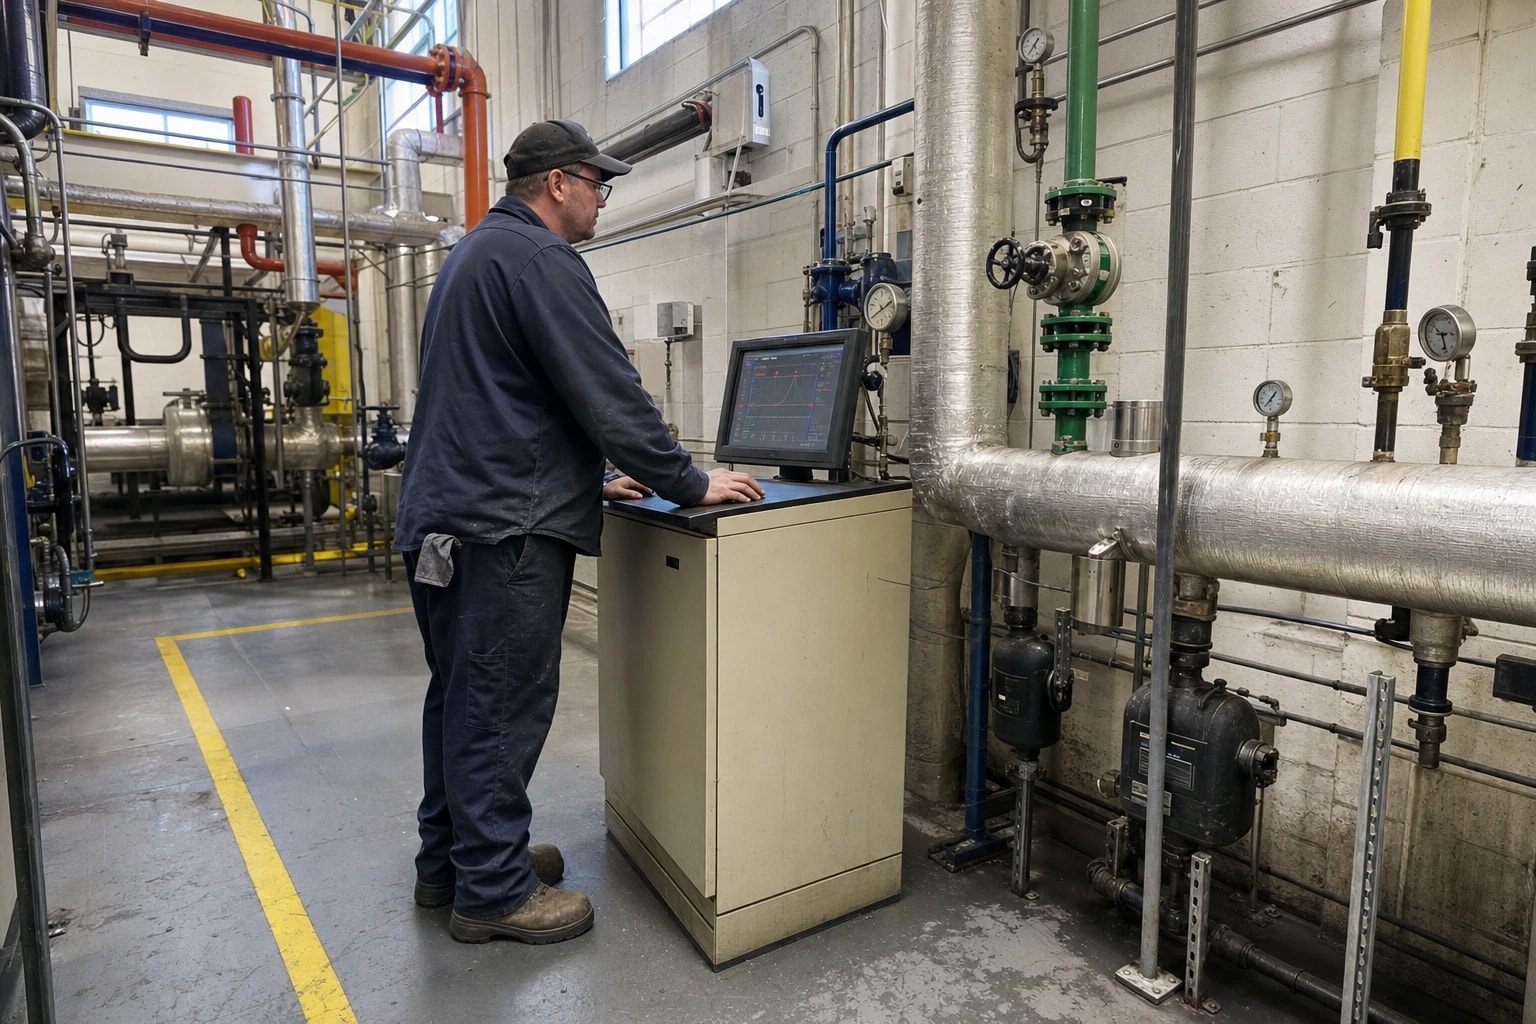
The steam trap is a critical component in any steam distribution network. It must automatically vent condensate, air, and non-condensable gases from the steam line while preventing the escape of live steam. However, because steam traps are mechanical devices operating under harsh conditions of thermal expansion, corrosion, and erosion, they exhibit high failure rates if left unmonitored.
How Steam Traps Fail: Open vs Closed States
Steam traps generally fail in one of two positions:
- Failed-closed: The trap remains shut, blocking the discharge of condensate. This causes liquid water to back up into the heat exchanger or steam main. The immediate consequences are a drop in process heat transfer efficiency, erratic temperature control (which directly threatens pasteurisation or food safety compliance), and severe water hammer. Water hammer occurs when high-velocity steam pushes slugs of liquid condensate against pipe elbows and valves, causing massive mechanical shock, pipe ruptures, and immediate safety hazards.
- Failed-open: The trap remains open, allowing live, high-pressure steam to blow directly into the low-pressure condensate return system. This does not interrupt the food process, but it silently vents expensive thermal energy directly to the atmosphere via the condensate receiver vents.
In a typical food and beverage manufacturing plant with no active steam trap maintenance programme, the annual steam trap failure rate is 15% to 20%. For plants that have neglected maintenance for more than three years, this failure rate routinely spikes to 50%.
Calculating the Annual Financial Impact of a Single Failed-Open Trap
The financial losses associated with high steam trap failure rates in food and beverage manufacturing are staggering. When a single steam trap on a 150 psig (approximately 10.3 barg) line fails open, it acts as an unthrottled orifice venting live steam.
Using Napier's equation for steam flow through an orifice, the steam loss can be calculated. For a trap with a 1/8 inch (approximately 3.17 mm) orifice discharging to atmospheric pressure, the estimated loss is 75.8 lb/hr (approximately 34.4 kg/hr).
To model the economic waste for a continuous food manufacturing operation running 8,760 hours per year, assume a conservative steam production cost of £25.00 per 1,000 lb (or roughly £55.00 per tonne of steam, incorporating natural gas, treated water, and boiler chemicals):
Annual Steam Loss=75.8 lb/hr×8,760 hr/year=663,990 lb/year Annual Financial Loss=(1,000663,990 lb/year)×£25.00=£16,599.75 per yearFor a large dairy or brewery operating 250 steam traps with a conservative 15% failure rate (37 failed-open traps), the cumulative annual loss exceeds £600,000 in wasted fuel and treated water.
The table below illustrates the scale of steam loss across various operating pressures and orifice sizes:
| Orifice Diameter | Steam Loss at 15 psig (lb/hr) | Steam Loss at 100 psig (lb/hr) | Steam Loss at 150 psig (lb/hr) | Steam Loss at 300 psig (lb/hr) |
|---|---|---|---|---|
| 1/32 in (0.79 mm) | 0.85 | 3.3 | 4.8 | - |
| 1/16 in (1.59 mm) | 3.4 | 13.2 | 18.9 | 36.2 |
| 1/8 in (3.17 mm) | 13.7 | 52.8 | 75.8 | 145.0 |
| 1/4 in (6.35 mm) | 54.7 | 211.0 | 303.0 | 579.0 |
| 3/8 in (9.53 mm) | 123.0 | 475.0 | 682.0 | 1,303.0 |
Data source: Adapted from U.S. Department of Energy (DOE) Advanced Manufacturing Office guidelines.

Map every energy and material flow in your process with detailed heat and mass balance calculations — the foundation for any optimisation or design project.
Maximising Heat Return: Designing an 85% Condensate Recovery Loop
Condensate is not merely wastewater; it is highly purified, pre-treated hot water that contains up to 25% of the original heat energy of the steam. Dumping this water down the drain forces the boiler house to draw in cold, untreated raw makeup water, which must then be chemically treated and heated from ambient temperatures up to boiling point.
Thermodynamic Principles of Condensate Return
A professionally engineered steam network should target returning 85% or more of its condensate to the boiler feedwater tank. When condensate is discharged through a steam trap, it drops in pressure, causing a portion of it to instantaneously boil off as flash steam. In unoptimised plants, this flash steam is vented to the atmosphere.
An optimised condensate return loop routes this high-energy mixture through a flash vessel, separating the flash steam to be used in low-pressure heating applications (such as space heating or raw water preheating) while returning the remaining liquid condensate to the feedwater tank.
Feedwater Preheating: The 6°C Rule for Efficiency Gains
Returning hot condensate directly raises the temperature of the boiler feedwater. Thermodynamically, the closer the feedwater is to the boiling point, the less fuel energy is required to transition the water from liquid to gas.
A fundamental rule of thumb in steam systems engineering dictates that:
For every 6°C rise in boiler feedwater temperature achieved via recovered condensate, the system's thermal efficiency improves by 1%.
If a plant increases its condensate recovery rate from 30% to 85%, the feedwater tank temperature might rise from 60°C to 90°C—a 30°C net increase. Applying this thermodynamic rule:
Boiler Efficiency Improvement=6∘C30∘C=5%This 5% increase in boiler efficiency translates directly into a 5% reduction in annual natural gas consumption. Additionally, because condensate is pure distilled water, this recovery reduces chemical dosing costs and boiler blowdown volume, yielding massive water savings.
Conducting Rigorous Heat and Mass Balance (HMB) Audits
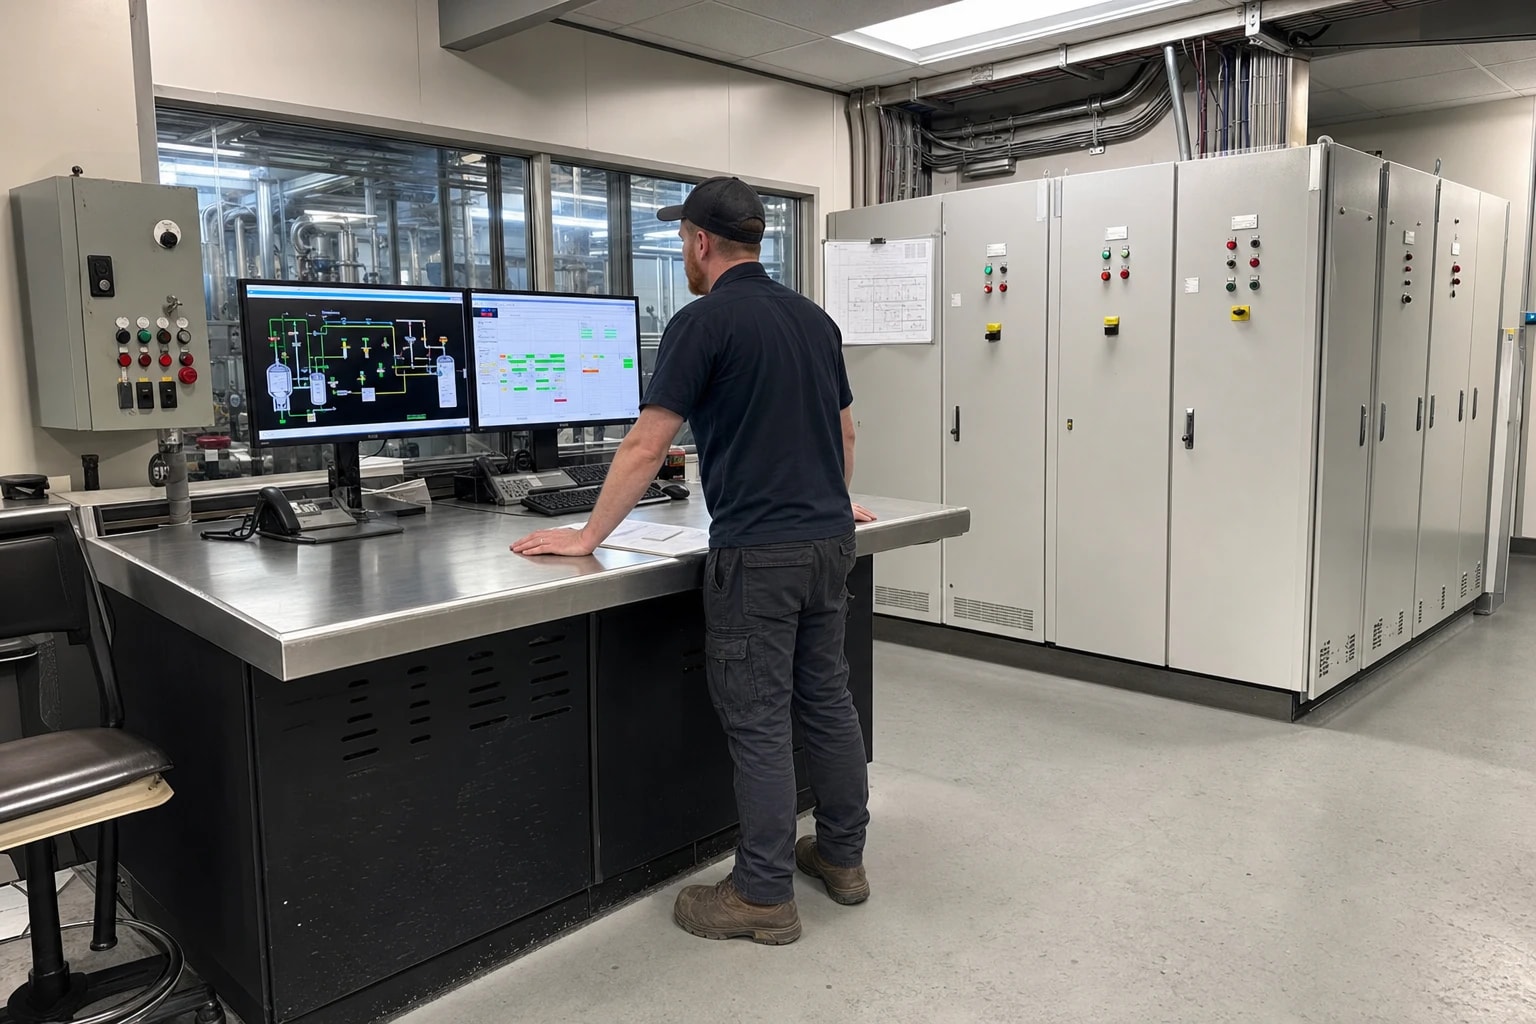
To successfully justify a steam system retrofit to executive leadership, utility engineers must base their proposals on empirical, validated operational data. This requires executing a structured Heat and Mass Balance (HMB) audit.
Data Acquisition: P&IDs, Logs, and Multi-Zone Thermal Profiling
An HMB audit begins with comprehensive data gathering. Engineers collect Piping and Instrumentation Diagrams (P&IDs), process flow diagrams (PFDs), historical boiler control logs, and utility bills.
In food manufacturing plants, multi-zone thermal profiling is crucial. Multi-zone systems have diverse thermal requirements. For instance:
- A brewery has highly transient steam loads, with massive, sudden demands during wort boiling followed by periods of low usage.
- A dairy operates continuous, high-temperature short-time (HTST) pasteurisers alongside batch evaporators that demand stable pressure profiles.
- A bakery utilises steam at lower pressures for humidity control inside ovens.
Measuring steam flow, pressure, and temperature at each of these individual zones allows engineers to construct a detailed time-series of energy demand.
Process Modelling and Sankey Energy Mapping
Process engineers often utilise professional, thermodynamic modelling tools to simulate the entire steam grid. Steady-state and dynamic simulations of the steam distribution network are frequently built using industry-standard platforms such as Aspen Plus, HYSYS, or DWSIM. These models allow engineers to run parametric customisations, evaluating "what-if" scenarios like the impact of changing system pressures, reducing trap failure rates, or increasing condensate backpressure.
The output of this modelling is translated into a Sankey energy map. This visual representation traces the flow of energy from the fuel input at the burner, through the boiler shell, along the distribution pipework, into the process heat exchangers, and ultimately maps where the energy is either put to work or lost to the environment. The Sankey map makes it immediately clear to non-technical stakeholders exactly where the site's energy and money are escaping.
Building the Capital Expenditure (CapEx) Business Case
The ultimate hurdle for any site energy manager is securing CapEx approval from executive leadership. Board members rarely make investment decisions based on thermodynamic equations alone; they require clear financial metrics, risk mitigation, and verified payback periods.
Calculating ROI and Simple Payback Periods
Steam system optimisation retrofits are highly attractive to financial directors because they consistently deliver some of the shortest payback periods in industrial utilities.
For example, a comprehensive steam trap maintenance programme and condensate recovery upgrade might require the following financial breakdown:
- Initial Audit and Diagnostic Costs: £15,000
- Replacement of 40 Failed Steam Traps: £12,000
- Condensate Return Pump Piping & Flash Tank Retrofit: £45,000
- Total CapEx Required: £72,000
If the dynamic simulation and HMB audit demonstrate a verified 12% reduction in annual natural gas consumption on a site spending £600,000 per year on fuel, the annual savings are £72,000.
Simple Payback Period=Annual SavingsTotal CapEx=£72,000£72,000=1.0 yearMany standard steam trap remediation projects achieve a simple payback of under 6 months, while comprehensive plant-wide optimisations typically range between 1.0 and 1.8 years.
Presentation Strategies for Executive Leadership
When presenting the CapEx request to the board, site energy managers should structure their business case around three high-impact pillars:
- Risk Mitigation and Legal Defence: Frame the steam trap and distribution upgrades as a mandatory safety measure. Operating a steam system with water hammer and failed valves increases the risk of catastrophic pipe failure, which directly violates PSSR 2000 and exposes the directors to criminal liability.
- Guaranteed Operating Margin Protection: Highlight that reducing fuel consumption by 12% to 18% immunises the company's operating costs against volatile natural gas price spikes.
- Measurable Carbon Reduction: Quantify the reduction in CO₂ emissions. Board members are increasingly scrutinised on corporate environmental, social, and governance (ESG) performance. Proving that a £72,000 investment will permanently eliminate 150 tonnes of CO₂ emissions annually adds significant non-financial weight to the proposal.
By translating thermodynamic efficiency into direct financial savings, reduced legal exposure, and verified carbon reductions, utility engineers can present an airtight, low-risk business case that is easily approved by executive leadership.
This article reflects the independent analysis and editorial opinion of EnerTherm Engineering. Product names, trademarks, and brands mentioned belong to their respective owners. EnerTherm Engineering is not affiliated with, endorsed by, or a licensee of any third-party software or product mentioned unless explicitly stated.

Managing Director — EnerTherm Engineering
Dr. François Pierrel is Managing Director of EnerTherm Engineering with over two decades of expertise in thermal design, heat transfer, and industrial energy optimisation. He holds a PhD in Heat Transfer from Cranfield University and a Post-Doctorate from Heriot-Watt University.
