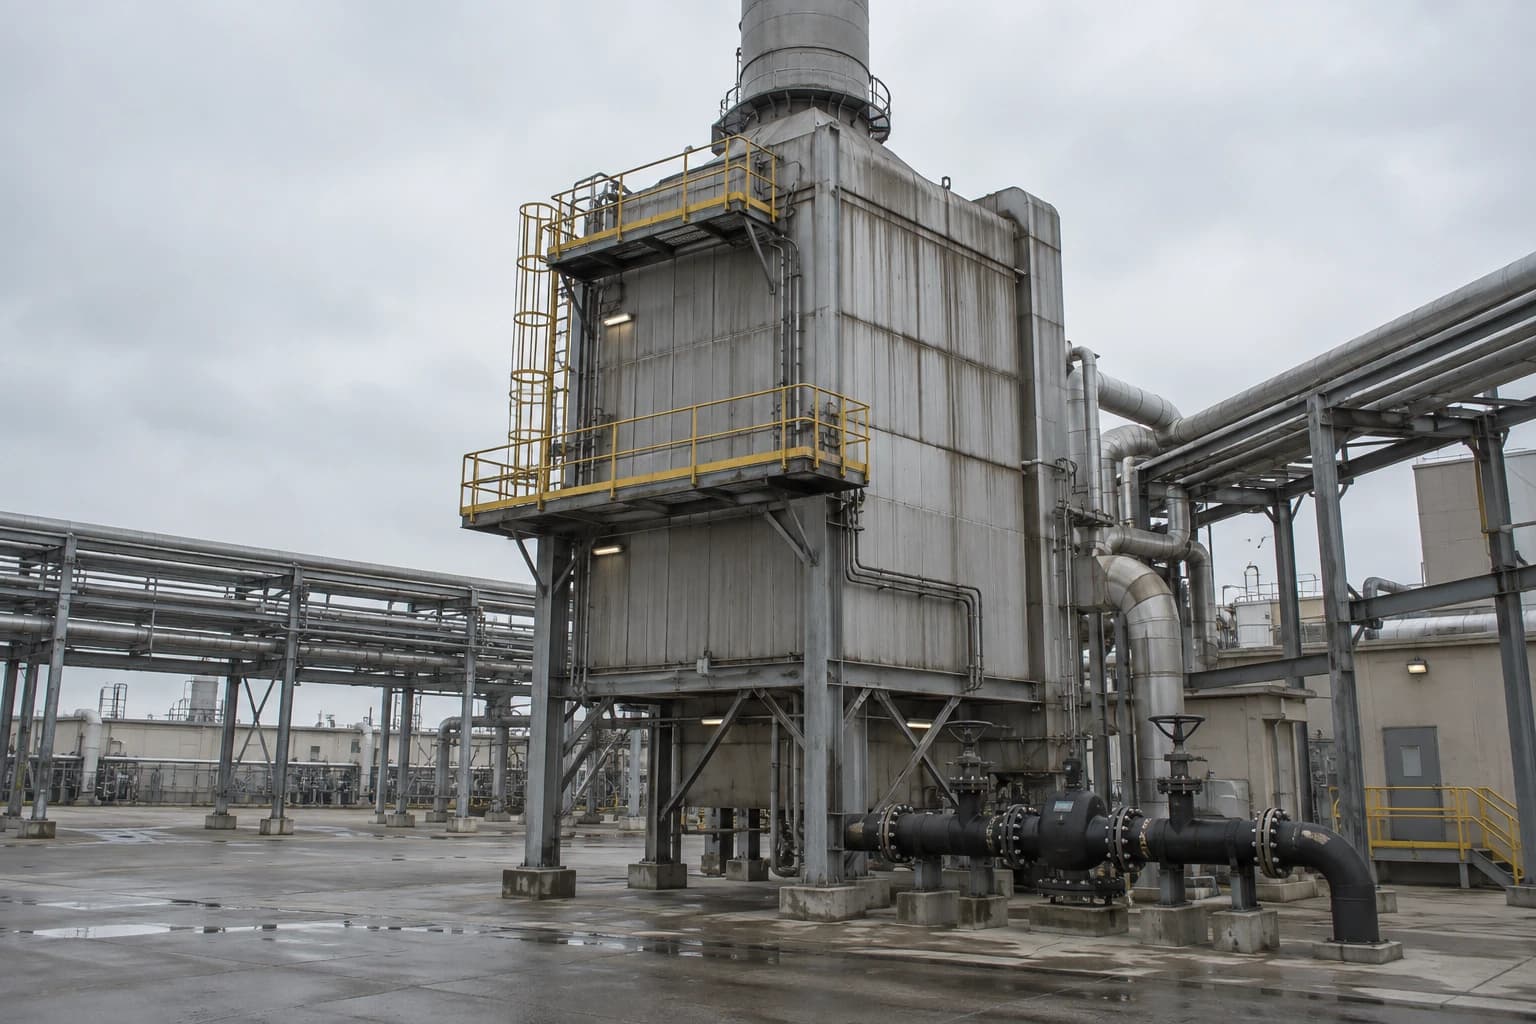
Thermal Process Benchmarking: ISO 50006 EnPIs
ISO 50006 baselines compare plant energy performance and support retrofit CAPEX decisions.
Thermal process benchmarking measures the energy used to deliver a defined thermal duty and compares performance across time, production conditions, sites or technically comparable assets. A Department for Energy Security and Net Zero report published in March 2026 defines industrial energy efficiency as reducing delivered energy consumed per unit of industrial output, focusing on process performance rather than office or building consumption.
For chemical producers, refineries and pharmaceutical manufacturers, this distinction matters. A site can report lower annual gas consumption while process heating performance has deteriorated because output, ambient conditions, operating rates or product mix changed. Conversely, a plant may consume more fuel while delivering a genuine efficiency improvement during higher throughput.
ISO 50006:2023 provides a structure for resolving this problem. It guides organisations in establishing, using and maintaining energy performance indicators, known as EnPIs, and energy baselines, known as EnBs. Used well, these tools turn boiler-house readings, steam flows, furnace fuel meters and production records into evidence for operational action and capital investment.
Why thermal process benchmarking needs more than a site energy total
A whole-site energy bill is useful for financial control. It rarely identifies why a thermal process consumes more energy than expected.
Steam demand may rise because of heat-exchanger fouling, higher reflux in a distillation column, poor condensate return, a change in feed moisture, a furnace excess-air issue or an alteration in product specification. Each cause sits behind the same monthly gas invoice.
Thermal process benchmarking separates process energy use from changes in the volume and character of production. It answers practical questions:
- How many kWh of fuel and purchased electricity are required per tonne, batch, m³ or active ingredient produced?
- Has the steam demand of a production line changed after correcting for throughput and operating conditions?
- Which process area has the widest gap between actual utility use and a Pinch Analysis target?
- Did a heat-recovery retrofit reduce the process EnPI, or did output simply fall?
- Which opportunities have enough verified energy value to justify CAPEX?
Specific energy consumption is useful, with limits
Specific energy consumption, or SEC, remains the most familiar process-heating KPI. A dryer may track kWh per tonne of evaporated water. A reactor train may track kg of steam per tonne of product. A refinery unit may monitor fuel gas per unit of feed processed.
The metric is easy to explain and often exposes poor performance quickly. It can mislead when a plant produces several grades, runs partial campaigns, changes feedstock quality or has significant fixed heat losses. A batch pharmaceutical process can show an apparent SEC penalty when batch size falls, even if the heating system operates consistently.
A useful EnPI identifies the output basis, included energy streams, boundary conditions and significant variables before setting a target.
Thermal boundaries determine whether comparisons are credible
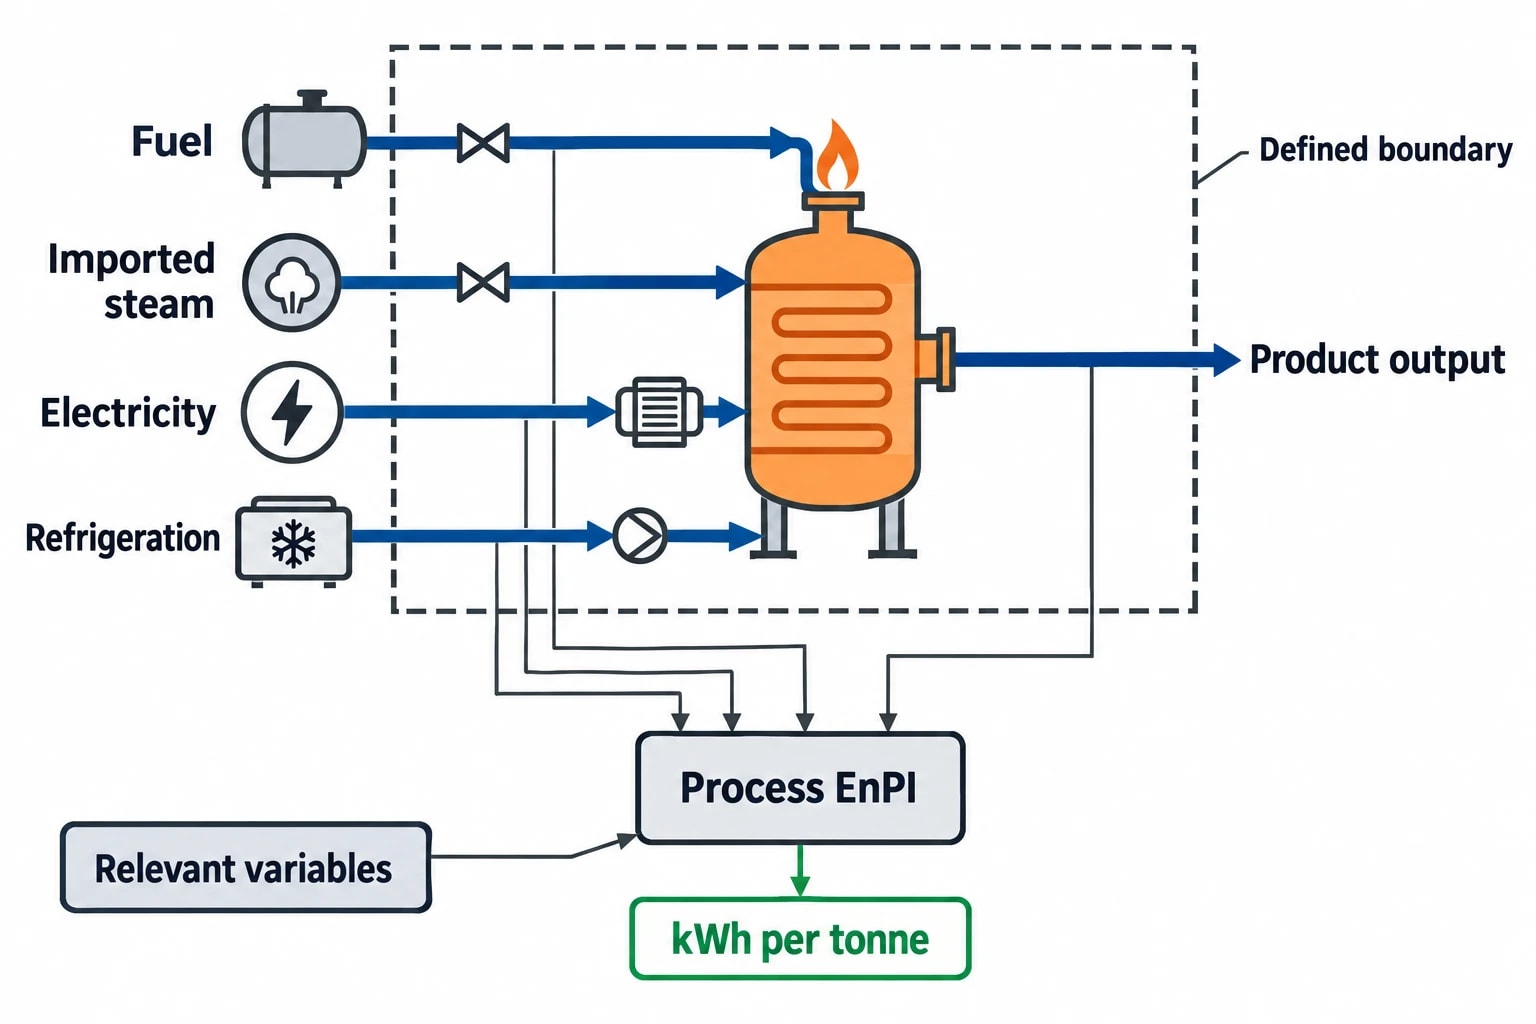
A benchmark needs a stated boundary. For an individual process, that boundary might include fuel to a thermal-oil heater, imported steam, electricity to circulation pumps and refrigeration supporting a separation. It might exclude central utilities that cannot yet be allocated reliably.
The decision should be documented and retained. Shifting the boundary between reporting periods creates false savings and makes an otherwise sound EnPI unusable for investment review.
Common thermal process boundaries include:
| Benchmark level | Typical included energy | Typical output basis |
|---|---|---|
| Equipment | Burner fuel, electrical heating, fans and drives | Batch, tonne treated, m² coated |
| Process unit | Fuel, steam, electricity and recoverable heat imports | Tonne feed, tonne product, m³ processed |
| Utility system | Boiler fuel, boiler electricity, water treatment and distribution losses | Tonnes of steam at stated pressure |
| Site | Purchased fuels and electricity across defined operations | Production-weighted output or a normalised model |

Pinch analysis identifies the thermodynamic minimum energy requirement of your process — then designs the heat exchanger network to achieve it.
ISO 50006 EnPIs and energy baselines
ISO 50006:2023 applies to organisations of any size and can support an ISO 50001 energy-management system. Its value for thermal process benchmarking lies in its insistence that performance is evaluated against an appropriate baseline and relevant variables.
An EnPI is the measure. An EnB is the reference against which that measure is judged.
Build an EnPI around the thermal duty
The strongest thermal EnPIs relate energy to the work the process must perform.
For a chemical plant, useful indicators may include steam per tonne of saleable product, GJ per tonne of dry solids, furnace fuel per tonne of feed, or reboiler duty per tonne of separation achieved. Pharmaceutical operations may need energy per batch adjusted for batch size, solvent load, sterilisation cycle or drying endpoint. Refining teams may use fuel and steam metrics linked to feed rate, crude characteristics, throughput and unit severity.
A good indicator does not conceal operational detail. A monthly plant-level SEC can sit above process-level EnPIs for fired heaters, distillation, evaporation, drying and steam generation. The hierarchy shows whether a site problem originates in utility generation, distribution or process demand.
Select relevant variables before declaring savings
Production volume is usually significant. It is rarely the only variable.
Relevant variables may include ambient temperature, operating hours, feed temperature, feed moisture, product grade, batch size, yield, pressure level, process temperature, equipment availability and maintenance state. A thermal baseline should reflect variables that materially affect energy use and can be measured consistently.
For a drying operation, tonnes of product alone may be inadequate. Water removed and inlet moisture can provide a closer representation of thermal duty. For a distillation process, throughput without product specification or reflux requirements can overstate the apparent effect of a heat-integration project.
The baseline may use a fixed reference period for stable, repeatable operations. More variable processes often need a normalised baseline or model that predicts expected energy consumption under defined conditions. The method should remain transparent enough for plant teams and finance reviewers to test the result.
Preserve the baseline after a material change
A baseline is not permanent by default. Organisations should review it after changes that alter energy performance or the variables that influence it. A new heat-exchanger network, additional production train, fuel switch, major product change or revised measurement boundary may require a new baseline.
The record should explain why the change occurred and identify the date on which the revised method begins. This prevents comparison of an old plant configuration with a new one through a metric that no longer measures the same activity.
How to benchmark thermal process efficiency in practice
Thermal process benchmarking starts with a measurement plan, not a spreadsheet. Meter data must match the operating reality of the process.
Map energy streams and production data
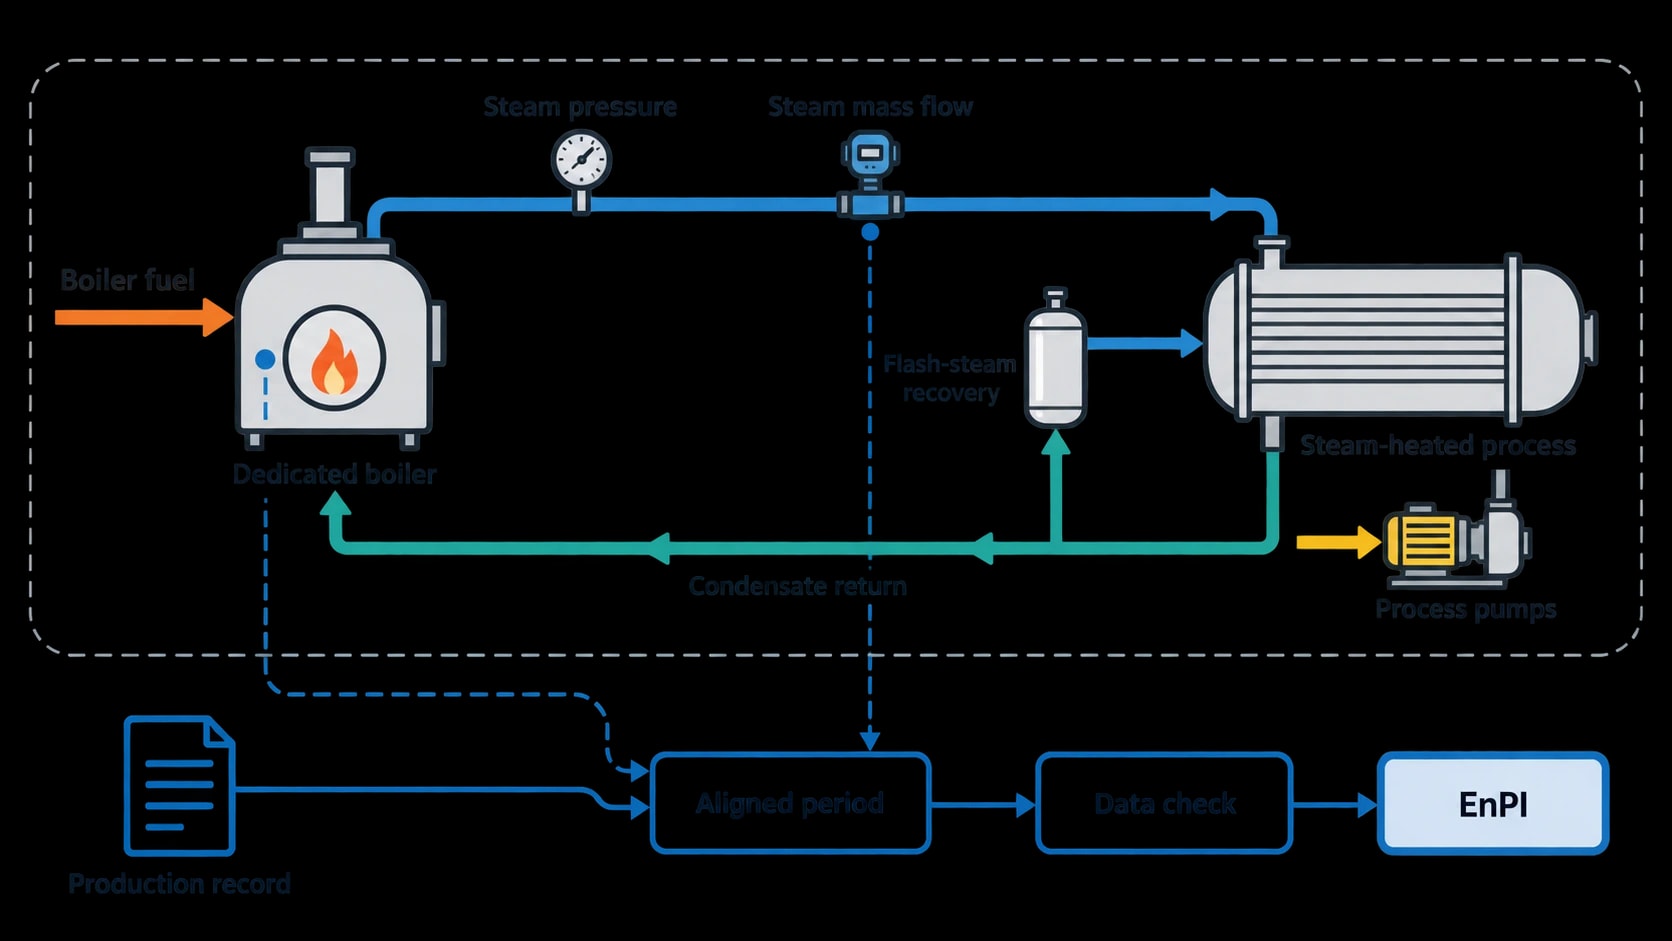
Plant teams should identify every significant energy stream crossing the chosen boundary. For a steam-heated process, this can include steam pressure and mass flow, condensate return, flash-steam recovery, fuel consumed by a dedicated boiler and electricity used by process pumps.
Production records need equivalent attention. The accounting period, product grades, reject material, rework, campaign duration and shutdown hours must align with the energy-data period. A monthly EnPI based on a calendar-month utility invoice and a four-week production report invites error.
The measurement plan should identify:
- Meter location, identifier, calibration status and data frequency.
- Energy carrier and units, including any conversion method.
- Process boundary and allocation method for shared utilities.
- Production or thermal-duty denominator.
- Relevant variables and data owner.
- Missing-data procedure and approval route.
- Review frequency and control limits.
Establish data quality before comparing plants
A benchmark has little value if one site measures boiler fuel and another estimates it from purchasing data. Likewise, a steam meter that excludes a branch line can make a process appear more efficient than it is.
Energy managers should test data against physical constraints. Boiler fuel, steam generation, condensate return and major steam consumers should reconcile within a stated, understood tolerance. Sudden step changes in an EnPI should prompt a check of instrumentation, production coding and process events before teams assign an operational cause.
For multi-site groups, a common data dictionary prevents small differences becoming major reporting errors. Define whether energy is reported as purchased energy, delivered energy to the process or primary energy. Define whether exported steam, recovered heat and on-site generation are included. Apply the same rule to each comparable site.
Use internal and external benchmarks for different decisions
Internal benchmarking compares similar production lines, operating shifts, plants or campaigns. It is actionable because the data, equipment history and operating practices are available for review. A top-performing line can identify set-point discipline, maintenance practice or condensate-recovery methods worth transferring.
External benchmarking tests the scale of the opportunity. The US Environmental Protection Agency’s ENERGY STAR Energy Performance Indicators offer a useful conceptual model. Its sector-specific tools compare actual whole-plant energy performance against similar facilities, account for significant operational characteristics and score performance on a 1 to 100 scale. They are US tools, built from US manufacturing data, so UK sites should not treat their scores or datasets as direct compliance benchmarks.
Their underlying discipline remains valuable: compare like with like, normalise for meaningful variables, use actual performance data and investigate the gap before committing capital.
UK teams can also use DESNZ industrial decarbonisation and energy-efficiency action plans, Industrial Energy Efficiency Accelerator project reports, sector associations and anonymised peer studies as context. Energy intensity varies with product slate, plant age, integration with adjacent processes, feed quality, site geography and the method used to allocate utility losses.

Pinch analysis identifies the thermodynamic minimum energy requirement of your process — then designs the heat exchanger network to achieve it.
Pinch Analysis makes thermal benchmarking investable
An EnPI identifies performance drift and prioritises energy-intensive processes. Pinch Analysis explains the theoretical and practical scope for reducing hot and cold utility demand through heat recovery.
The two methods answer different questions and work best as a pair.
Compare actual use with the heat integration target
Pinch Analysis starts from process-stream data: supply and target temperatures, heat-capacity flow rates, phase changes and heat duties. Composite curves and the grand composite curve show the match between hot streams releasing heat and cold streams requiring heat.
The resulting minimum utility targets provide a reference for a process’s heat-recovery potential at an agreed minimum temperature approach. Actual steam, fuel and cooling use can then be compared with a technically grounded target.
A wide gap may point to bypassed heat exchangers, fouling, poor temperature control, heat-recovery constraints, an unsuitable utility level or operating conditions outside the design case. The gap is a screening signal. Engineers still need to assess controllability, safety, materials, pressure drop, cleaning requirements, batch scheduling and production risk.
Set EnPIs that remain useful after retrofit
A Pinch Analysis target describes an achievable direction under stated assumptions. The EnPI verifies whether the plant captures that value over time.
For example, a site may install heat-exchanger area to recover heat from a hot process stream into a cold feed. The post-project indicator should measure energy per unit of matched production under comparable operating conditions. Supporting indicators may track heat-exchanger approach temperature, bypass position, fouling trend, steam flow and operating availability.
This arrangement distinguishes a one-off commissioning result from sustained performance. It also gives maintenance teams a quantified reason to act when heat-exchanger performance declines.
Prioritise projects through the benchmark gap
A practical heat-integration project list often includes options with different levels of disruption. Benchmarking helps sort them.
Low-capital actions can include restoring insulation, repairing steam traps, correcting control set points, repairing failed condensate-recovery equipment or removing inappropriate heat-exchanger bypasses. These measures should improve the EnPI quickly if they address the stated cause of poor performance.
Higher-capital work may include new heat-exchanger trains, heat pumps, vapour recompression, waste-heat recovery, utility-system changes or alterations to process configuration. Each case needs a clear reference: baseline energy use, expected operating conditions, target reduction, fuel and electricity assumptions, carbon basis, maintenance consequences and measurement method after start-up.
Turning EnPI results into a CAPEX case
Finance teams need an auditable connection between the observed benchmark gap and project value. That connection should withstand scrutiny from operations, maintenance and sustainability teams.
Report performance in three layers
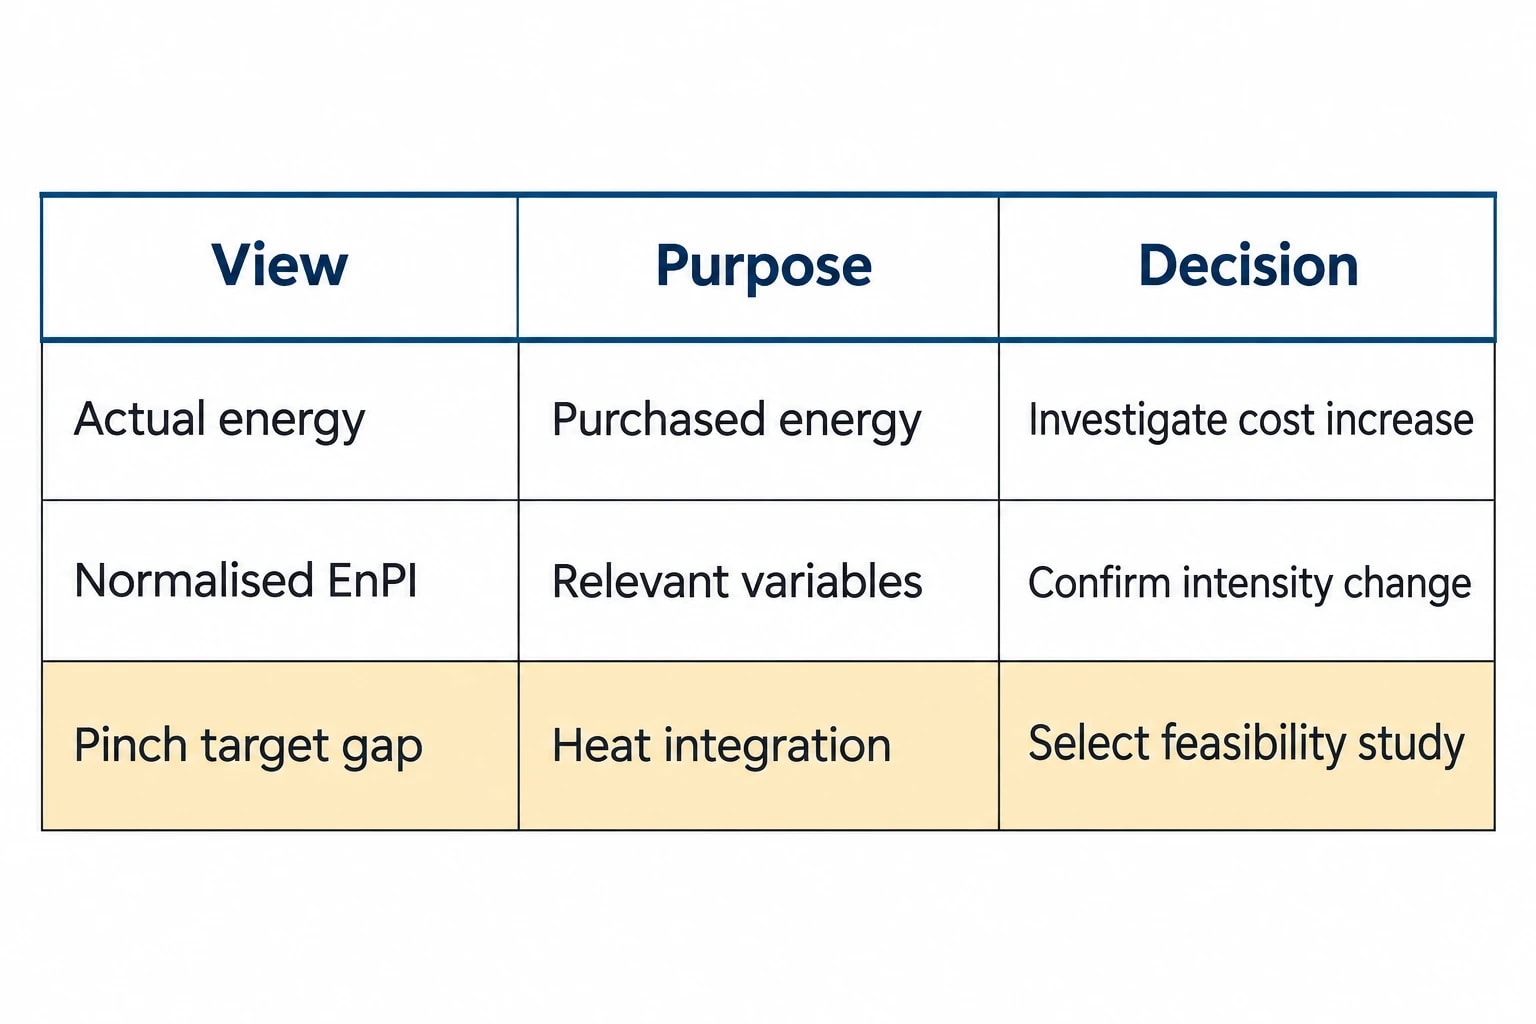
A concise monthly report can show three related views:
| View | Purpose | Example decision |
|---|---|---|
| Actual energy | Tracks purchased fuel, steam and electricity | Investigate an unexpected utility cost increase |
| Normalised EnPI | Tests process performance after accounting for relevant variables | Confirm whether energy intensity has worsened |
| Pinch target gap | Quantifies the scale of heat-integration opportunity | Select projects for feasibility study |
This structure avoids presenting a theoretical target as a guaranteed saving. It also avoids accepting an improved SEC without checking whether a change in production conditions caused the result.
Give ownership to operations as well as energy management
A thermal process EnPI needs an operational owner. Process engineers can interpret feed and product variables. Utility engineers can investigate boiler, steam and condensate losses. Maintenance teams can act on fouling, leaking valves, failed insulation and instrument faults. Energy managers can maintain the baseline, governance and reporting discipline.
Review meetings should focus on material deviations, named causes, corrective actions and the expected effect on the selected EnPI. Repeated deviations with no identified cause indicate a data-quality problem or a process that needs more detailed study.
Best practice for industrial energy benchmarking
Strong thermal benchmarks stay close to process physics and production reality. They define a boundary, use data that can be checked, account for relevant variables and preserve a clear baseline history.
This article reflects the independent analysis and editorial opinion of EnerTherm Engineering. Product names, trademarks, and brands mentioned belong to their respective owners. EnerTherm Engineering is not affiliated with, endorsed by, or a licensee of any third-party software or product mentioned unless explicitly stated.

Simulation Engineer — EnerTherm Engineering
Rajesh Sekar is a Simulation Engineer at EnerTherm Engineering, specialising in computational fluid dynamics (CFD), finite element analysis (FEA), and thermal process simulation. He holds a degree from Cranfield University and brings extensive experience in simulation-based product development from the automotive, aerospace, and energy sectors.
