Automating Food Industry Sustainability Reporting for SECR
Securing audit-ready Scope 1 and 2 SECR data while cutting energy costs by 15-25%.
The UK food and beverage manufacturing sector is the largest manufacturing industry in the nation by economic value [1.1]. It is also the fourth-largest industrial energy user, consuming approximately 37 TWh of energy annually, with process heating and thermal operations representing up to 60% of this total. Under the Streamlined Energy and Carbon Reporting (SECR) framework, established by the Companies (Directors' Report) and Limited Liability Partnerships (Energy and Carbon Report) Regulations 2018, large companies must disclose their energy use and greenhouse gas emissions. For compliance managers, food industry sustainability reporting is now a core requirement of corporate governance.
To qualify for SECR reporting, an organisation must meet at least two of the following criteria in a financial year:
- An annual turnover of £36 million or more.
- A balance sheet total of £18 million or more.
- An average employee count of 250 or more.
Large unquoted companies and LLPs meeting these thresholds must report, unless they qualify for the low energy user exemption. The only exemption is for organisations that can prove their total UK energy consumption is 40,000 kWh (40 MWh) or less during the reporting year. For industrial food processing operations running heavy refrigeration plants, steam networks, and automated cooking lines, exceeding this threshold is inevitable.
SECR Thresholds and Compliance Mandates for Food Manufacturers
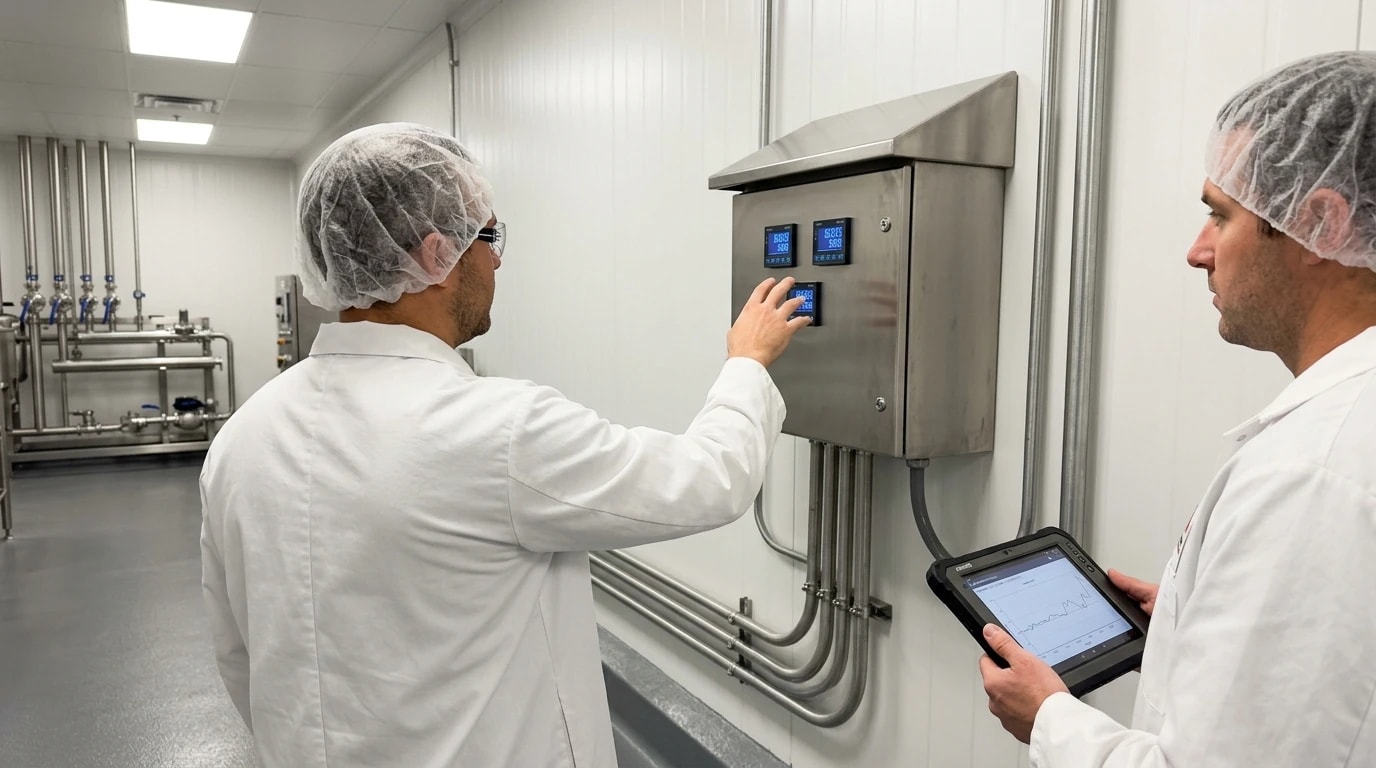
The SECR framework requires qualified food and beverage manufacturers to present a defined set of environmental metrics within their annual Directors' Report. This information must be clearly presented and supported by a robust, verifiable methodology.
Mandatory SECR Disclosures
Large unquoted companies in the food and beverage sector must disclose:
- Total Energy Consumption: Total UK energy use in kilowatt-hours (kWh) across electricity, natural gas, and transport fuel.
- Greenhouse Gas Emissions: Associated Scope 1 and Scope 2 emissions in tonnes of carbon dioxide equivalent (tCO₂e).
- Historical Comparison: A direct comparison with data from the previous financial year to show performance trends.
- Intensity Ratio: At least one intensity metric that normalises emissions against a core business activity indicator.
- Energy Efficiency Actions: A narrative describing the principal energy efficiency measures implemented within the reporting year.
- Methodology: The formal methodology used for calculations, such as the Greenhouse Gas Protocol Corporate Standard.
Establishing Material Energy Intensity Ratios
An intensity ratio allows auditors to assess efficiency gains over time, regardless of production volume fluctuations. While service-based companies often report emissions per square metre of floor space, food manufacturers must use metrics aligned with physical output, such as:
- Tonnes of CO₂e per tonne of finished product.
- Kilograms of CO₂e per thousand litres of packaged beverage.
- Tonnes of CO₂e per batch or production cycle.
Integrating production data with energy tracking systems automates these calculations, replacing retrofitted estimates with empirical evidence.

Omni Vision delivers turnkey utility metering, CO2 tracking, and AI-powered production KPI intelligence — giving you real-time dashboards and actionable insights across your entire facility.
ESOS Phase 4 Alignment and the 95% Energy Coverage Rule
Food manufacturers must manage SECR disclosures alongside the Energy Savings Opportunity Scheme (ESOS). Administered by the UK Environment Agency, ESOS requires large undertakings to carry out comprehensive energy assessments every four years.
The qualification date for ESOS Phase 4 is 31 December 2026, with a compliance deadline of 5 December 2027. Organisations that qualify as large undertakings on this date must complete an ESOS assessment and notify the Environment Agency via the digital system.
The 95% Energy Coverage Rule
Under Environment Agency guidelines for ESOS Phase 4, the minimum energy coverage requirement is 95% (having risen from 90% in earlier phases). This leaves a de minimis allowance of 5%, requiring manufacturers to account for almost all energy consumed across industrial processes, logistics, and facilities. Unmetered processes must be identified and quantified, increasing the pressure to implement granular sub-metering systems.
Removal of Alternative Compliance Routes
Previously, organisations could use Display Energy Certificates (DECs) or Green Deal Assessments (GDAs) as compliance routes. The Environment Agency removed these options for Phase 4 as they fall short of best-practice energy auditing standards. As a result, manufacturers must rely on assessments led by accredited external Lead Assessors or utilise a certified ISO 50001:2018 energy management system. Furthermore, Phase 4 requires organisations to record and publish progress against previous action plan commitments, explaining any unmet targets.
Categorising Scope 1 and Scope 2 Emissions in Food Processing
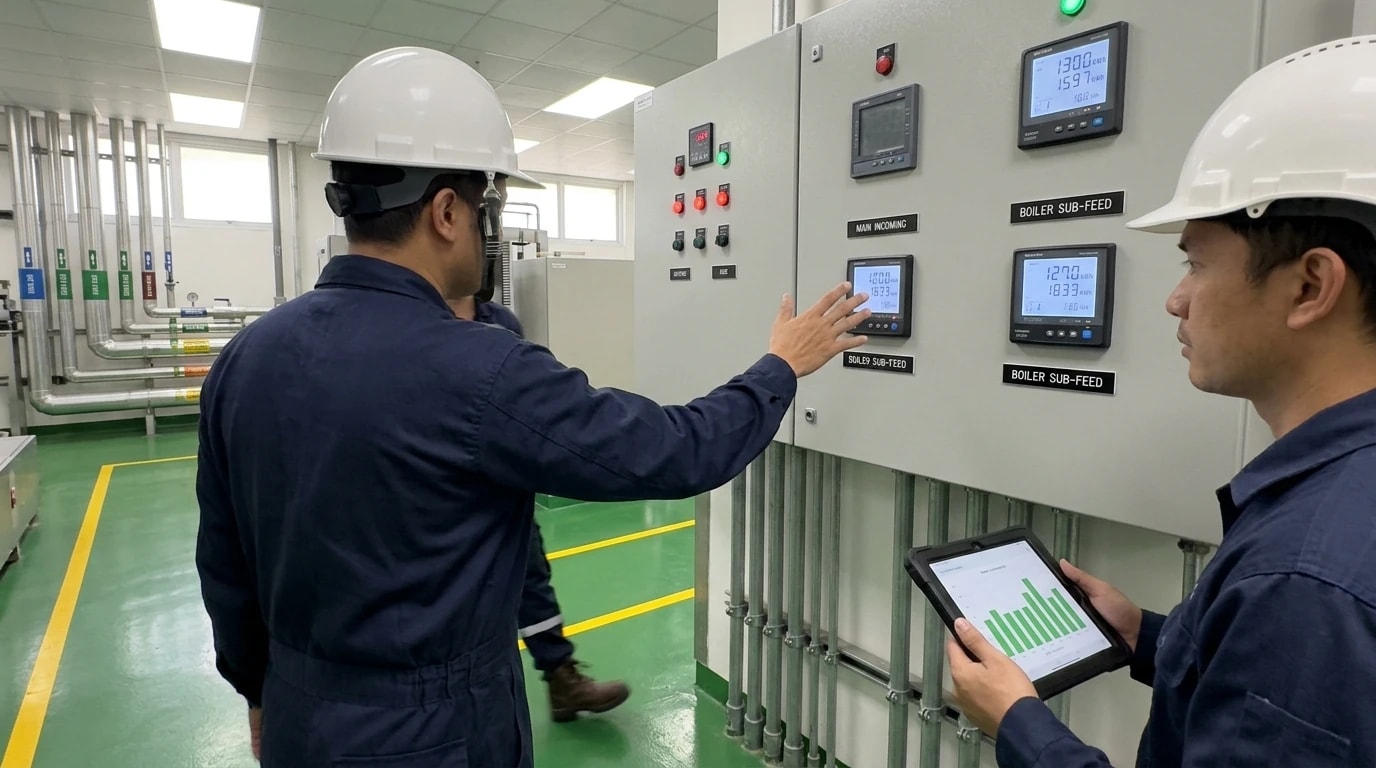
Accurate food industry sustainability reporting requires the precise division of energy consumption into Scope 1 and Scope 2 emissions. This distinction is vital for both SECR compliance and the identification of targeted carbon-reduction opportunities.
Scope 1: Direct Combustion and Refrigerant Losses
Scope 1 emissions encompass all direct greenhouse gas emissions from sources owned or controlled by the manufacturer. In food processing, these emissions are predominantly driven by:
- Natural Gas Combustion: Large steam boilers and hot water generators supply thermal energy for clean-in-place (CIP) processes, pasteurisation, sterilisation, and retort cooking.
- Direct-Fired Ovens and Fryers: Industrial baking and frying lines burn gas directly to maintain precise cooking temperatures.
- Fugitive Refrigerant Emissions: Industrial cooling systems, blast freezers, and cold storage units often use hydrofluorocarbons (HFCs) or synthetic refrigerants. Small leaks in valves, pipe joints, and compressor seals must be calculated and converted to carbon dioxide equivalent (CO₂e) using the UK government's greenhouse gas reporting conversion factors.
- Onsite Transport: Fossil fuel consumed by materials handling equipment, such as diesel forklifts, and distribution fleets.
Scope 2: Indirect Emissions from Purchased Electricity
Scope 2 emissions cover indirect emissions from purchased grid electricity consumed by the plant. Food manufacturing facilities require substantial electrical power to run:
- Industrial Refrigeration Compressors: Ammonia or carbon dioxide cooling packs operating continuously to maintain sub-zero temperatures in cold storage facilities.
- Motor-Driven Processing Equipment: High-throughput sorting tables, mixers, homogenisers, and packaging lines.
- Compressed Air Systems: Air compressors powering pneumatic actuators, packaging machinery, and product sorting systems.
- Pumps and Fans: High-power water pumps for product washing and extraction fans for dust control and ventilation.
Calculating Scope 2 emissions involves multiplying total electricity consumption in kilowatt-hours (kWh) by the standard UK grid emission factor for the relevant reporting year.
The Failure of Manual Spreadsheet Tracking in Sustainability Audits
Historically, many plants managed sustainability reporting by manually entering paper invoices into spreadsheets at year-end. This retrospective approach introduces significant regulatory and operational risks.
The Problem of Retroactive Utility Invoicing
Utility bills are retrospective and often rely on estimated readings. A monthly bill provides only a single aggregate figure, failing to show when or where energy was wasted. If a steam trap fails open on a cook line or a refrigeration compressor operates inefficiently during the first week of the month, the excess carbon is emitted long before the bill arrives. This lag prevents operational corrections and inflates the final SECR carbon footprint.
Data Gaps and Conversion Errors
Manual data entry invites human error. Transcription mistakes, misaligned units, and outdated carbon conversion factors can invalidate an entire report. Under SECR and ESOS audits, compliance teams must provide a clear, unbroken audit trail. If data points are missing or unsupported by direct evidence, the organisation faces potential non-compliance penalties from the UK Environment Agency. Automated reporting systems remove these risks by collecting data directly from physical meters.

Track energy consumption, emissions, and process parameters with seamless PLC/SCADA integration via Modbus, OPC-UA, and MQTT protocols.
Technical Architecture for Automated Data Acquisition
Automating food industry sustainability reporting requires a physical data capture architecture that interfaces with existing plant equipment without disrupting production.
Industrial Communications and Edge Gateways
Process engineers install edge gateways that communicate directly with existing Programmable Logic Controllers (PLCs), variable speed drives, and sub-meters. These gateways extract high-resolution consumption data using standard industrial communication protocols:
| Protocol | Application in Food Processing | Data Extracted |
|---|---|---|
| Modbus RTU/TCP | Dedicated electrical sub-meters, gas mass-flow meters, water meters | Voltage, current, active power (kW), cumulative energy (kWh), flow rate (m³/hr) |
| OPC-UA | Packaging lines, central SCADA databases, batch controllers | Machine state, product throughput, batch identifiers, operating temperatures |
| BACnet | Building management systems (BMS), HVAC, cold store cooling packs | Ambient temperature, relative humidity, compressor running hours |
| MQTT | Distributed wireless IoT sensors, steam trap sensors, vibration monitors | Surface temperature, acoustic vibration frequencies, valve status |
This architecture ensures continuous data extraction across six core utility streams: electricity, natural gas, water, steam, compressed air, and fuel oil.
Secure, Read-Only Integration to Protect Factory Controls
Information security is a primary concern when connecting industrial machinery to external networks. To protect the plant, the physical interface uses a secure, read-only data flow. The gateway initiates an outbound connection to the cloud analytics platform using encrypted protocols like HTTPS or secure MQTT over TLS, ensuring a strictly unidirectional data flow. Because the cloud platform cannot write back or issue control commands to the PLCs or SCADA systems, this zero-write architecture preserves factory safety, blocks unauthorised external intervention, and complies with Hazard Analysis and Critical Control Point (HACCP) and Good Manufacturing Practice (GMP) standards.
ISO 50001:2018 as a Framework for Continuous Performance

The ISO 50001:2018 energy management standard provides a structured framework for identifying, tracking, and reducing energy consumption. Implementing this standard relies on the Plan-Do-Check-Act (PDCA) cycle, which requires high-quality, real-time data to function.
Operationalising the PDCA Cycle
- Plan: Teams define the energy baseline and identify Significant Energy Uses (SEUs), such as refrigeration, steam boilers, and pasteurisers.
- Do: Deploy physical sub-meters connected to a central platform to capture granular, real-time utility data.
- Check: The cloud platform automatically evaluates consumption against baselines, using AI anomaly detection to flag issues like an inefficient refrigeration pack operating outside its optimal pressure range.
- Act: Maintenance teams perform targeted interventions (e.g. cleaning condenser coils). The platform then verifies the resulting savings, creating an evidence loop that supports continuous certification.
Achieving ESOS Exemption through ISO 50001
Under Phase 4 rules, an ISO 50001:2018 energy management system covering 100% of total consumption allows direct compliance declaration. This bypasses separate ESOS audits and the need for an external Lead Assessor. Automated utility tracking provides the continuous, audit-ready evidence required to maintain this certification, minimising administrative overhead and ensuring regulatory compliance.
Mapping Energy to Production: Calculating True Cost-Per-Tonne
Simple utility tracking fails to link operational efficiency to factory output; a drop in energy use might mean improved efficiency, or simply lower production volume. To resolve this, reporting must link utility consumption directly to production data.
Calculating Process-Specific Cost-Per-Tonne Metrics
Automated platforms integrate with the factory's Enterprise Resource Planning (ERP) or Manufacturing Execution System (MES) to map live utility use against specific production runs, batches, and weights. This calculates dynamic intensity metrics:
- Kilowatt-hours of electricity per tonne of frozen product.
- Cubic metres of natural gas per hectolitre of brewed beverage.
- Litres of water consumed per batch of prepared meals.
These indicators give production managers granular visibility. A spike in a blast freezer's electricity-per-tonne ratio, for instance, can flag a failing seal or iced evaporator coil. Fixing these faults early reduces both operating costs and Scope 2 emissions.
Granular Insights in Boiling, Steam Generation, and Cold Storage
Continuous monitoring isolates the footprints of individual high-consumption assets. For steam systems, the platform monitors feed-water temperature, flue gas temperature, and pressure to calculate boiler thermal efficiency continuously, highlighting scale build-up or burner misalignments that inflate Scope 1 emissions.
In cold storage, the platform correlates ambient external temperatures with refrigeration power to baseline cooling efficiency and flag thermal leakage from degraded insulation or open rapid-roll doors. By replacing manual, aggregate tracking with continuous, asset-specific analysis, food manufacturers can identify waste, reduce energy costs by 15% to 25%, and automate SECR-compliant environmental reports.
This article reflects the independent analysis and editorial opinion of EnerTherm Engineering. Product names, trademarks, and brands mentioned belong to their respective owners. EnerTherm Engineering is not affiliated with, endorsed by, or a licensee of any third-party software or product mentioned unless explicitly stated.

Technical Manager — EnerTherm Engineering
John Naranjo is Technical Manager at EnerTherm Engineering, bringing specialist expertise in chemical and environmental engineering. He recently led the implementation of Omni Vision, EnerTherm's real-time energy and utility monitoring platform. He holds an MSc in Environmental Engineering from the University of Huelva and a BSc in Chemical Engineering, with memberships in both the Energy Institute and IChemE.
