Tracking Specific Energy Consumption in Food Production
Using ISO 50006 and Specific Energy Consumption KPIs to meet UK Climate Change targets.
Energy intensity metrics for food production are quantitative indicators measuring energy consumed per unit of physical manufacturing output, typically expressed as kilowatt-hours per tonne of finished product.
Managing energy costs in the food and beverage sector requires analytical methods that extend far beyond tracking monthly utility invoices. Industrial bakeries, dairy processors, and bottling plants operate under highly variable conditions: shifting production schedules, fluctuating ambient temperatures, and diverse product lines. Without standardised, normalised metrics, tracking absolute changes in utility consumption can lead to incorrect operational conclusions. For instance, a drop in monthly electricity or natural gas use might be misinterpreted as an efficiency gain when it actually reflects a decline in production throughput.
The Fallacy of Absolute Energy Tracking
Absolute energy tracking registers only the total volume of utilities consumed over a given period. While these values are necessary for financial accounting and calculating Scope 1 and Scope 2 carbon emissions, they cannot isolate manufacturing plant efficiency.
If a processing plant reduces its natural gas consumption by 15 per cent during a low-demand quarter, the reduction may appear to be a successful energy-saving initiative. However, if physical production volume decreased by 25 per cent during that same period, the actual energy consumed per tonne of finished product increased. This indicates declining operational efficiency on the processing floor. Relying solely on absolute values masks critical equipment issues like short-cycling boilers, fouled heat exchangers, or degrading refrigeration compressors. Normalisation is therefore essential to isolate utility efficiency from shifts in production volume.
Defining Specific Energy Consumption (SEC)
Specific Energy Consumption (SEC) is the standard operational key performance indicator used in food manufacturing. It normalises energy data against production throughput, measuring how efficiently a plant converts utility inputs into finished goods.
Process engineers calculate SEC by dividing total energy inputs by physical production volume over a defined time interval. The standard mathematical expression is:
SEC=P∑Eiwhere:
- SEC is the Specific Energy Consumption, expressed in kilowatt-hours per tonne (kWh/tonne).
- Ei is the total energy input from utility stream i (such as electricity, natural gas, steam, or hot water) converted to equivalent kilowatt-hours (kWh) over the defined measurement period.
- P is the physical mass of compliant, finished production output in tonnes during that same period.
For discrete operations, such as bottling liquids, canning vegetables, or packaging individual confectionery units, engineers may express production volume P in thousands of units or completed batches.
The Role of Production Units and Batch Tracking
Applying a single, plant-wide energy metric to a multi-product facility can obscure operational inefficiencies. A dairy plant processing liquid milk, yoghurt, and cheese cannot rely on a single energy intensity metric. Cheese processing requires extensive thermal curdling and long-term cold storage, making it far more energy-intensive than liquid milk pasteurisation.
To maintain visibility, process engineers must implement sub-metering to track SEC at the individual processing line and batch level. Batch tracking links utility consumption directly to the run-time of a specific recipe. This granularity allows operators to identify when specific product runs or actions deviate from established efficiency baselines.
| Sector | Primary Production Unit | Typical Range (kWh/tonne) | Dominant Utility Streams |
|---|---|---|---|
| Fluid Milk Processing | Tonne of processed milk | 80 to 180 | Electricity, Steam, Chilled Water |
| Industrial Bread Baking | Tonne of baked product | 450 to 750 | Natural Gas, Electricity |
| Frozen Vegetable Processing | Tonne of packaged product | 350 to 600 | Electricity, Steam |
| Breweries | Hectolitre (hl) of product | 25 to 45 | Steam, Electricity, Carbon Dioxide |
| Confectionery Manufacturing | Tonne of finished sweets | 1,200 to 2,500 | Steam, Electricity, Compressed Air |

Omni Vision delivers turnkey utility metering, CO2 tracking, and AI-powered production KPI intelligence — giving you real-time dashboards and actionable insights across your entire facility.
Methodological Alignment with BS ISO 50006:2023
Evaluating energy performance across complex food processing facilities requires a structured framework. The international standard BS ISO 50006:2023 provides guidelines for establishing, using, and maintaining Energy Performance Indicators (EnPIs) and Energy Baselines (EnBs). This standard ensures that energy comparisons remain mathematically valid over time, even under fluctuating operational conditions.
Establishing Valid Energy Performance Indicators (EnPIs)
An EnPI is a quantitative measure of energy performance, whereas an EnB is a historical reference value used for comparison. Under BS ISO 50006:2023, simple energy-to-production ratios are only suitable if there is a direct, linear relationship passing through the origin.
In food manufacturing, this direct relationship rarely exists. Facilities carry significant base loads (fixed energy consumption) that remain constant regardless of throughput. These base loads include continuous facility lighting, ventilation, and idling refrigeration systems. To establish a mathematically valid baseline, engineers use linear regression models to separate fixed and variable energy loads:
E=Efixed+m⋅Pwhere:
- E is the total predicted energy consumption in kilowatt-hours (kWh) over a defined time interval.
- Efixed is the fixed baseline energy consumption, or base load, in kilowatt-hours, representing the energy consumed when production throughput is zero.
- m is the marginal energy coefficient, representing the variable energy required per unit of production (kWh/tonne).
- P is the production throughput in tonnes over the same time interval.
Evaluating efficiency using a simple ratio without isolating Efixed causes artificial spikes in energy intensity whenever production volumes drop. This occurs because the fixed base load is distributed over a smaller volume of finished product.
Accounting for Relevant Variables and Static Factors
A key requirement of BS ISO 50006:2023 is the normalisation of baselines. Operational parameters that fluctuate and influence energy use are classified as relevant variables. In food production, these include:
- Production Throughput: The physical mass or unit count processed during a shift.
- Raw Material Characteristics: Variations in raw product moisture content (such as grain milling) or incoming raw milk temperature.
- Ambient Weather Conditions: Wet-bulb and dry-bulb air temperatures, which directly affect the coefficient of performance (COP) of industrial refrigeration chillers.
- Product Mix Shifts: Changes in the proportion of energy-intensive products versus standard products within the facility.
Static factors are facility parameters that do not routinely change but still affect energy use, such as physical factory footprint, the number of weekly shifts, or the installed motor capacity of a processing line. If a static factor changes—such as through the installation of a new high-speed packaging line—the energy baseline must be adjusted to maintain comparison accuracy.
Identifying Significant Energy Uses (SEUs)
ISO 50001 and BS ISO 50006:2023 require organisations to identify their Significant Energy Uses (SEUs). These are the specific systems, processes, or equipment that account for a high proportion of total energy consumption, or offer substantial potential for efficiency improvements.
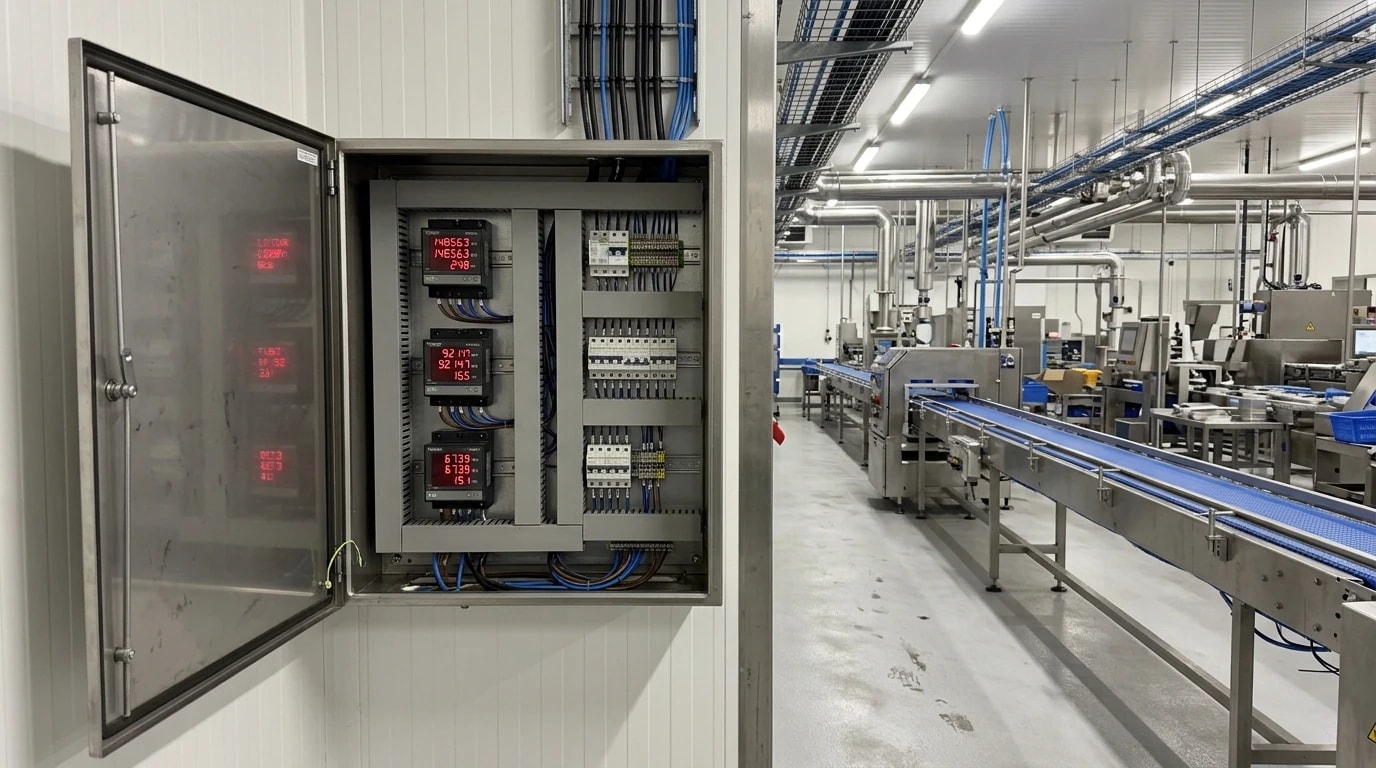
In food and beverage manufacturing, SEUs typically include industrial refrigeration plants, steam boiler systems, clean-in-place (CIP) loops, and compressed air networks. Implementing targeted sub-metering on these systems is necessary to isolate their performance from the overall utility consumption of the facility.
Regulatory and Financial Drivers under the UK CCA Scheme Phase 3
The financial incentive for implementing precise energy intensity metrics for food production is closely linked to regulatory compliance in the United Kingdom. On 1 January 2026, the UK government implemented the new Climate Change Agreements (CCA) scheme (often referred to as Phase 3 or CCA3). This voluntary scheme allows energy-intensive businesses to secure substantial relief from the Climate Change Levy (CCL).
The Impact of the Climate Change Levy (CCL)
The Climate Change Levy is a tax added to non-domestic energy supplies in the UK. For food and beverage processors operating with thin profit margins, the CCL represents a substantial operating expenditure.
By participating in a voluntary CCA administered through the Food and Drink Federation (FDF), eligible manufacturing facilities can claim a levy discount of up to 92 per cent on electricity and up to 89 per cent on natural gas. This tax relief can save a medium-to-large food manufacturing facility tens of thousands of pounds annually.
Target Performance and the Transition to Facility-Level Tracking
A key structural update in the 2026 CCA Phase 3 scheme is the removal of target "bubbles". Previously, operators could group multiple business facilities together and agree on a combined, averaged target. Under Phase 3, all targets are set and evaluated strictly at the individual facility level.
This regulatory change prevents high-performing plants from masking the inefficiencies of other sites, making site-specific energy normalisation a strict requirement for maintaining tax certification.
The Novem Adjustment Methodology
To maintain compliance under the CCA scheme, manufacturers must meet pre-negotiated targets for improving energy efficiency. However, shifts in product mix can easily skew a facility's overall energy intensity. To resolve this, the UK Environment Agency utilises the Novem adjustment methodology.
The Novem approach calculates a facility's target energy consumption based on the specific mix of products manufactured during the reporting period. It calculates the fixed and variable energy consumption for each product group. For example, if an industrial bakery shifts its production from standard white loaves to energy-intensive gluten-free recipes, the Novem methodology adjusts the target baseline energy upward. This adjustment ensures the manufacturer is not penalised for a legitimate change in market demand.
Target Period Accounting and Buyout Obligations
Under the 2026 scheme, targets are evaluated across three strict target periods:
- Target Period 7: 1 January 2026 to 31 December 2026
- Target Period 8: 1 January 2027 to 31 December 2028
- Target Period 9: 1 January 2029 to 31 December 2030
Food producers must submit accurate, normalised energy consumption reports at the end of each target period. If a facility fails to meet its energy intensity target, it must pay a carbon buyout fee of £25 per tonne of carbon dioxide equivalent (tCO2e) shortfall to maintain its eligibility for the CCL discount.
Normalising energy data against production throughput is essential for accurately reporting performance and claiming these levy discounts. Without accurate, sub-metered data, manufacturers risk over-reporting their energy intensity, resulting in avoidable buyout fees or the loss of their CCL discount certification.

Track energy consumption, emissions, and process parameters with seamless PLC/SCADA integration via Modbus, OPC-UA, and MQTT protocols.
Hardware Integration and Physical Data Architecture
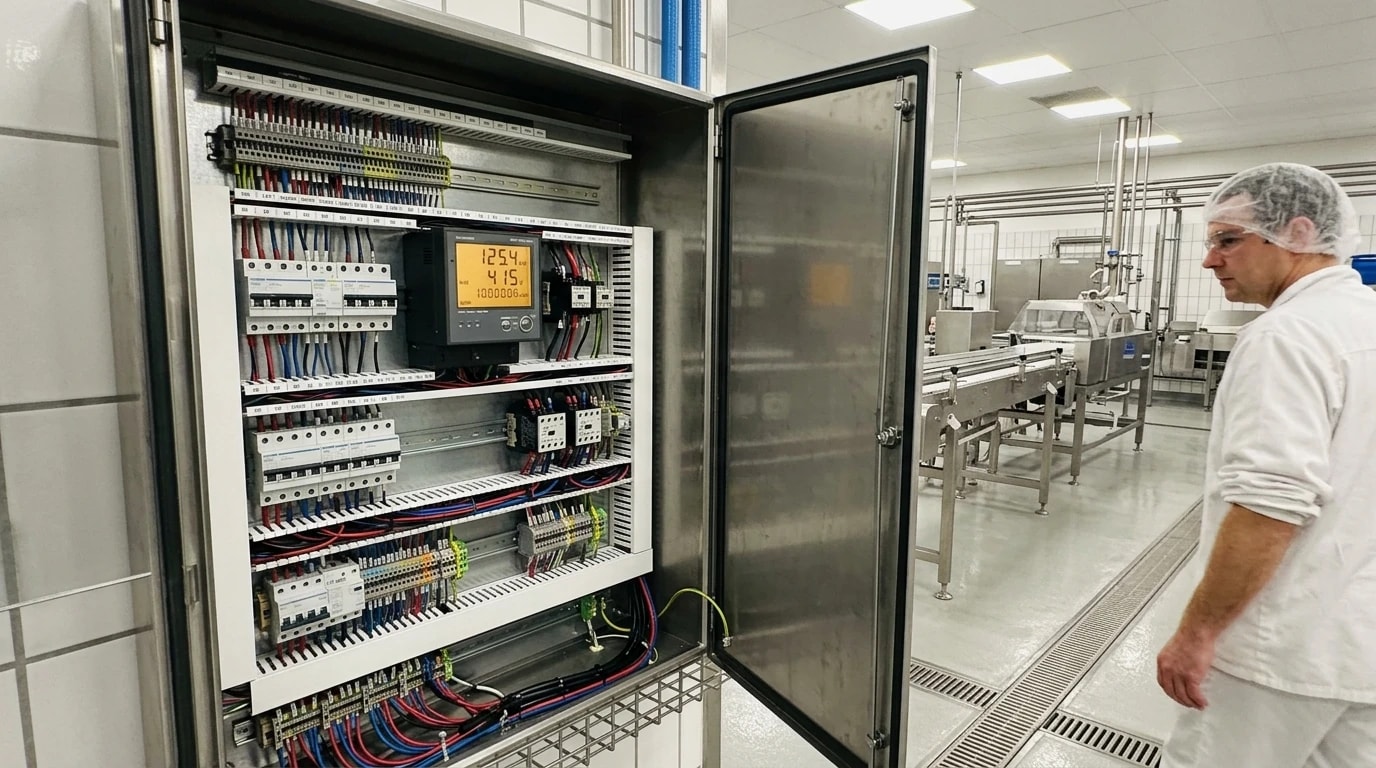
Transitioning from manual, spreadsheet-based utility tracking to automated, real-time monitoring requires a structured physical hardware implementation. Deploying an energy monitoring network on an active food production floor requires a multi-tiered architecture that respects both electrical standards and strict food safety regulations.
Physical Sub-Metering Implementation
Data collection begins with the installation of dedicated sub-meters on high-consumption assets and utility lines. Process engineers typically install:
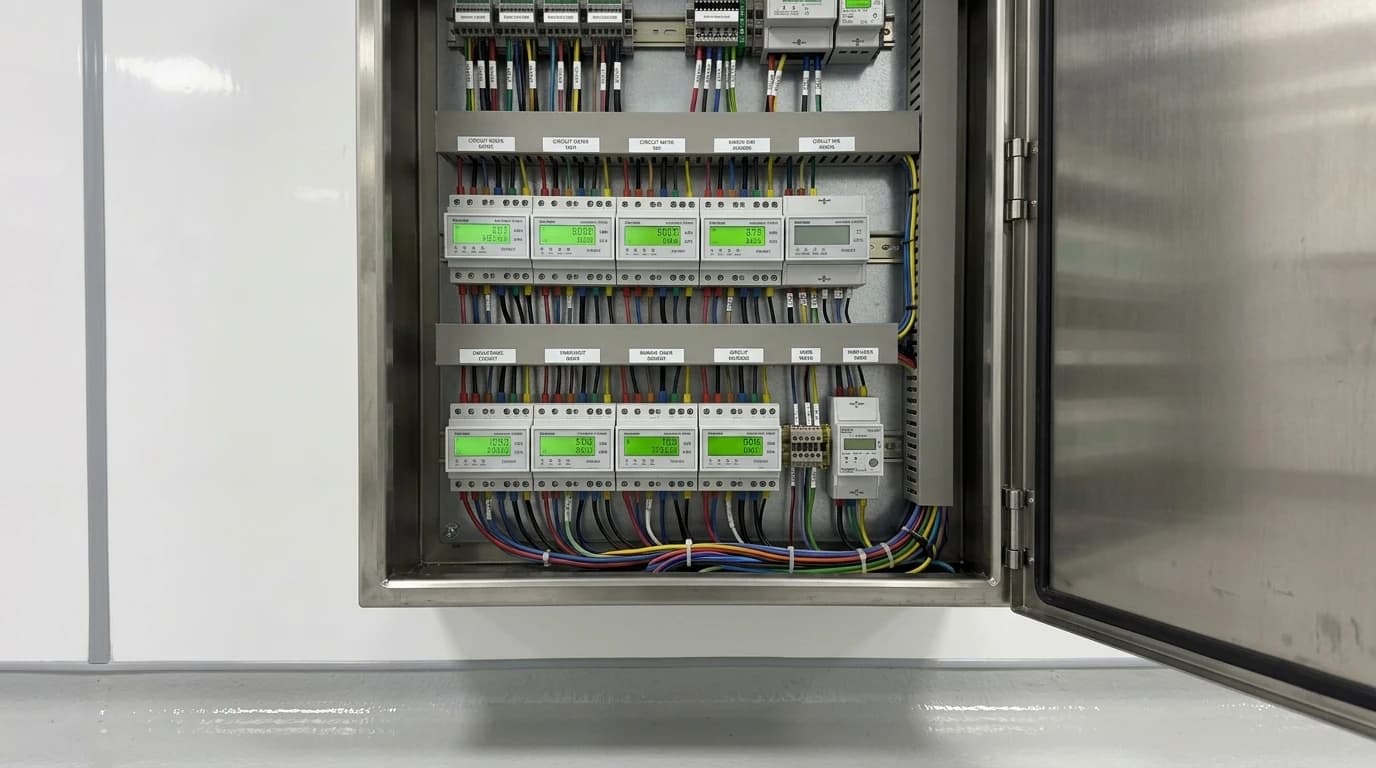
- Electrical Meters: Measuring Instruments Directive (MID) approved power meters fitted with split-core current transformers (CTs) inside electrical distribution boards.
- Water and Cleaning Fluids Flowmeters: Electromagnetic flowmeters installed directly into process water lines.
- Steam Flowmeters: Inline vortex shedding flowmeters with integrated temperature and pressure compensation to measure mass flow.
- Compressed Air Flowmeters: Thermal dispersion mass flowmeters installed on the discharge lines of air compressors.
These physical devices capture raw usage data and transmit it via wired serial or Ethernet connections to local data acquisition hubs.
Non-Invasive Data Capture and Hardware Isolation
Industrial food manufacturing environments operate under strict Hazard Analysis Critical Control Point (HACCP) and Good Manufacturing Practice (GMP) standards. Consequently, any physical connection to the plant's existing Programmable Logic Controllers (PLCs) or Supervisory Control and Data Acquisition (SCADA) systems must be carefully designed.
To prevent communication interference or safety hazards, this connection must be completely read-only. Process engineers achieve this by deploying industrial edge gateways configured with hardware-isolated communication interfaces, including:
- Optoelectronic Isolators (Optocouplers): Physical couplers that transmit data using light waves across an air gap, preventing electrical feedback or surges from travelling between networks.
- Serial-to-Ethernet Bridges with Hardware-Strapped Read-Only Pins: Physical pins on the communication ports are grounded or disconnected to prevent write signals from passing back to the process automation network.
These hardware-enforced read-only pathways ensure that the energy monitoring system cannot transmit control commands or alter PLC registers. This maintains the operational integrity of critical control points, pasteurisation holding times, and hygiene cycles. Common read-only communication protocols used for these connections include Modbus TCP, Modbus RTU, OPC-UA, BACnet, and MQTT.
Hygienic Panel Construction and IP65 Enclosures
The physical environment of a food manufacturing plant is challenging for electronics. Processing areas are subject to frequent washdowns using high-temperature water, chemical detergents, and sanitising agents.
To protect the energy monitoring gateways, isolation devices, and network switches, all components must be housed in dedicated electrical panels. Typical panel installations require:
- IP65 or IP69K Stainless Steel Enclosures: Sloped-roof cabinets designed to prevent water accumulation and eliminate pooling areas where bacteria could grow.
- Hygienic Cable Glands: Food-grade blue silicone seals that prevent water ingress during high-pressure washdowns.
- Vibration-Resistant DIN-Rail Mounts: Ensuring that electrical connections remain secure on panels mounted close to high-vibration equipment like homogenisers or packaging lines.
Adhering to these physical design standards allows the monitoring hardware to operate reliably in hot, humid washdown areas or cold storage environments.
Specific Thermodynamic Challenges in Food Processing Assets
Each sector within the food and beverage industry faces distinct thermodynamic and operational challenges that affect how energy intensity metrics for food production are defined and normalised.
Industrial Refrigeration and Cooling Degree Days
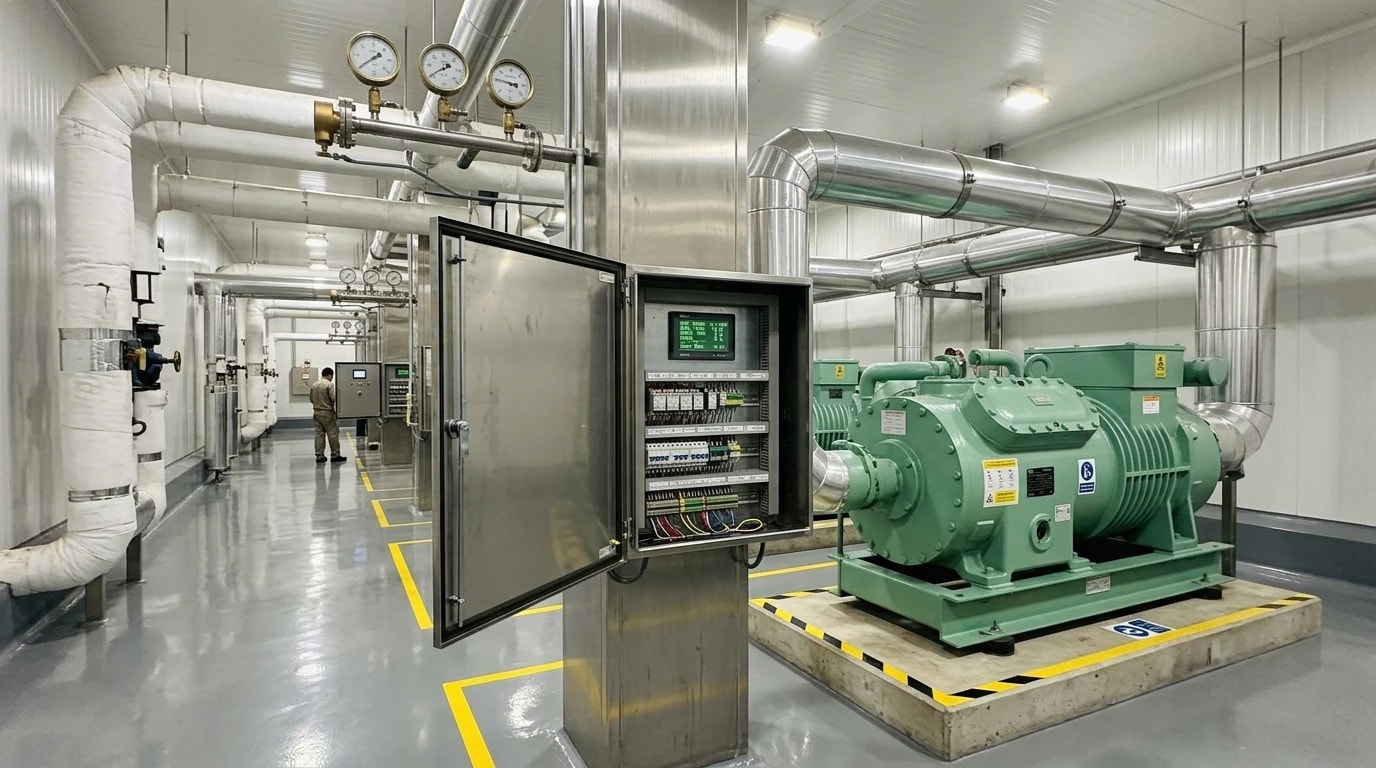
Refrigeration is typically the largest consumer of electrical energy in cold storage, frozen food, and dairy processing facilities. Unlike process equipment that runs only during active shifts, cold stores must operate continuously to maintain food safety.
The energy consumption of an industrial ammonia (NH3) or carbon dioxide (CO2) refrigeration plant is highly dependent on ambient weather conditions, cold store door-opening frequency, and the thermal load of incoming warm product. Consequently, a simple "kWh per tonne of stored product" metric is misleading.
In summer, a refrigeration compressor requires significantly more electrical power to maintain a freezer at −22 °C than it does in winter, even if the inventory volume remains unchanged. To normalise this baseline, engineers use multi-variable linear regression models that incorporate Cooling Degree Days (CDD) alongside throughput volume:
Erefrigeration=Ebase+β1⋅P+β2⋅CDDwhere:
- Erefrigeration is the total electrical energy consumed by the refrigeration plant (kWh).
- Ebase is the energy required to maintain the cold store temperature under zero-production conditions (kWh).
- β1 is the energy coefficient per tonne of incoming product (kWh/tonne).
- P is the mass of incoming product in tonnes.
- β2 is the energy coefficient per cooling degree day (kWh/CDD).
- CDD is the number of cooling degree days over the measurement period.
This normalisation isolates compressor mechanical efficiency from seasonal weather variations, allowing maintenance teams to identify refrigerant leaks or valve wear.
Thermal Operations and Steam Boiler Efficiency
Steam is the primary utility used for pasteurisation, blanching, cooking, and clean-in-place (CIP) operations. Many facilities track boiler house efficiency using utility-side metrics, such as the volume of steam generated per cubic metre of natural gas consumed. While useful, this metric only measures utility conversion, not how efficiently that steam is used on the production floor.
To calculate accurate process-end SEC, steam flowmeters must be installed on individual processing lines and matched with PLC run-time signals. This allows engineers to split steam consumption into fixed and variable loads:
- Fixed Startup Load: The thermal energy required to heat a pasteuriser or oven from room temperature to its operating setpoint before production begins.
- Variable Production Load: The steam consumed directly to heat the product during continuous throughput.
If a plant operates with low capacity utilisation or runs short, frequent batches, the fixed startup energy represents a higher proportion of the total steam consumed. This drives up the overall SEC. Separating these loads allows plant managers to optimise scheduling. Running longer production campaigns at steady-state throughput reduces the fixed thermal losses per tonne of finished product.
Clean-in-Place (CIP) Energy Tracking
Hygiene is paramount in food manufacturing, and CIP cycles consume significant quantities of water, steam, and electricity. CIP energy consumption is largely independent of production throughput, consisting of pre-programmed, timed cycles of rinses, chemical washes, and sanitising rinses that must occur at scheduled intervals regardless of whether a line ran at 50 per cent or 100 per cent capacity.
Therefore, normalising CIP energy performance requires tracking energy consumption per wash cycle rather than per tonne of product. If a facility increases its product changeover frequency to meet short-term customer demands, the total energy consumed by CIP systems will rise. By mapping CIP utility data (steam flow to heat exchangers, water volume, and electrical pump power) directly to individual cleaning cycles, process engineers can identify cycle overruns, clogged nozzles, or heat exchanger fouling. This ensures that hygiene standards are maintained without wasting thermal energy.
Data Normalisation and Corporate Compliance Auditing
Implementing automated, normalised tracking of energy intensity metrics for food production simplifies compliance with UK and European environmental and energy disclosure frameworks.
Simplifying SECR and ESOS Audits
Under the UK's Streamlined Energy and Carbon Reporting (SECR) framework, large undertakings must disclose their annual greenhouse gas emissions, total energy use, and at least one intensity ratio. Similarly, the Energy Savings Opportunity Scheme (ESOS) requires comprehensive energy audits every four years.
Manual spreadsheet tracking is prone to calculation errors, missing data, and inconsistent normalisation methodologies, which increases administrative overhead during audits. An automated data acquisition system that continuously records normalised SEC metrics provides an audit-ready historical database. Auditors can easily verify:
- The raw data sources (utility meters and PLC production signals).
- The regression models used for normalisation.
- The resulting intensity ratios.
This high level of data transparency reduces the time required to complete external audits and minimises the risk of non-compliance penalties.
Alleviating Scope 1 and Scope 2 Emissions Reporting
Beyond regulatory compliance, food manufacturers face growing pressure from retail customers to disclose and reduce their carbon footprints. Processing emissions (Scope 1 from onsite fuel combustion, and Scope 2 from purchased electricity) are under the direct control of the manufacturer.
By establishing accurate, normalised Scope 1 and Scope 2 emissions profiles linked to specific products, food manufacturers can provide verified carbon intensity data to retail partners. For example, a bakery can demonstrate that its bread has a processing carbon intensity of 0.12 kg CO₂e per loaf, backed by real-time, sub-metered utility data. This capability serves as a powerful competitive advantage in an industry where major retailers actively seek to optimise their supply chain carbon footprints.
This article reflects the independent analysis and editorial opinion of EnerTherm Engineering. Product names, trademarks, and brands mentioned belong to their respective owners. EnerTherm Engineering is not affiliated with, endorsed by, or a licensee of any third-party software or product mentioned unless explicitly stated.

Simulation Engineer — EnerTherm Engineering
Rajesh Sekar is a Simulation Engineer at EnerTherm Engineering, specialising in computational fluid dynamics (CFD), finite element analysis (FEA), and thermal process simulation. He holds a degree from Cranfield University and brings extensive experience in simulation-based product development from the automotive, aerospace, and energy sectors.
