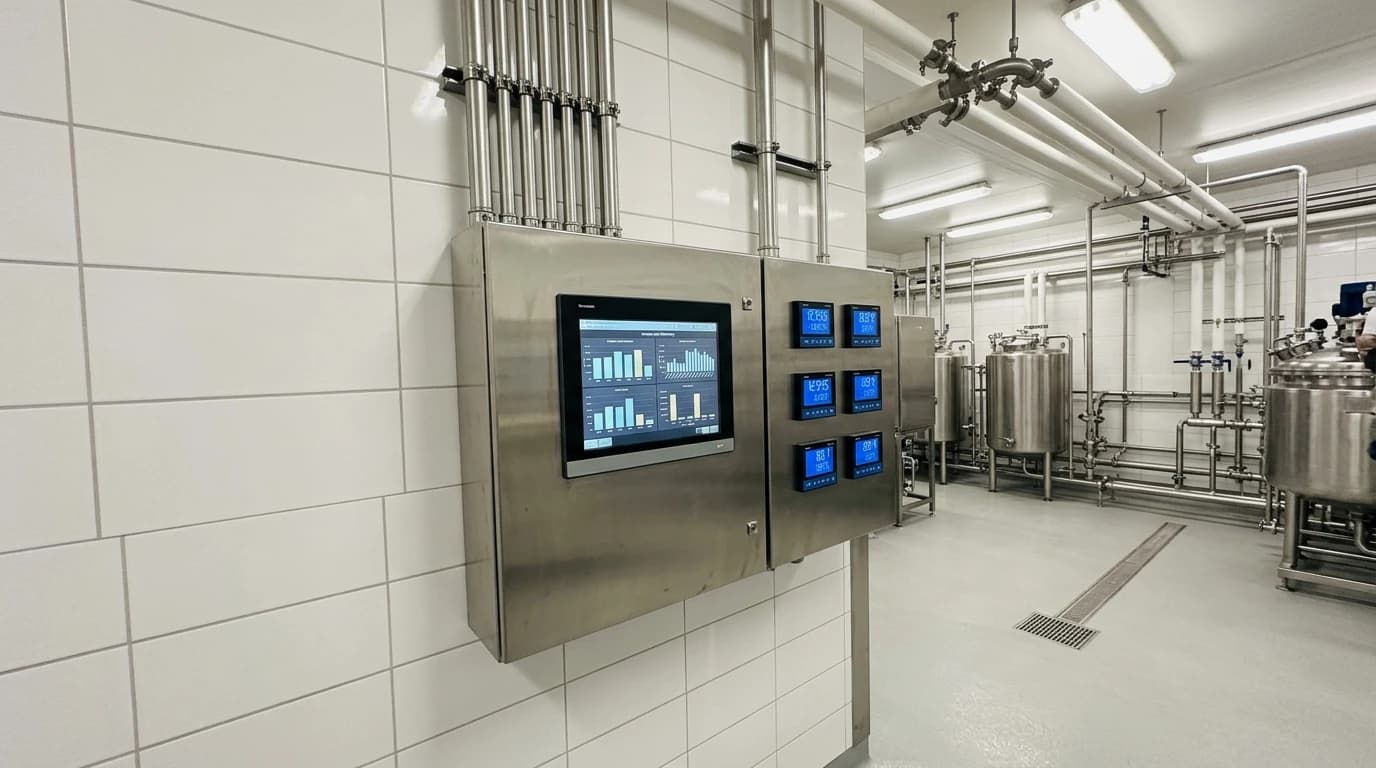
How Food Plants Automate SECR Carbon Reporting
How tracking energy-per-tonne KPIs cuts emissions by 15-25% to meet ISO 50001.
Large unquoted food-processing companies in the United Kingdom must comply with the Streamlined Energy and Carbon Reporting (SECR) framework. Under The Companies (Directors' Report) and Limited Liability Partnerships (Energy and Carbon Report) Regulations 2018, UK-registered businesses meeting specific size thresholds must report their Scope 1 and Scope 2 emissions within their annual Directors' Report. Qualifying organisations are those meeting at least two of the following criteria: an annual turnover of £36 million or more, a balance sheet total of £18 million or more, or 250 or more employees.
Understanding SECR Obligations in Food and Beverage Manufacturing
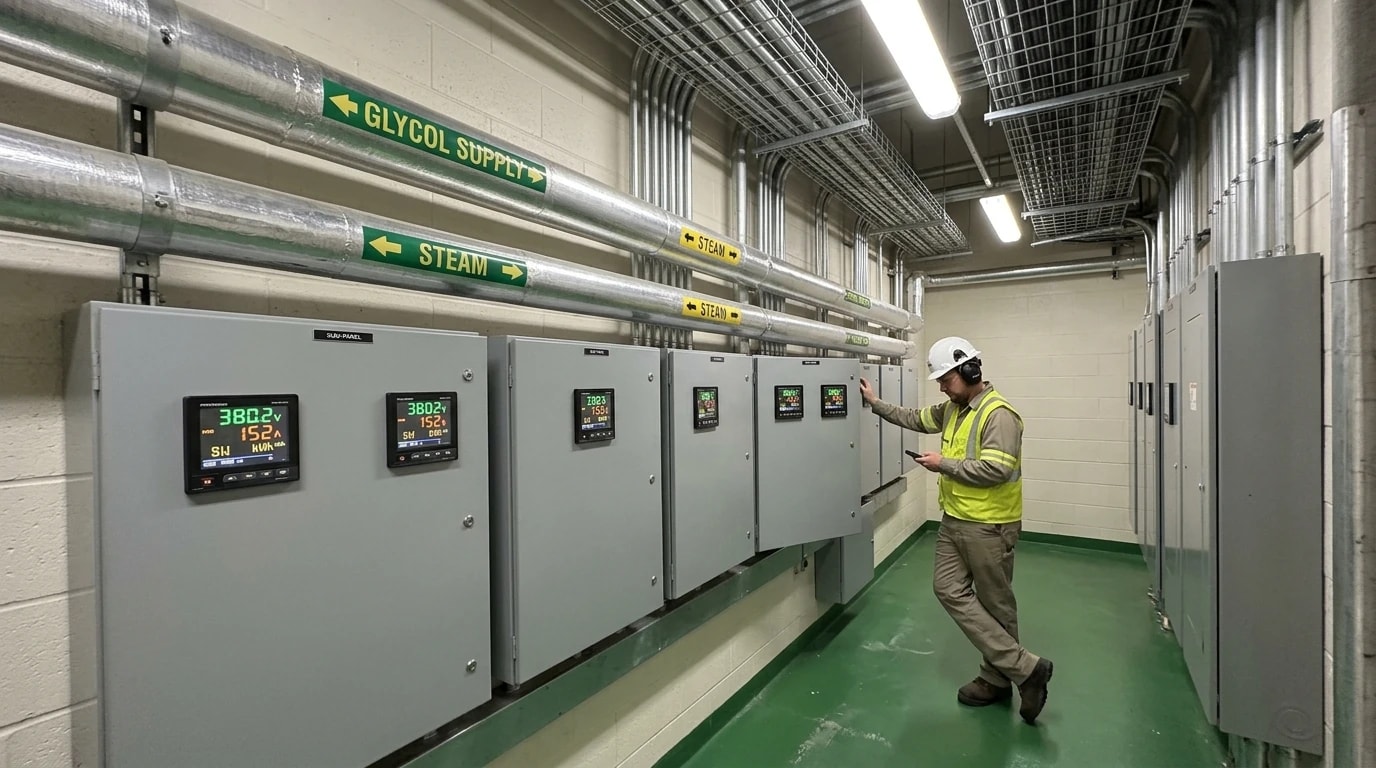
For food plants, SECR demands precise tracking of direct emissions (Scope 1) and indirect emissions from imported energy (Scope 2). Direct emissions arise from the combustion of natural gas in boilers, fuel used in logistics fleets, and fugitive refrigerant losses from cold stores. Indirect emissions stem from purchased electricity used to run heavy process machinery, mixers, and refrigeration compressors.
Traditional tracking relies on monthly utility bills, which introduce errors and significant administrative lag. Arriving weeks after consumption, these bills prevent plant managers from linking emissions spikes back to specific operational inefficiencies or equipment faults.
The Limits of Spreadsheet Tracking
Relying on manual spreadsheets to compile SECR reports carries substantial operational risks. Manual entry of meter data frequently results in transcription errors, while static sheets lack the verified audit trail required by third-party auditors. Without continuous telemetry, food manufacturers cannot establish dynamic carbon baselines or identify immediate carbon-saving opportunities on the factory floor.
The Requirements for SECR Compliance
To achieve full compliance, qualifying food manufacturers must disclose:
Total UK energy use, covering electricity, gas, and transport fuel.
Associated Scope 1 and Scope 2 emissions in tonnes of CO₂ equivalent (tCO₂e).
At least one relevant intensity ratio linking emissions to a business metric.
A narrative description of principal energy efficiency measures taken during the financial year.
The methodology used to calculate the emissions.
Calculations must align with recognised standards, such as the GHG Protocol Corporate Standard, using conversion factors published annually by the Department for Energy Security and Net Zero (DESNZ).

Omni Vision delivers turnkey utility metering, CO2 tracking, and AI-powered production KPI intelligence — giving you real-time dashboards and actionable insights across your entire facility.
The Intersection of SECR, CSRD, and ISO 50001:2018 Standards
UK food manufacturing plants operating across European markets or supplying multinational retailers must also align with the European Union's Corporate Sustainability Reporting Directive (CSRD). The CSRD mandates detailed ESG disclosures, including Scope 1, 2, and 3 emissions, subject to mandatory third-party assurance. Consequently, UK manufacturers must establish a unified data infrastructure capable of serving both SECR filings and European sustainability reports simultaneously.
Integrating ISO 50001:2018 Energy Management Systems
Implementing the global ISO 50001:2018 standard provides food plants with a systematic framework to continuously improve energy performance. This standard requires companies to define Energy Performance Indicators (EnPIs) and establish Energy Baselines (EnBs). For food manufacturers, these baselines must account for production variations to remain accurate and comparable.
Conformance with HACCP Guidelines
Optimising energy performance in a food facility must never compromise food safety. Industrial processes must strictly adhere to Hazard Analysis Critical Control Point (HACCP) protocols. High-energy systems, such as pasteurisers, sterilisers, and blast freezers, operate under rigid parameters to eliminate microbiological risks. To bridge the gap between safety and efficiency, process engineers integrate real-time carbon monitoring directly with PLC telemetry. This integration allows the plant to track utility consumption without altering validated safety parameters, ensuring complete HACCP compliance.
Technical Architecture for Secure PLC Data Ingestion
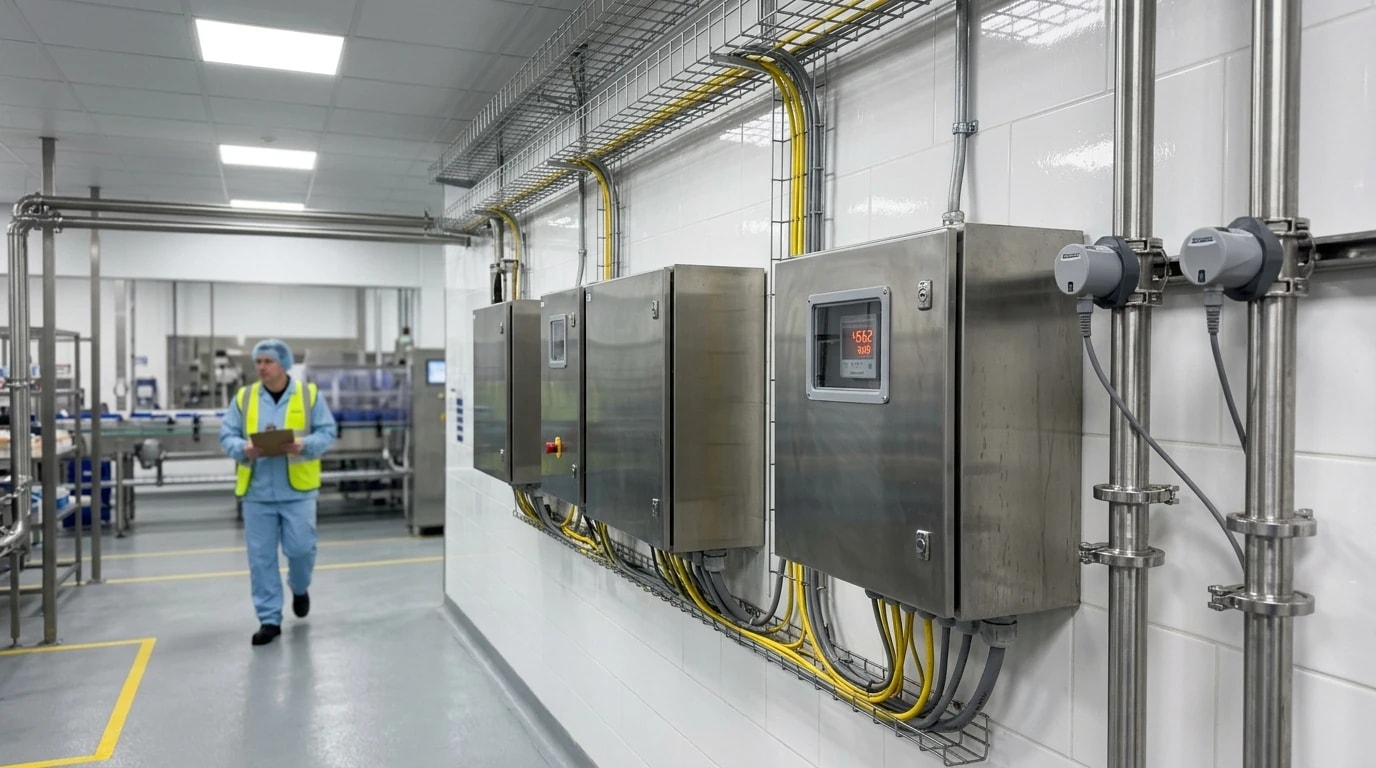
Automating carbon reporting requires extracting real-time utility data directly from the factory floor without disrupting production. The Omni Vision Energy Intelligence Platform, developed by EnerTherm Engineering in collaboration with EPSA's cloud-based AI analytics engine, achieves this through a non-invasive, secure telemetry architecture.
Non-Invasive Hardware Integration
To monitor utility consumption without halting continuous production lines, installation teams deploy physical sub-meters and non-invasive sensors. Engineers install clamp-on ultrasonic flowmeters to measure steam, hot water, and chilled water loops. For electrical networks, current transformers (CTs) clip around existing power lines to capture real-time current draw across high-consumption processes.
Protocol Interoperability and Process Security
The platform integrates directly with existing programmable logic controllers (PLCs) and supervisory systems. Automation engineers configure secure, read-only connections using established industrial communication protocols, including:
Modbus for power meters and discrete utility sensors.
OPC-UA for secure, platform-independent connection to legacy PLCs.
BACnet for integrating building management systems and HVAC networks.
MQTT for lightweight, encrypted data transfer from the edge to the cloud.
This technical architecture maintains a strictly one-way, encrypted data flow. Because the platform has zero write access to the plant's control systems, it cannot alter process recipes or safety configurations.

Track energy consumption, emissions, and process parameters with seamless PLC/SCADA integration via Modbus, OPC-UA, and MQTT protocols.
Mapping Energy to Production: Calculating the Energy-Per-Tonne KPI
The core of modern industrial decarbonisation involves mapping raw energy consumption to actual production output. To generate a meaningful SECR disclosure, companies must report a carbon intensity metric alongside absolute emissions figures. For food manufacturers, the most verifiable intensity metric is emissions-per-tonne of finished product.
The Carbon Intensity KPI Formula
To calculate this dynamic metric, the platform uses an established, verifiable relationship that links total greenhouse gas emissions to physical production volume:
IC=PvolumeECO2e
Where:
IC is the carbon intensity KPI, expressed in kilograms of carbon dioxide equivalent per tonne of product (kgCO₂e/t).
ECO2e represents the total Scope 1 and Scope 2 emissions in kilograms of carbon dioxide equivalent (kgCO₂e) calculated over the reporting period.
Pvolume represents the total volume of finished food product manufactured during the same period, measured in metric tonnes (t).
Synchronising Telemetry with ERP and MES Systems
Calculating this KPI continuously requires integrating utility telemetry with operational software. The Omni Vision platform automatically pulls production schedules, batch numbers, and recipe data from the facility's Manufacturing Execution System (MES) and Enterprise Resource Planning (ERP) databases.
By merging these datasets, EPSA's AI engine assigns precise energy quantities to specific product batches. For example, the system can calculate the exact steam cost of pasteurising a single batch of dairy or the electrical cost of packaging a tonne of confectionery. This transforms utility consumption from an unmanaged overhead into a highly visible, batch-linked variable.
AI-Driven Carbon Footprint Reduction Strategies for Food Plants
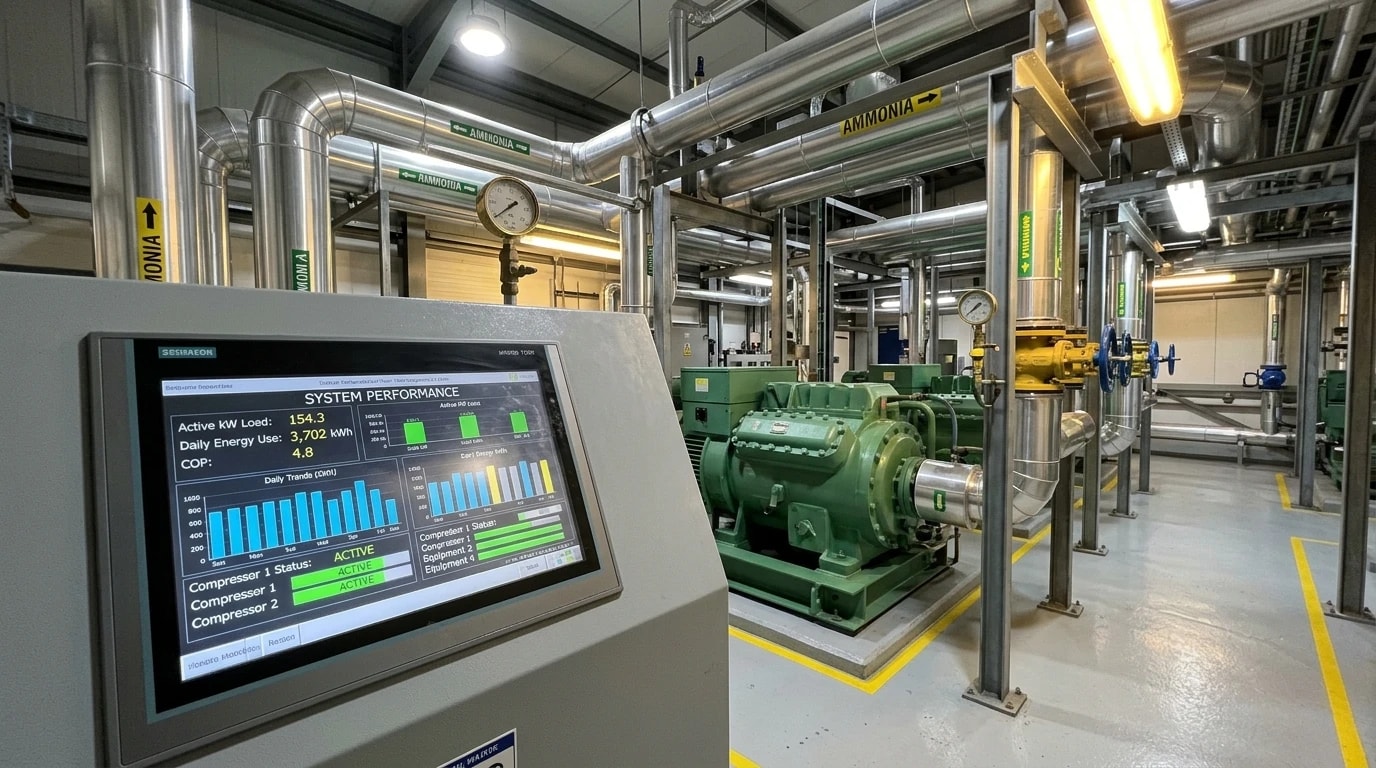
Tracking emissions is only the first step toward compliance; food plants must actively implement reduction strategies to meet national Net Zero targets. By utilising EPSA's cloud-based AI engine, facilities can deploy targeted operational strategies that yield rapid, verifiable carbon reductions.
Optimising Industrial Refrigeration Systems
Refrigeration systems, including cold stores, spiral freezers, and ammonia chillers, typically consume the highest share of electricity in food plants. EPSA's AI analytics continuously monitor performance by tracking suction pressures, discharge temperatures, and compressor sequencing. The algorithms identify efficiency anomalies like compressor short-cycling or evaporator coil icing. Flagging these issues allows maintenance teams to intervene early, preventing energy spikes and preserving capacity while protecting food safety standards.
Steam and Boiler Efficiency Optimisation
Steam is the primary utility for thermal pasteurisation, cooking, and Clean-in-Place (CIP) systems, but steam loops suffer from significant thermal losses. The Omni Vision platform monitors fuel input, steam flow, and condensate return temperatures in real time. By analysing these parameters, the AI identifies boilers operating at sub-optimal air-to-fuel ratios, enabling maintenance teams to adjust burner settings. These targeted adjustments reduce natural gas consumption and direct Scope 1 emissions.
Clean-in-Place (CIP) Energy Tracking
CIP cycles are highly energy-intensive and water-intensive. EPSA's AI engine monitors temperature profiles and flow rates during each wash phase. By comparing different sanitation runs, the system identifies cycles that exceed their validated duration or temperature settings, enabling operations teams to adjust CIP parameters. This reduces both gas (used for water heating) and water consumption.
Early Fault Detection
The platform's predictive forecasting models detect system anomalies before they lead to equipment failure. For example, a small leak in a compressed air valve or a stuck steam trap can waste thousands of kilowatt-hours if left unnoticed. The AI engine flags these minor deviations, allowing maintenance engineers to schedule repairs during scheduled downtime rather than reacting to catastrophic failures.
Utility StreamPrimary Process ApplicationsTypical Optimisation ActionsImpact on Emissions CategoryElectricityCompressors, pumps, mixers, conveyors, packaging linesRecommending compressor sequencing, installing VSDs, scheduling peak tariff avoidanceScope 2 (Indirect Grid Electricity)Natural GasBoilers, direct-fired ovens, space heatingTuning burner air-to-fuel ratios, recovering heat from flue gasScope 1 (Direct Fuel Combustion)SteamPasteurisation, cooking, CIP sterilisationReplacing faulty steam traps, insulating condensate return linesScope 1 (Gas consumed in boilers)Compressed AirPneumatic valves, sorting, product blow-offReducing system pressure, detecting and repairing air leaksScope 2 (Electricity for air compressors)WaterIngredient mixing, product cooling, washdownsAdjusting CIP sequences, refining cooling tower blowdown controlScope 3 (Indirect water treatment emissions)
Turnkey Deployment: Moving from Spreadsheets to Centralised Intelligence
Transitioning an active food manufacturing facility from manual spreadsheets to automated, centralised energy intelligence can feel daunting. To minimise operational disruption, EnerTherm Engineering delivers the entire platform through a standardised 8 to 16 week turnkey deployment model.
The Turnkey Implementation Roadmap
The implementation roadmap consists of five clear phases:
Site Survey and Mapping: Engineering teams conduct a detailed audit of the plant's electrical, gas, steam, water, and compressed air distribution systems to select optimal monitoring locations.
Panel Design and Instrumentation: Engineers design and build bespoke electrical panels, select clamp-on and inline instrumentation, and plan the physical installation.
Non-Invasive Integration: Installation technicians mount physical sub-meters and connect the edge gateways to the existing PLCs via read-only protocols, requiring zero production downtime.
Cloud Commissioning: Engineers route the encrypted telemetry stream to EPSA's cloud platform, configuring custom dashboards and setting up automated reports.
Continuous Optimisation: Plant operators use real-time dashboards to track energy-per-tonne KPIs, receive anomaly alerts, and export audit-ready SECR and ISO 50001 reports.
Realising Financial and Operational Returns
Deploying this automated system eliminates the administrative burden of manually compiling SECR reports. More importantly, identifying and eliminating utility waste consistently delivers 15 to 25 per cent energy cost reductions. With rising energy tariffs and increasing carbon taxes, these savings typically secure a full return on investment (ROI) in under 12 months. By automating emissions reporting, food plants protect their regulatory compliance while driving real progress toward industrial decarbonisation.
This article reflects the independent analysis and editorial opinion of EnerTherm Engineering. Product names, trademarks, and brands mentioned belong to their respective owners. EnerTherm Engineering is not affiliated with, endorsed by, or a licensee of any third-party software or product mentioned unless explicitly stated.

Technical Manager — EnerTherm Engineering
John Naranjo is Technical Manager at EnerTherm Engineering, bringing specialist expertise in chemical and environmental engineering. He recently led the implementation of Omni Vision, EnerTherm's real-time energy and utility monitoring platform. He holds an MSc in Environmental Engineering from the University of Huelva and a BSc in Chemical Engineering, with memberships in both the Energy Institute and IChemE.
