Energy Mass Balance Mapping Finds Chemical Plant Losses
How reconciled fuel, steam and material flows expose losses by process area.
Energy and mass balance mapping is a control-volume accounting method that reconciles material and energy entering, leaving and accumulating within a defined chemical process area to identify physical losses and data gaps.
A distillation unit may record stable steam demand while a solvent balance shows 4 t/d unaccounted for. That residual could represent vent losses, solvent in wastewater, an inventory error or a faulty meter. Until engineers reconcile it, a fuel-saving project rests on assumption rather than evidence.
Site utility data reports total gas and electricity purchased. Energy mass balance mapping assigns utilities, feedstocks and outputs to physical process boundaries, then tests whether the numbers close. It helps chemical process engineers rank efficiency projects, reduce material loss and support capital decisions.
What energy mass balance mapping measures
Separate component balances from energy balances
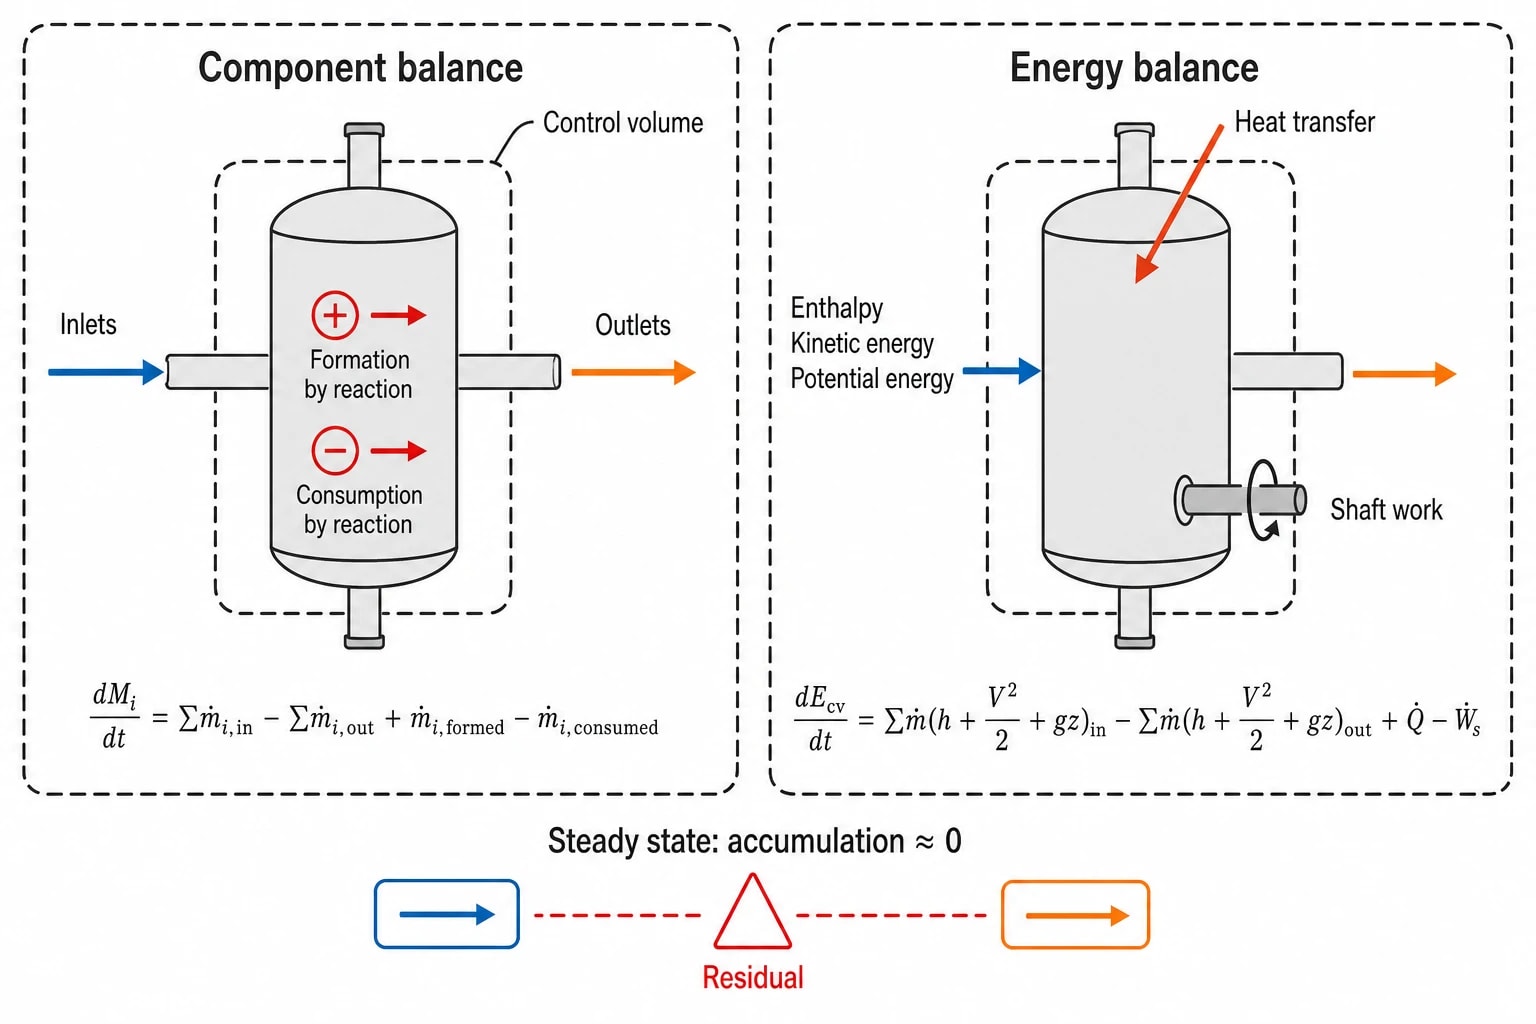
A component balance tracks a named material, such as solvent, hydrogen, water or a monomer. Chemical reaction can form or consume that component, although total mass remains conserved.
dtdMi=in∑m˙i−out∑m˙i+m˙i,formed−m˙i,consumedHere, Mi is the mass of component i held within the control volume; m˙i is its mass flow rate; and the final two terms describe formation and consumption by reaction. At steady state, the accumulation term approaches zero over a suitable averaging period.
An energy balance uses a different structure. Flowing streams carry enthalpy across the boundary, while heat transfer and shaft work cross it separately.
dtdEcv=in∑m˙(h+2V2+gz)−out∑m˙(h+2V2+gz)+Q˙−W˙sHere, Ecv is energy stored in the control volume, h is specific enthalpy, V is stream velocity, g is gravitational acceleration, z is elevation, Q˙ is heat transferred into the control volume and W˙s is shaft work leaving it. Most plant energy maps can neglect kinetic and potential energy after confirming they are immaterial.
The fuel convention must remain consistent. For a fired-heater boundary that includes combustion, fuel chemical energy enters once through the fuel stream using a defined heating-value or enthalpy basis. Engineers should not also add a separate term for energy “generated” by combustion. For a process-coil boundary that excludes the burner, heat crossing the tube wall is recorded as Q˙.
A balance residual is an investigation trigger
A residual is the difference left after measured flows, inventory change and justified reaction terms are reconciled. It does not prove a leak. It indicates that the physical process or measurement system needs examination.
Consider an illustrative solvent-recovery balance over a stable 24-hour period:
| Item | Solvent flow |
|---|---|
| Spent solvent entering | 80.0 t/d |
| Recovered solvent | 69.5 t/d |
| Solvent in residue | 5.0 t/d |
| Solvent in wastewater | 1.0 t/d |
| Inventory increase | 0.5 t/d |
| Unexplained residual | 4.0 t/d |
The residual equals 5% of solvent input. If combined measurement uncertainty is 0.8 t/d, the 4.0 t/d gap is five times that uncertainty and warrants field investigation. If uncertainty is 4.5 t/d, the priority is better data, not a claimed recovery project.
This is the practical distinction from a site-level utility review. An invoice can show monthly gas consumption. It cannot show whether a particular reboiler is drawing excess steam because solvent recovery has deteriorated, condensate return has fallen or a flowmeter has drifted.
Identify where your plant is losing energy and quantify the savings potential — our audits map every heat source, sink, and waste stream in your facility.
Define the energy mass balance mapping boundary
Start with the plant-wide account
The first balance should cover purchased fuels, imported electricity, water, feedstocks, intermediates, products, by-products, wastes, flare streams and inventory movements. This provides a high-level check against site records.
The next stage divides the plant into process areas with identifiable hand-off points. Suitable boundaries include a reactor train, distillation section, solvent-recovery unit, boiler house, thermal oxidiser or effluent-treatment plant.
| Process area | Principal mass streams | Principal energy streams | Typical residual investigation |
|---|---|---|---|
| Reaction | Feed, catalyst, product, off-gas | Steam, thermal oil, agitation power | Yield, venting, excess cooling |
| Distillation | Feed, distillate, bottoms, reflux | Reboiler steam, condenser cooling, vacuum power | Solvent carryover, fouling, unstable reflux |
| Utilities | Fuel, boiler feedwater, condensate, blowdown | Fuel, electricity, steam | Stack loss, condensate loss, blowdown |
| Thermal oxidiser | VOC-bearing gas, auxiliary fuel, exhaust | Fuel, fan power, recovered heat | Air ingress, excess fuel, low heat recovery |
| Effluent treatment | Wastewater, sludge, recovered material | Aeration power, heat | Dissolved product, hot discharge |
A boundary should follow pipes, ducts, equipment and storage, not an organisational chart. The steam meter at a process-area battery limit, for example, establishes the transfer from boiler house to process user. Condensate return requires an equally clear return boundary.
Choose the right operating period
Continuous units need a stable period long enough to smooth normal process variation. Batch and campaign plants need a complete batch, campaign or defined inventory cycle. A shift-level balance often misclassifies material held in reactors, vessels and transfer lines as a loss.
Record the operating context with each balance:
- Product grade, throughput and feed composition
- Start-up, shutdown, cleaning and changeover activity
- Batch inventory changes and tank movements
- Maintenance bypasses and temporary connections
- Known flaring, relief activity or off-spec material
- Fuel type and boiler operating mode
This record prevents a normal campaign transition becoming a false efficiency finding.
Reconcile plant data before declaring a loss
Test the data basis first
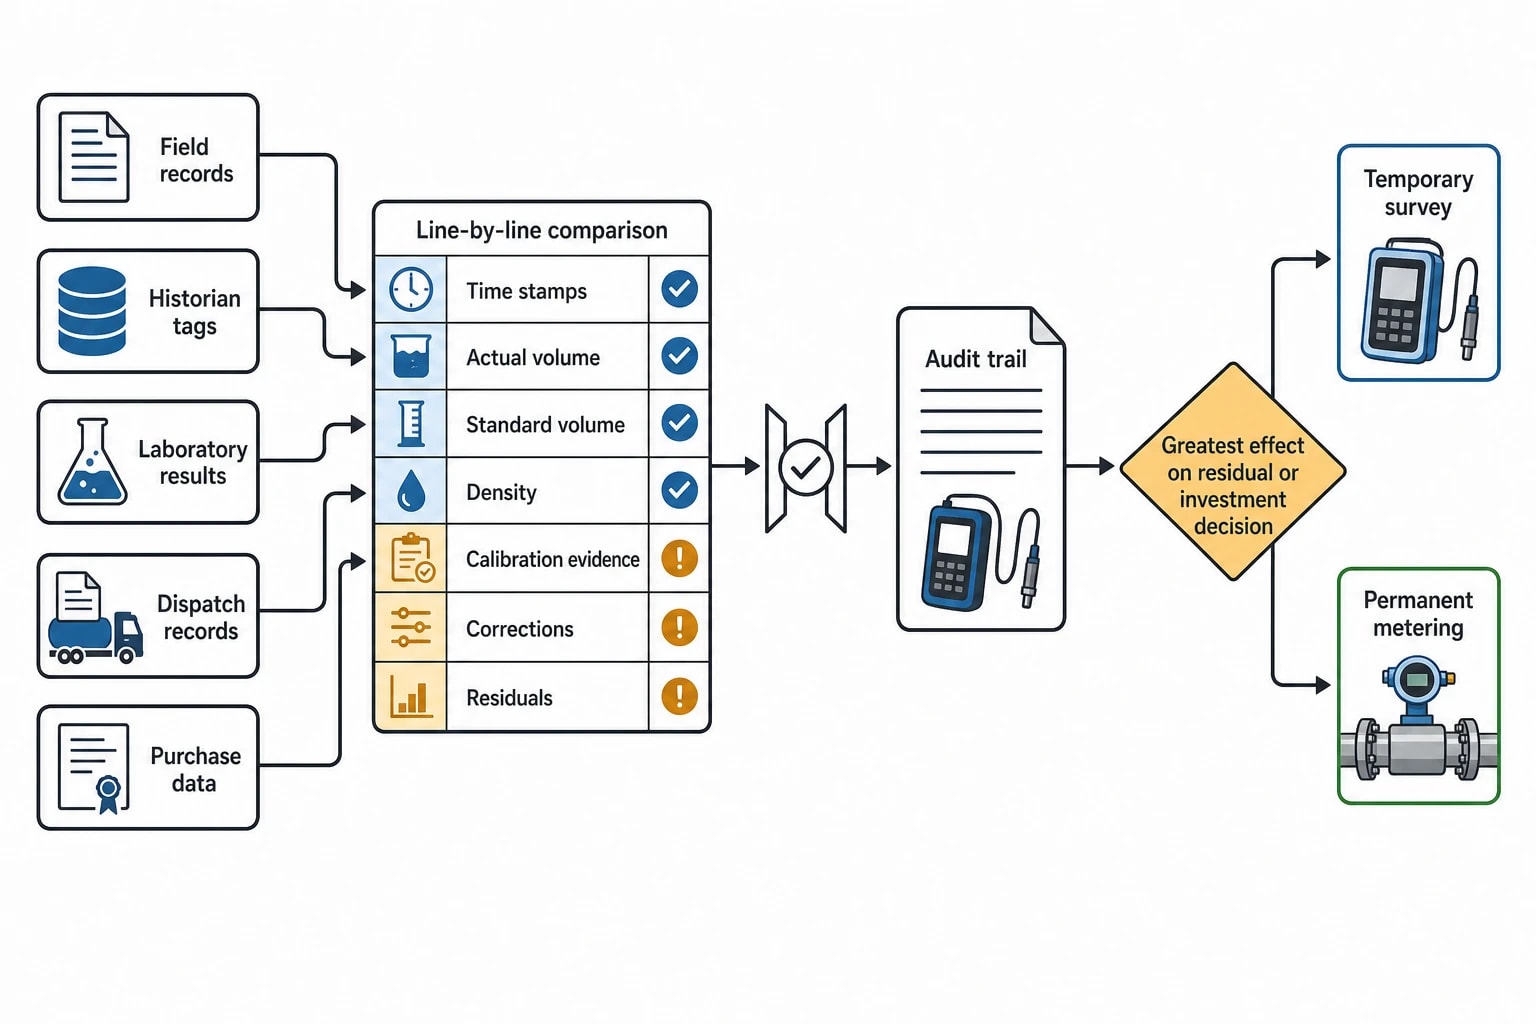
Data reconciliation begins with a line-by-line comparison of field records, historian tags, laboratory results, dispatch records and purchase data. The task is not to force a balance to close. It is to establish which data best represents the process and how much uncertainty remains.
Common causes of apparent losses include:
- Misaligned time stamps between production and utility records
- Actual-volume and standard-volume gas data mixed in the same calculation
- Density values that do not match current concentration or temperature
- Level-to-volume tables that pre-date tank modifications
- Steam meters operating outside their useful range
- Magnetic flowmeters affected by entrained gas
- Laboratory sampling that does not represent a campaign average
- Unrecorded transfers between process areas
A reconciliation sheet should retain original readings, assumptions, calibration evidence, corrections and residuals. Engineers need that audit trail when a balance supports a capital request.
Close the highest-value gaps first
The first instrumentation budget should address the stream with the greatest effect on the residual or investment decision. A low-cost temporary survey can establish whether permanent metering is justified.
Priority locations often include:
- Main steam supply and condensate return for major process areas
- Fuel to boilers, fired heaters and thermal oxidisers
- High-value solvent make-up, recovery and waste-solvent transfers
- Flare-header flow and, where feasible, composition
- Hot wastewater flow and temperature
- Recurring purge streams and unmetered inter-area transfers
- Large motor loads that change with throughput or control position
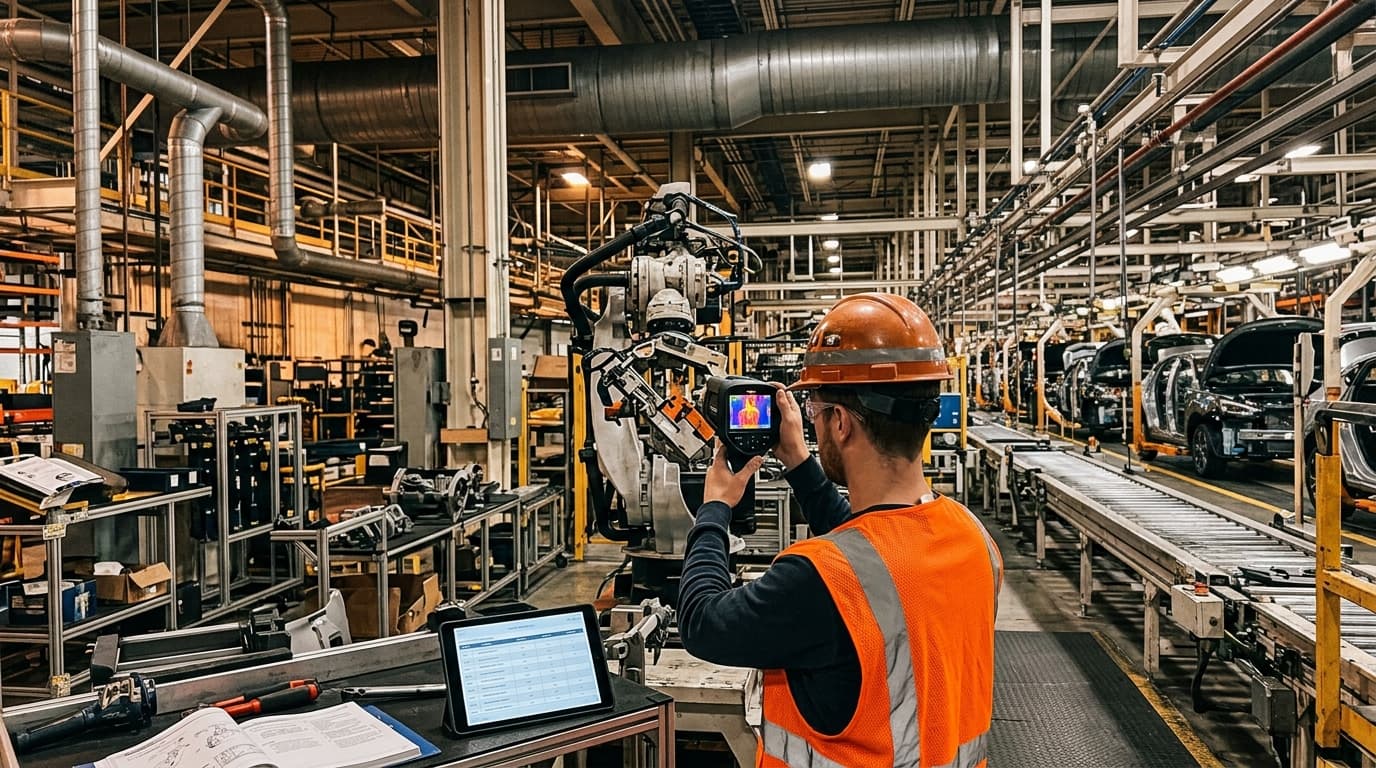
Portable power analysers and thermal imaging complement flow measurements. They can identify large variable electrical loads, insulation defects and abnormal surface temperatures during a site survey.
Where energy mass balance mapping finds chemical plant losses
Steam and condensate losses
A steam balance compares boiler output, header transfers, process consumption, flash-steam recovery, condensate return, blowdown and known losses. A material balance of boiler feedwater and condensate gives the accompanying water-treatment and make-up burden.
Lost condensate carries treated water and useful enthalpy. A recurring difference between steam supplied to a process area and measured demand may direct engineers towards failed traps, open drains, leaking valves, warm standby equipment, missing insulation or unmetered users.
Steam flow alone is insufficient. Pressure, temperature and dryness affect the enthalpy delivered. Engineers should also distinguish condensate returning at different pressure levels, because flash recovery and pumping arrangements can change the energy available elsewhere on site.
Solvent, purge and flare losses
Distillation and evaporation units often combine a material loss with an energy penalty. Low solvent recovery can increase fresh-solvent demand, reboiler duty, condenser load, wastewater treatment and emissions.
Purge streams need an explicit entry in the map. A purge may be required to control contaminants or inert build-up, but the required rate and composition should be compared with actual operation. The balance can show whether valuable solvent, reactant or hydrogen-rich gas leaves with the purge.
Flare flows require the same discipline. A flare is a safety-critical system, but its flow still affects raw-material yield, combustion load and direct emissions. The map should separate emergency releases from continuous or intermittent process flows that merit investigation.
Heat rejected with water and product
Hot wastewater can carry sensible heat, dissolved product and solvent. Mapping should connect drains, wash water, phase separation, treatment inlet and final sludge or disposal streams. Cooling-water return temperatures can also reveal heat rejected from a process that may be recoverable within safety, operability and product-quality limits.
A balance does not assume recovered heat is usable. It identifies its temperature, flow and timing, allowing the engineering team to test a proposed match against the receiving duty.

Identify where your plant is losing energy and quantify the savings potential — our audits map every heat source, sink, and waste stream in your facility.
Hazardous-area instrumentation and DSEAR
Design new measurement points for the zone
Chemical plants often need additional meters where flammable gas, vapour, mist or dust may be present. The Dangerous Substances and Explosive Atmospheres Regulations 2002 require employers to control fire and explosion risks. Area classification, ignition risk, installation route, isolation, maintenance access and process conditions must therefore form part of the metering specification.
IEC 60079-14:2024 addresses the design, selection, erection and initial inspection of electrical installations in explosive atmospheres. HSE identifies the BS EN 60079 series as a benchmark standard series for explosive-atmosphere controls.
The measurement objective should be defined before specifying the device. A meter intended to allocate steam cost may need a different range, accuracy and installation arrangement from one used to demonstrate a solvent-loss reduction after a capital project.
Build safety and maintainability into the data plan
The design review should establish the hazardous-area zone, equipment protection requirements, cable and gland arrangements, isolation method, inspection needs and calibration access. A meter that cannot be safely maintained will soon degrade the balance it was installed to improve.
Temporary instruments also need a suitable hazardous-area assessment. A short survey does not remove DSEAR obligations.
Convert mapped losses into investment decisions
Rank measures against a measured baseline
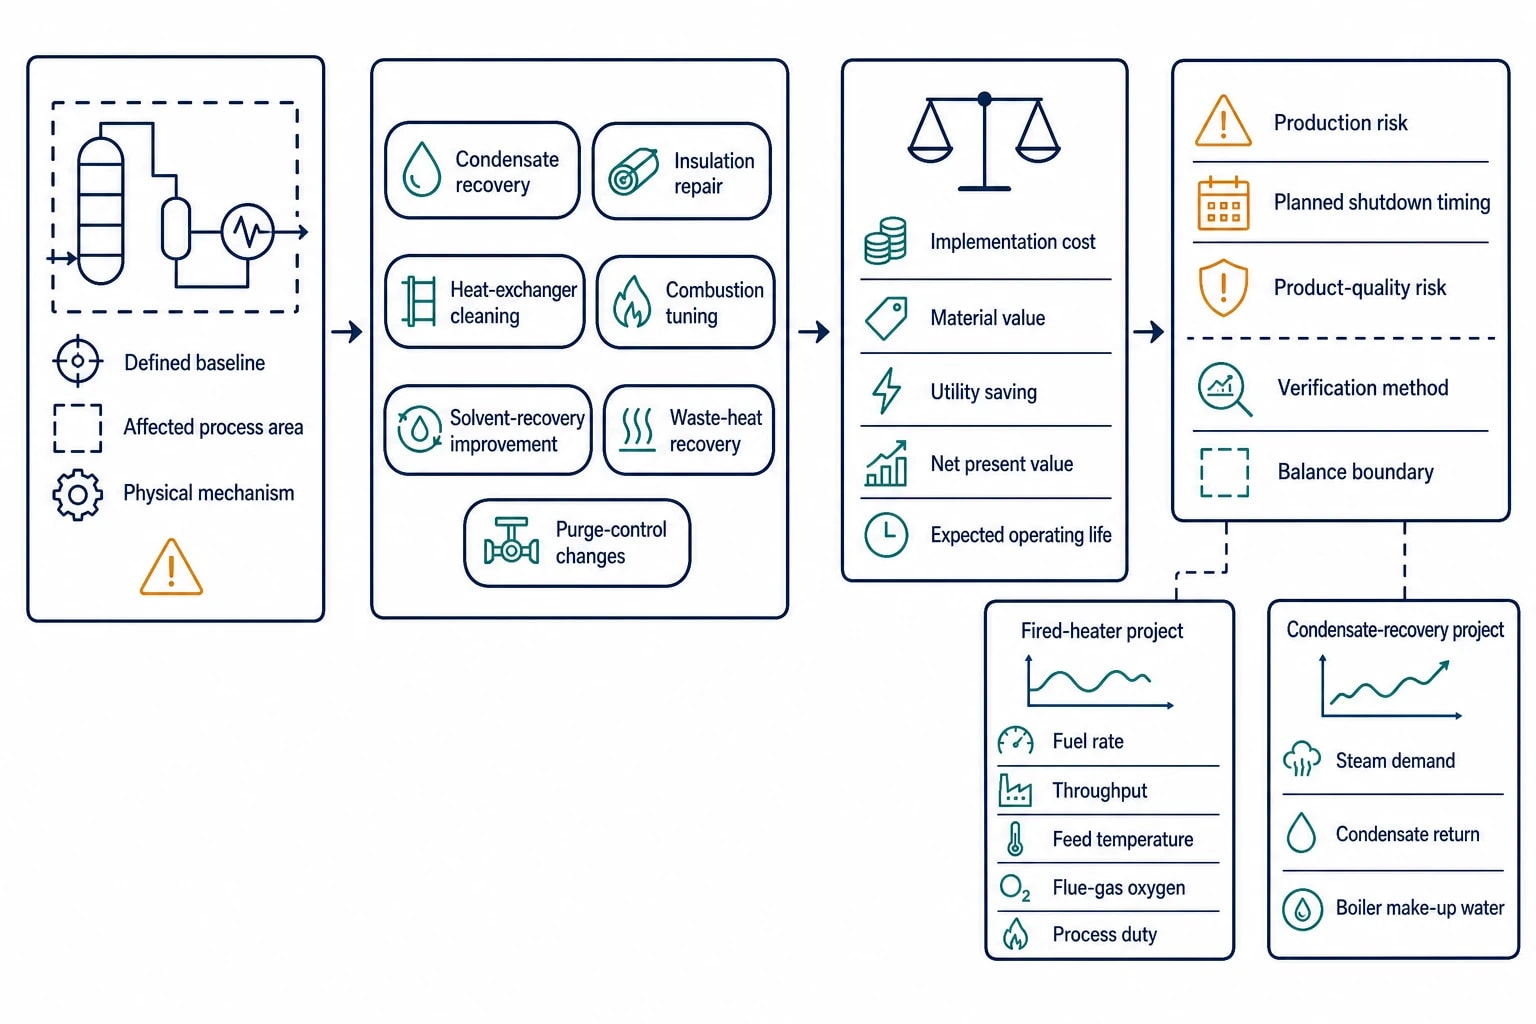
The completed map should create a register of energy conservation measures with a defined baseline, affected process area, physical mechanism, implementation cost, production risk and verification method.
A chemical site can then compare projects such as condensate recovery, insulation repair, heat-exchanger cleaning, combustion tuning, solvent-recovery improvement, waste-heat recovery or purge-control changes on a consistent basis.
The economics should include material value as well as utility saving. A project that prevents solvent loss and reduces reboiler steam may offer a stronger case than a utility-only measure with a similar payback period. Net present value, planned shutdown timing, expected operating life and product-quality risk should sit alongside simple payback.
Plan verification before implementation
Measurement and verification begins with the balance boundary. Record the pre-project operating variables that could change the result, such as throughput, feed composition, steam pressure, ambient conditions, fuel composition and product specification.
A fired-heater project, for example, should compare fuel rate with throughput, feed temperature, flue-gas oxygen and process duty. A condensate-recovery project should track steam demand, condensate return and boiler make-up water. A utility bill cannot isolate those effects at process level.
Energy mass balance mapping for ESOS Phase 4
The Energy Savings Opportunity Scheme requires qualifying UK organisations to assess energy use in buildings, industrial processes and transport, then identify tailored and cost-effective measures. Energy mass balance mapping gives chemical sites a technical route from significant energy consumption to specific, costed actions.
The Phase 4 compliance period runs from 6 December 2023 to 5 December 2027, and the notification deadline is 5 December 2027. The governing legislation is the Energy Savings Opportunity Scheme Regulations 2014, SI 2014/1643, as amended by the Energy Savings Opportunity Scheme (Amendment) Regulations 2023, SI 2023/1182.
For an ESOS evidence pack, retain the boundary definition, source records, meter calibration information, calculation basis, reconciliation log, residual assessment and project assumptions. That record makes the connection between a plant’s energy consumption, material losses and proposed efficiency measures clear for operations, finance and compliance teams.
This article reflects the independent analysis and editorial opinion of EnerTherm Engineering. Product names, trademarks, and brands mentioned belong to their respective owners. EnerTherm Engineering is not affiliated with, endorsed by, or a licensee of any third-party software or product mentioned unless explicitly stated.

Managing Director — EnerTherm Engineering
Dr. François Pierrel is Managing Director of EnerTherm Engineering with over two decades of expertise in thermal design, heat transfer, and industrial energy optimisation. He holds a PhD in Heat Transfer from Cranfield University and a Post-Doctorate from Heriot-Watt University.
