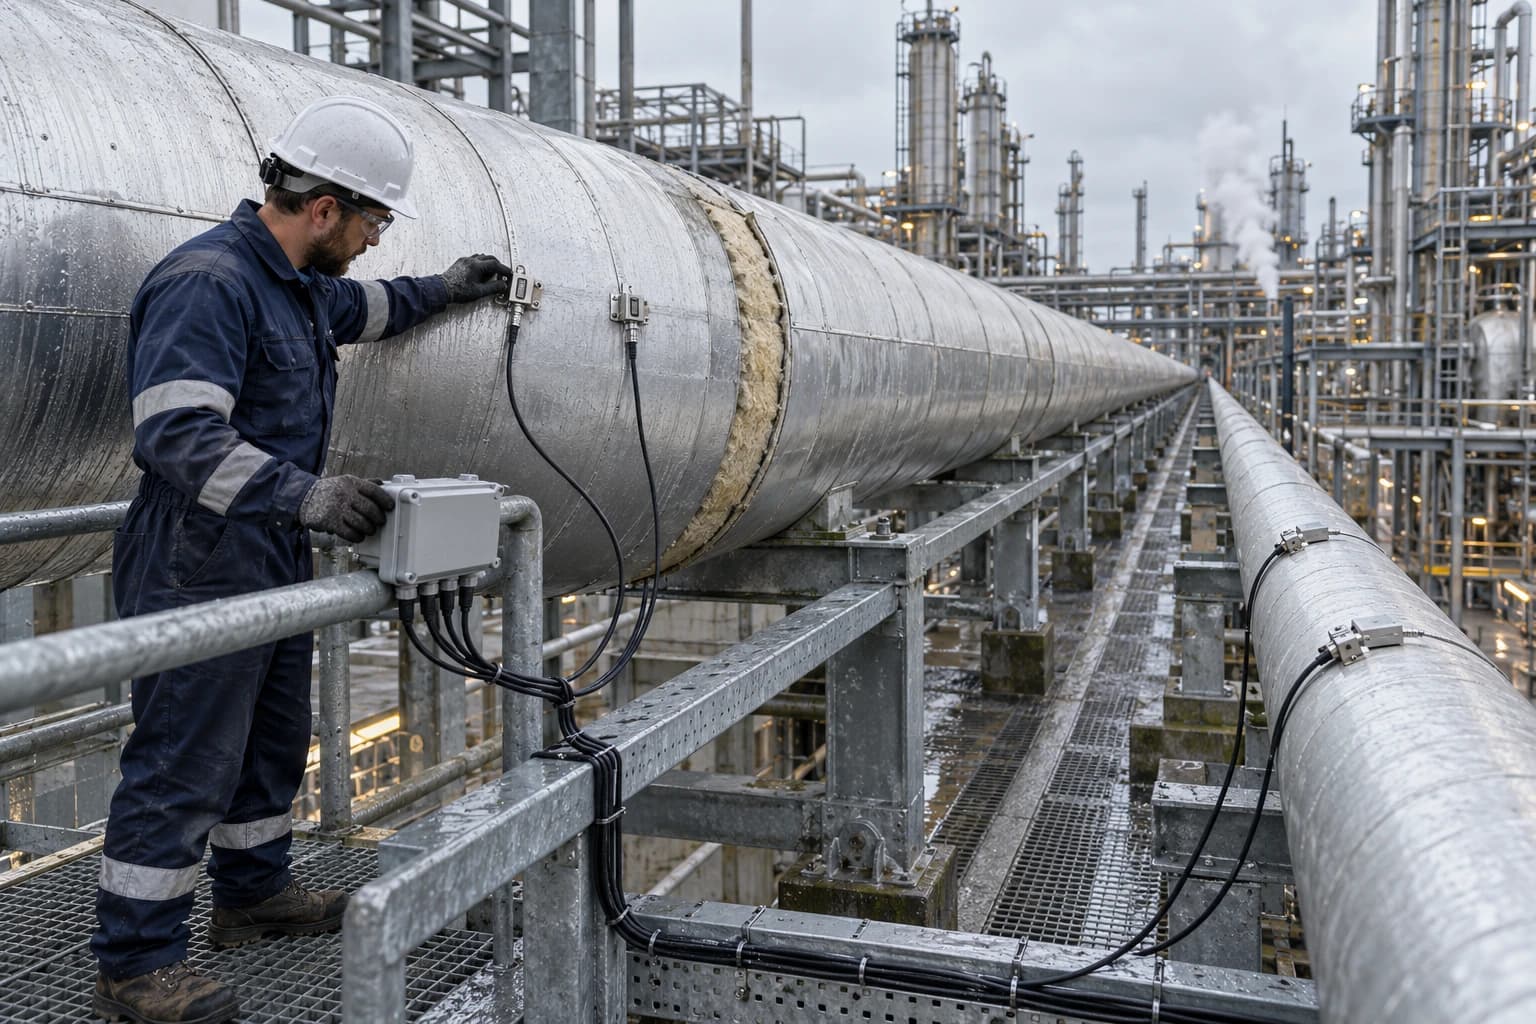
Why 6-12% Heat Savings Can Mislead Chemical Plant ROI
DESNZ models 6-12% fuel savings from heat integration, with approximately £2m site CapEx.
DESNZ’s March 2026 industrial energy-efficiency evidence update models 9% fuel-for-heat savings, within a 6-12% range, for waste-heat recovery and heat integration in the paper and pulp sector. Its average-site capital estimate is £2.0m in 2024 prices, with a £1.5m to £2.5m range.
Those figures are useful screening references for chemical manufacturers. They do not establish the ROI of an industrial energy-efficiency project at a specific plant.
A chemical site earns value only when recovered heat displaces a real, simultaneous utility demand for enough operating hours to outweigh installed cost, maintenance, energy penalties and production risk. A 12% reduction in annual fuel use can produce a weak investment case if a process campaign changes, a heat exchanger fouls, a heat sink disappears or a shutdown disrupts profitable production.
The reverse also applies. A lower percentage fuel saving may justify capital where it cuts a persistent fired-heater load, removes a cooling constraint or fits within an already planned turnaround.
For energy managers and capital-project teams, the question is not whether a heat-recovery concept works on a process diagram. It is whether the plant will retain cash savings across the project’s operating life.
The DESNZ 6-12% range is a benchmark, not a chemical-plant forecast
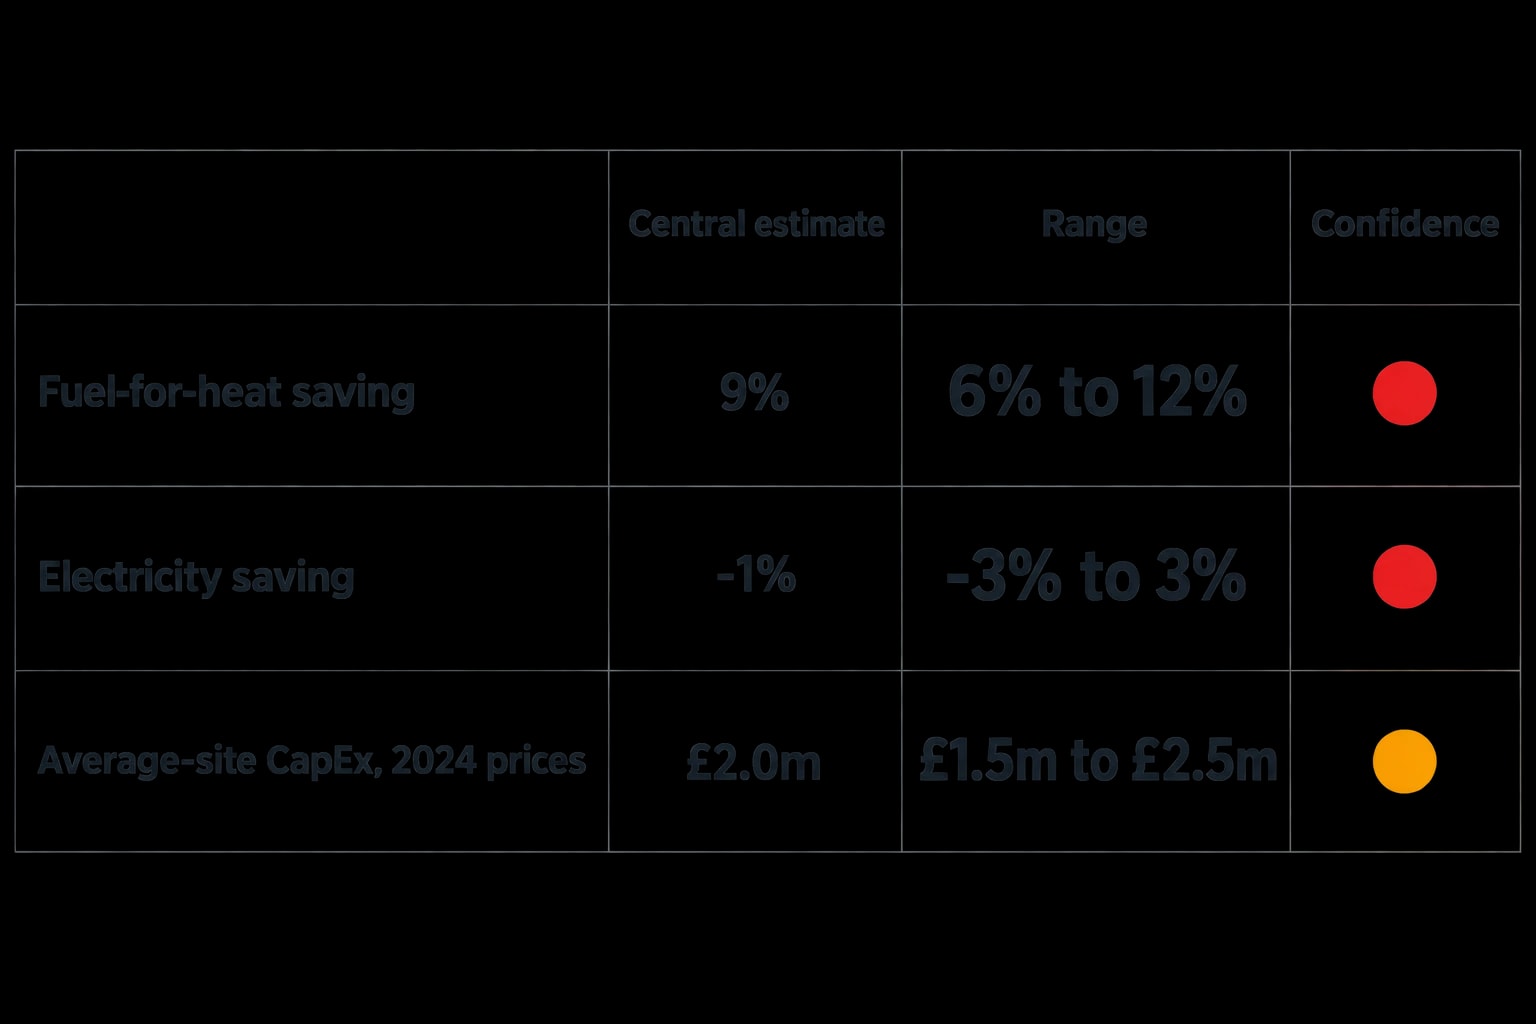
DESNZ’s figure comes from a sector-level model for paper and pulp. The report gives the waste-heat recovery and heat-integration estimate a red confidence rating for energy savings, its lowest confidence category. That signals uncertainty in the evidence base, not an expectation that projects will fail.
A chemical plant should therefore use the range to frame early investigation rather than enter 9% directly into a capital request.
| DESNZ paper and pulp benchmark | Central estimate | Range | Confidence rating |
|---|---|---|---|
| Fuel-for-heat saving from waste-heat recovery and heat integration | 9% | 6-12% | Red |
| Electricity saving | -1% | -3% to 3% | Red |
| Average-site capital expenditure, 2024 prices | £2.0m | £1.5m to £2.5m | Amber |
The reported electricity result matters. Heat recovery can add pumping, fan, control or heat-upgrading loads. A project that lowers gas consumption while increasing electricity use may still create value, but its business case must include both effects.
Establish the saving boundary
“Heat saving” can describe several outcomes: reduced fuel input to a fired heater, lower steam generation, lower cooling duty or reduced total site energy. These boundaries produce different financial and operational outcomes.
A process team should define the boundary before calculating value:
- Is the percentage measured against a heater, utility island, production unit or whole site?
- Does it refer to fuel input or useful heat delivered to the process?
- Does the proposal displace natural gas, imported steam or another internal heat source?
- Which product grades, recipes and operating modes can use the recovered heat?
- Are bypasses, minimum-flow arrangements or temperature-control constraints likely to limit runtime?
- Does the project alter electrical load, cooling-water demand, water treatment or maintenance work?
A reactor-effluent heat exchanger may reduce fired-heater fuel at steady throughput. That benefit can decline if feed composition changes, the process moves to a lower-rate campaign or fouling forces a bypass. Applying a fixed annual percentage saving across a 15-year appraisal disguises the conditions required to achieve it.
Heat quality and timing determine value
A hot stream has value only where a suitable cold demand exists at the right temperature and time. A plant may reject substantial heat through cooling systems yet lack a nearby process user that can accept it. Conversely, a modest hot stream may have high value where it preheats a continuous feed immediately upstream of a fired heater.
Pinch Analysis can identify theoretical heat-recovery targets and potential heat-exchanger matches. The investment case starts after that target. Engineers must test temperature driving force, pressure drop, controllability, fouling, cleanability, contamination risk, start-up behaviour and failure consequences.
A target that assumes continuous simultaneous operation may overstate savings on a batch or campaign plant. A heat exchanger that works on one product grade may create an operational burden on another.

Identify where your plant is losing energy and quantify the savings potential — our audits map every heat source, sink, and waste stream in your facility.
Why energy savings do not equal financial return
Annual energy saving multiplied by an assumed fuel price is a useful first screen. It is not enough to approve a complex chemical-plant modification.
The project’s cash flow should include all material costs and benefits. For heat recovery, this commonly includes avoided fuel purchases, electricity effects, cooling-water changes, inspection, cleaning, spare parts, engineering, commissioning and lost production during tie-ins.
Pressure drop deserves a cash value
An additional heat exchanger can impose pressure drop on a process stream. That may increase pump or compressor energy, reduce available capacity, change control-valve behaviour or require equipment modifications.
The financial model should show these effects explicitly. Counting fuel savings while treating pumping power, cooling duty and capacity as separate engineering matters produces an incomplete ROI calculation.
The same discipline applies where heat recovery affects utilities. A scheme that lowers direct-fired duty may increase steam-system loading or alter condensate return. A project team should trace the energy balance through the affected process and utility systems before finalising savings.
Installation scope can determine project economics
Installed cost commonly exceeds the heat-exchanger purchase price by a wide margin. Pipework, structural steel, insulation, access, drainage, electrical work, instruments, controls, insulation removal, hazardous-area requirements and commissioning resources all affect capital cost.
Chemical sites also need to account for isolation, draining, cleaning, purging, breaking containment and reinstatement. Where flammable substances or explosive atmospheres are present, the design and installation scope must meet the requirements of the Dangerous Substances and Explosive Atmospheres Regulations 2002. These form part of the project basis.
NPV shows what simple payback cannot
Simple payback remains useful for sorting a long list of Energy Conservation Measures. It shows how rapidly an investment might recover its initial cost under one set of assumptions. It does not capture the timing of shutdown costs, annual performance decline, major cleaning work or the duration of savings.
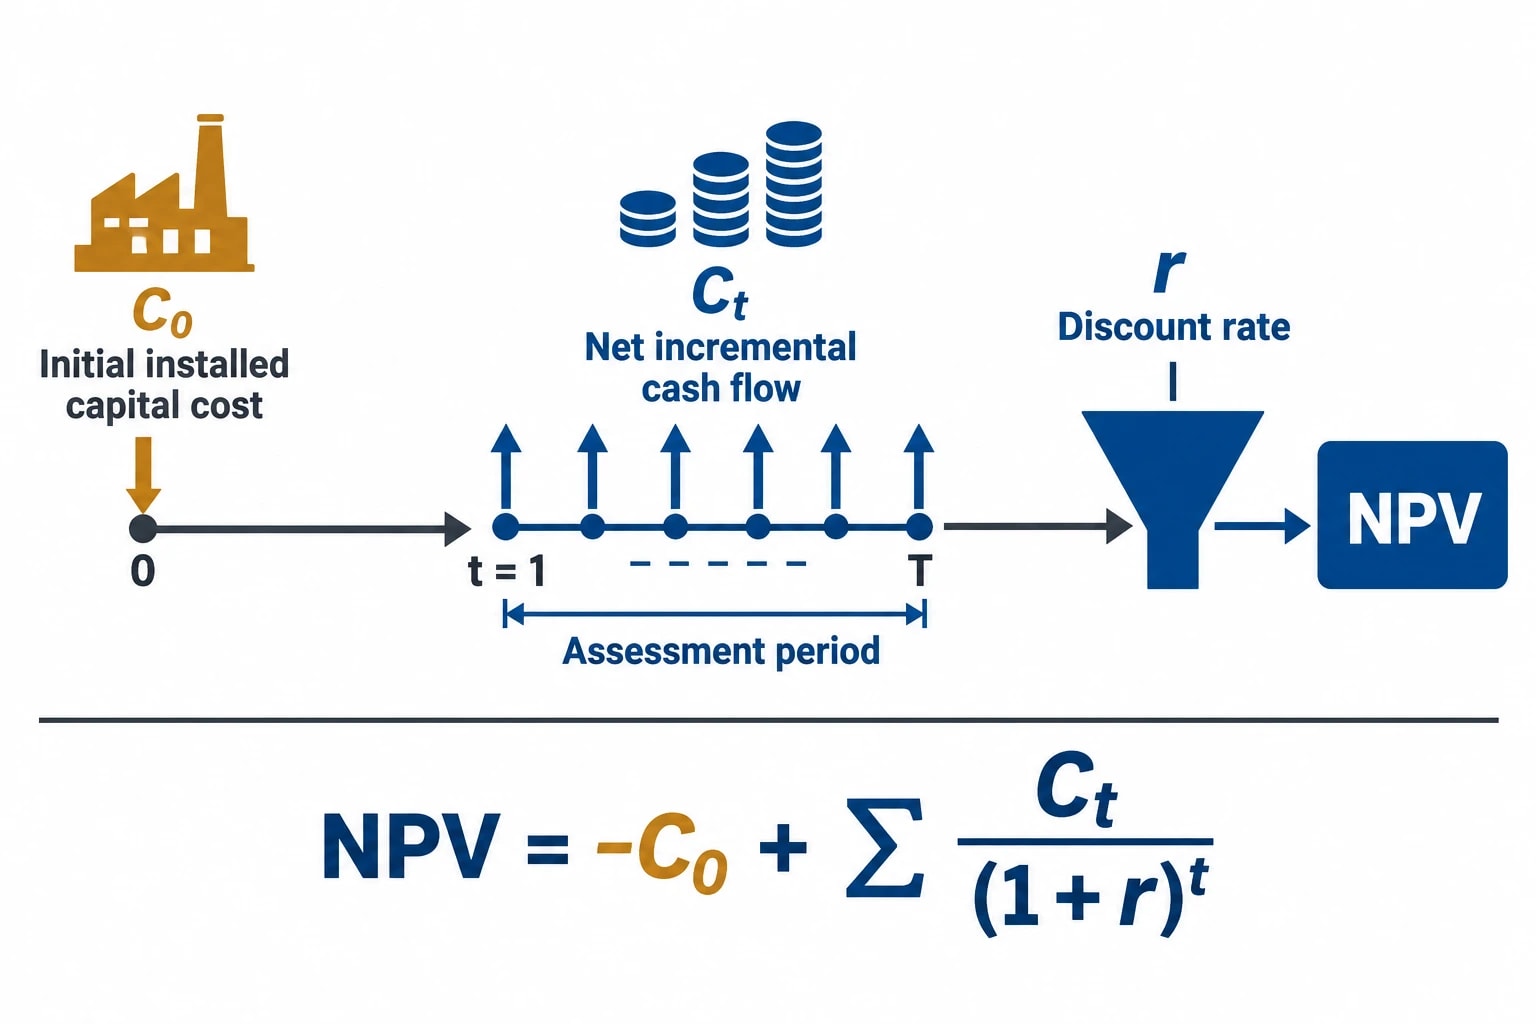
Net present value, or NPV, is a better decision measure because it places each cash flow in the period when it occurs.
NPV=−C0+t=1∑T(1+r)tCtC0 is the initial installed capital cost. Ct is the net incremental cash flow in year t. r is the organisation’s discount rate. T is the assessment period.
A positive NPV does not remove technical risk. It shows whether the value of expected future cash flows exceeds the initial investment after applying the company’s required return.
Model the project as it will operate
The cash-flow forecast should reflect the plant’s expected operating pattern rather than a single annual average. A credible model may include:
- fuel, electricity, steam, cooling-water and water-treatment effects;
- operating hours by product grade or campaign;
- expected heat-exchanger fouling and cleaning intervals;
- planned and unplanned outages;
- commissioning and ramp-up performance;
- additional operating and maintenance labour;
- lost contribution margin during installation;
- replacement, overhaul or residual-value assumptions.
A heat-recovery project often has a strong central case and a weak downside case. The investment committee needs both. A base case alone cannot show whether a project remains worthwhile if heat-sink availability falls, the outage extends or gas prices soften.
Test the variables that move NPV
Sensitivity analysis should focus on assumptions capable of changing the decision. For a heat-integration project, these usually include:
- Annual runtime with simultaneous heat source and heat sink.
- Recoverable duty after temperature, fouling and control constraints.
- Fuel and electricity prices.
- Installed capital cost and contingency.
- Turnaround timing and lost production exposure.
- Cleaning frequency, heat-exchanger availability and performance degradation.
- Future throughput, product mix and planned process changes.
A sensitivity table directs further engineering effort. If NPV depends heavily on heat-sink availability, the team needs operating data and production input. If capital cost dominates, engineering should refine the tie-in and constructability scope before seeking approval.
Production risk can outweigh a year of fuel savings
Chemical plants schedule major modifications around turnarounds because live tie-ins carry safety, operational and quality risks. A dedicated shutdown may consume much of the first year’s energy benefit, particularly where the affected unit produces high-margin material.
The model should value outage exposure using the plant’s actual contribution-margin assumptions and expected installation window. It should also record whether work can be combined with planned maintenance. Combining scope may reduce incremental lost production, but it can increase turnaround complexity.
Design for operating flexibility
A heat-recovery system that works only at one throughput or temperature condition may burden operators. Design reviews should test:
- normal operation at each relevant product grade;
- start-up, shutdown and low-rate production;
- control response to changing process temperatures;
- heat-exchanger fouling, cleaning and isolation;
- bypass arrangements and their effect on energy performance;
- consequences of loss of the heat exchanger or associated controls;
- product-contamination and containment risks.
These questions connect energy performance with production resilience. A project that protects throughput and allows safe maintenance has a more dependable cash-flow profile than one that delivers a higher theoretical energy target under narrow conditions.

Identify where your plant is losing energy and quantify the savings potential — our audits map every heat source, sink, and waste stream in your facility.
Build the baseline around production conditions
Annual gas invoices can identify high-level trends. They rarely prove savings from a specific heat exchanger or fired-heater optimisation project.
A baseline should connect energy consumption to the factors that drive it. For chemical processing, relevant variables may include throughput, product mix, feedstock composition, batch cycle, ambient conditions, steam pressure, reflux ratio, equipment line-up and operating hours.
Record the design basis before approval
The project file should state the operating conditions under which the predicted saving applies. This should include production rate, process temperatures and pressures, utility conditions, control settings, expected maintenance intervals and meter locations.
That record prevents later disputes. If fuel use rises after installation, the team can establish whether the cause is underperforming equipment, changed production, an altered utility system or an abnormal operating event.
It also protects operational teams from being judged against an energy target that assumed conditions they cannot maintain.
Use IPMVP-style measurement and verification
The International Performance Measurement and Verification Protocol sets out principles for comparing energy use before and after an efficiency project while making suitable adjustments for changed conditions.
For a defined heat-recovery project, the measurement boundary should include the fuel, electricity and utilities affected by the modification. The measurement and verification plan should be agreed before installation and identify:
- the baseline period and data quality checks;
- fuel, electricity, flow, temperature and pressure meters;
- production variables used for adjustments;
- meter-reading frequency and data ownership;
- treatment of bypass operation, abnormal events and maintenance periods;
- the reporting period and responsibilities for review.
Savings are avoided energy use, so they cannot be read directly from one post-project meter. The baseline and reporting periods must be comparable, with fair adjustments for production and operating changes.
ESOS Phase 4 makes audit evidence more valuable
The Energy Savings Opportunity Scheme Regulations 2014, most recently amended by the Energy Savings Opportunity Scheme (Amendment) Regulations 2026, give audit quality a direct governance role.
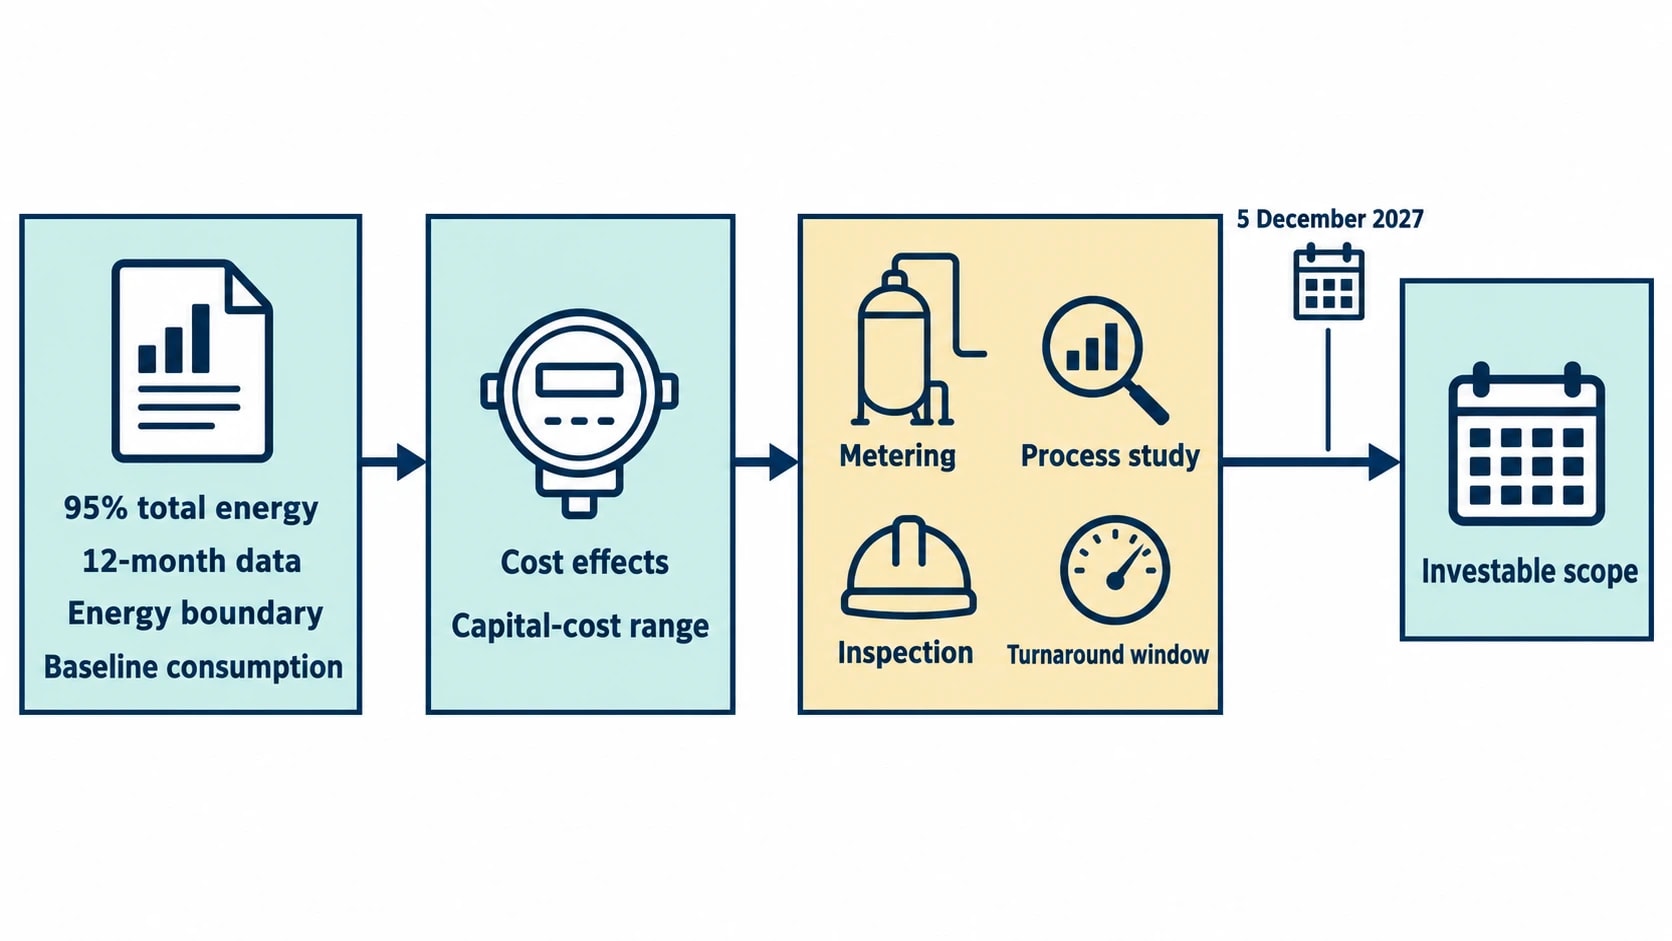
For ESOS Phase 4, areas of significant energy consumption must account for at least 95% of total energy consumption. Participants must calculate energy-intensity ratios for buildings, transport, industrial processes and other energy uses. An ESOS-compliant audit must, so far as reasonably practicable, use verifiable energy data measured over a 12-month period, analyse consumption and efficiency, identify savings opportunities and include site visits.
The Phase 4 notification-of-compliance deadline is 5 December 2027.
Turn audit recommendations into investment evidence
ESOS does not require an individual heat-recovery project to pass a particular NPV threshold. It does, however, create a reason to organise audit findings so they support capital decisions and later reporting.
For each Energy Conservation Measure, the audit record should identify the energy boundary, baseline consumption, expected energy and cost effects, capital-cost range, implementation constraints, expected savings category and evidence needed after commissioning.
The audit register should separate technical potential from investable scope. A heat-recovery opportunity may need more metering, a process study, a heat-exchanger inspection or a confirmed turnaround window before finance can rely on its NPV.
Judge retained cash flow, not the headline percentage
The DESNZ 6-12% range is a useful prompt for investigation, but its sector-specific evidence and red confidence rating make it a poor substitute for site data.
ROI depends on retained cash flow after process constraints, installation scope, utility interactions, maintenance, production risk and performance verification.
This article reflects the independent analysis and editorial opinion of EnerTherm Engineering. Product names, trademarks, and brands mentioned belong to their respective owners. EnerTherm Engineering is not affiliated with, endorsed by, or a licensee of any third-party software or product mentioned unless explicitly stated.

Technical Manager — EnerTherm Engineering
John Naranjo is Technical Manager at EnerTherm Engineering, bringing specialist expertise in chemical and environmental engineering. He recently led the implementation of Omni Vision, EnerTherm's real-time energy and utility monitoring platform. He holds an MSc in Environmental Engineering from the University of Huelva and a BSc in Chemical Engineering, with memberships in both the Energy Institute and IChemE.
