Why Industrial Thermal Imaging Surveys Find Heat Loss
Non-contact thermography reveals insulation faults, hot spots and CUI risks.
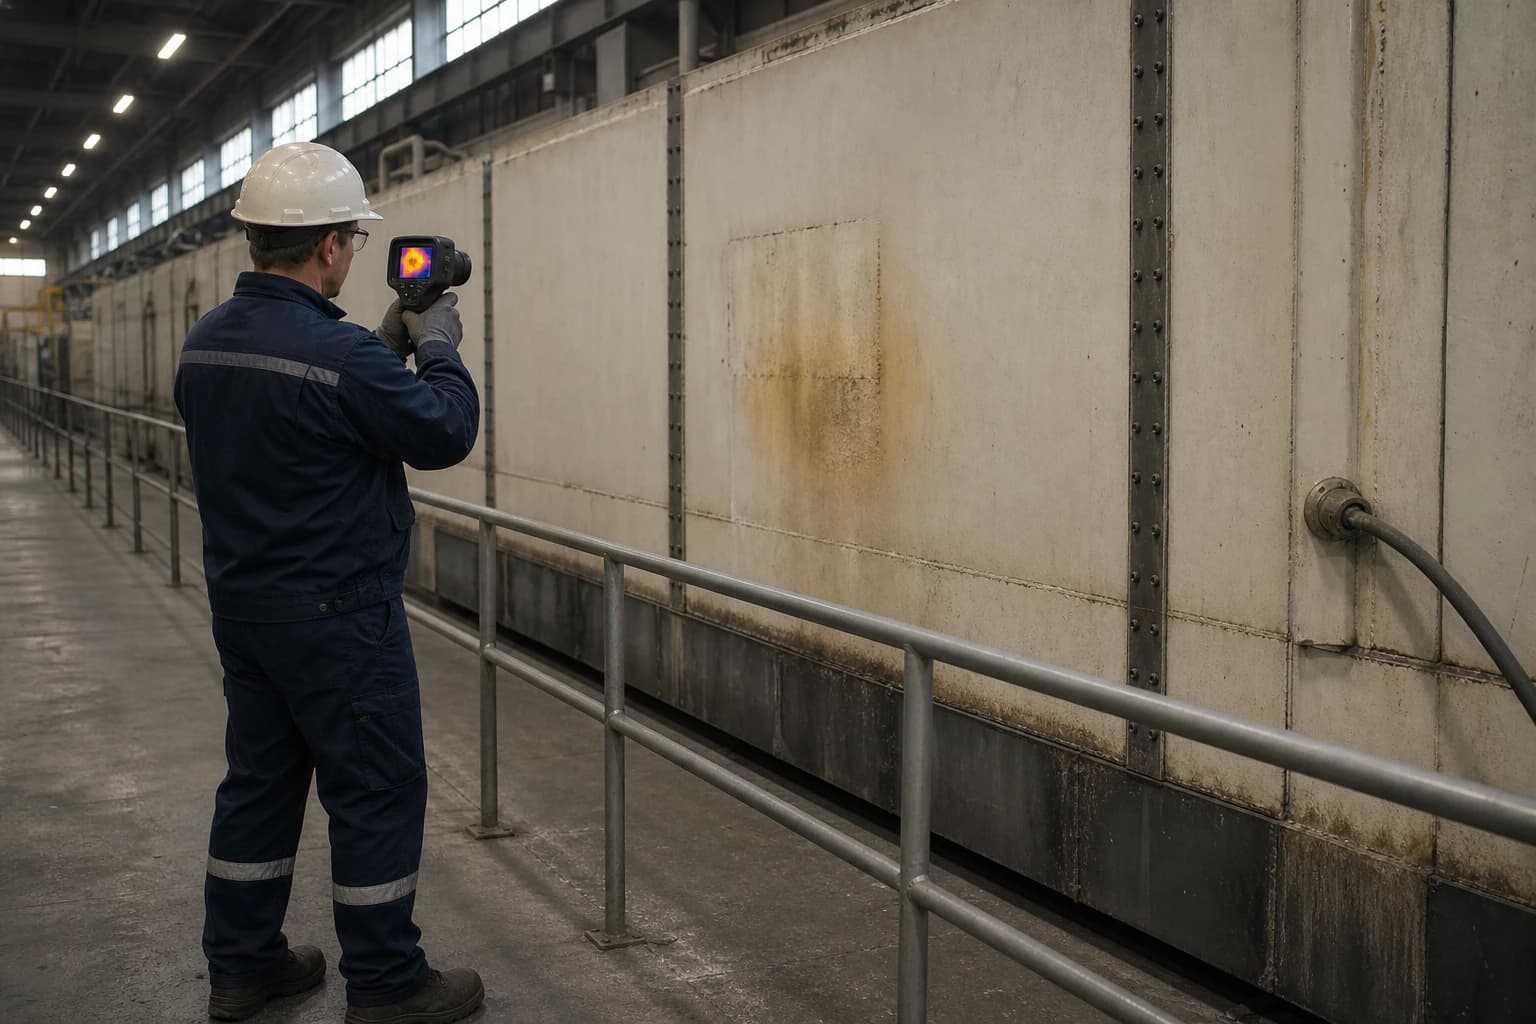
An industrial thermal imaging survey is a non-contact inspection using an infrared camera to identify surface-temperature patterns associated with heat loss, insulation defects, overheating equipment and process inefficiency.
A furnace casing may look intact but show a warm patch where refractory or insulation has deteriorated. A steam valve can appear hotter than the adjacent pipe because its insulation is missing. A switchboard connection can reveal excess resistance while the production line remains live. Thermal imaging makes these temperature differences visible before they become evident in energy bills, operator reports or equipment failure.
For UK manufacturers, the method is a practical part of an industrial energy audit. It helps facilities managers, maintenance engineers and energy managers focus repair work on heat losses and developing defects without interrupting normal production.
How an industrial thermal imaging survey detects heat loss
Infrared cameras measure surface radiation
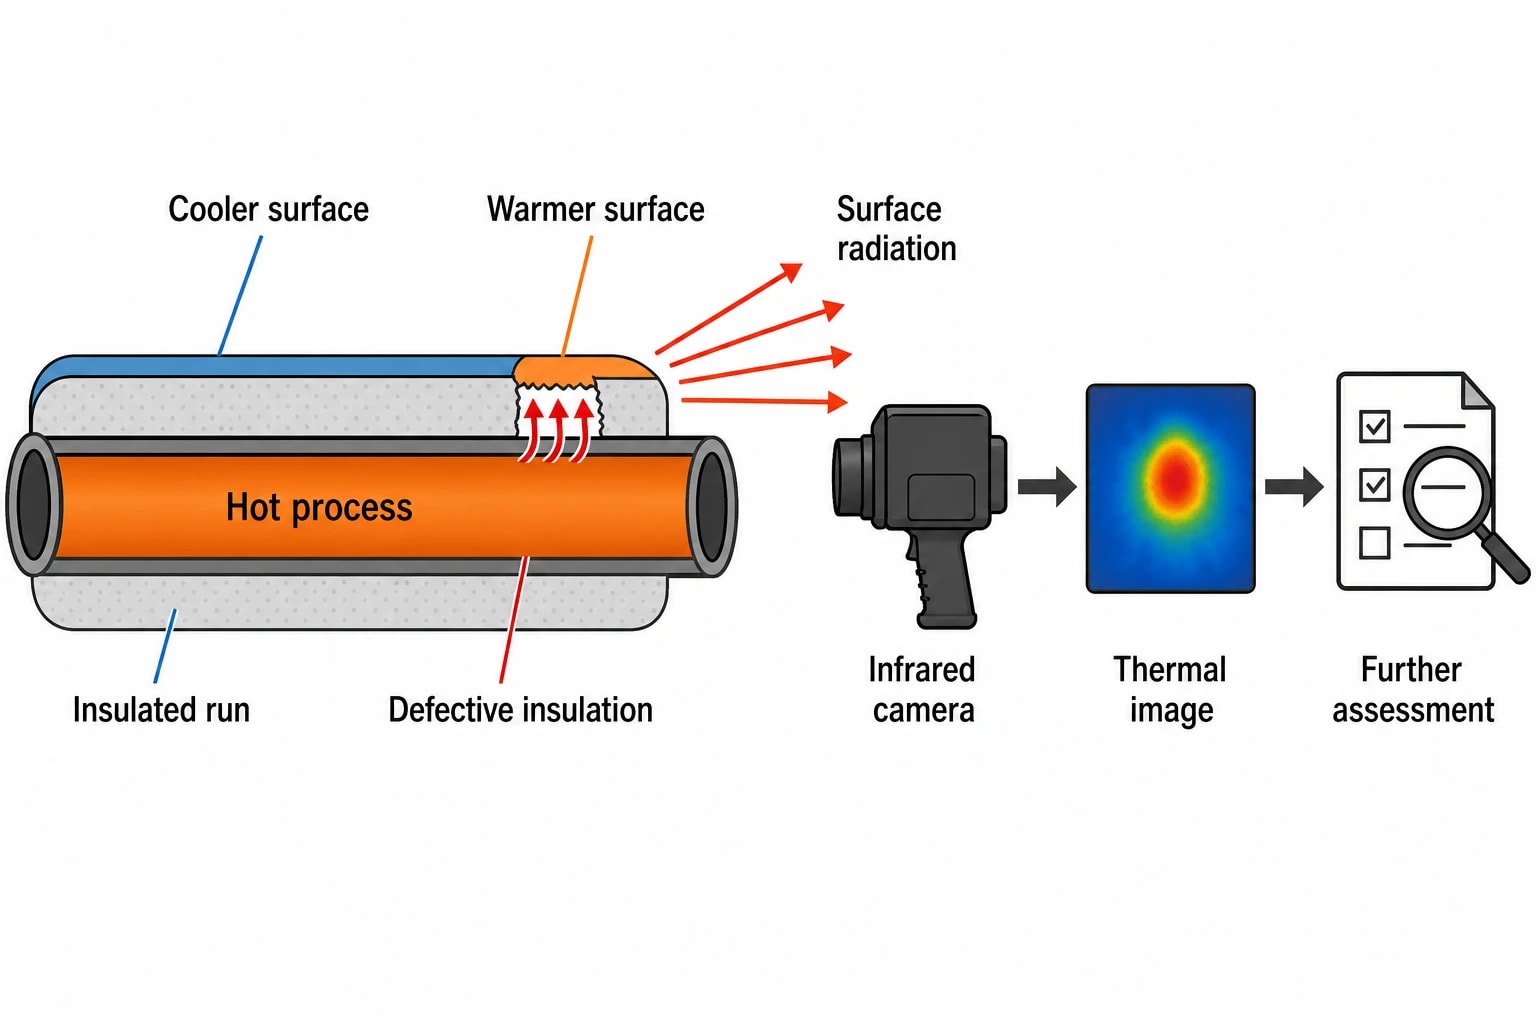
All objects above absolute zero emit infrared radiation. An infrared camera detects that radiation and displays differences across the field of view as a thermal image. Warmer and cooler areas appear as contrasting colours or tones, allowing an inspector to identify anomalies quickly.
The camera measures the visible surface. It does not see through steel, cladding, insulation, refractory or a closed electrical enclosure. A warmer external casing can indicate heat escaping through defective insulation, but the image does not establish the precise internal failure or calculate energy loss alone.
The thermographer interprets each pattern against the asset’s process duty, construction and operating state.
Relevant context includes:
- Process temperature, pressure and production load
- Surface material, coating and insulation construction
- Ambient temperature, airflow and weather conditions
- Cladding, seals, refractory and visible damage
- Similar components operating under comparable conditions
A hot area is evidence for further engineering assessment, not a diagnosis by itself.
Heat loss creates temperature contrast
Heat flows from a hotter body towards a colder environment. Insulation, refractory, seals and cladding limit that transfer. When part of this barrier fails, the outside surface commonly becomes warmer than adjacent areas operating under the same duty.
On a steam or thermal-fluid line, missing insulation, a damaged valve jacket or an exposed flange can stand out against a consistent insulated run. On an oven, a warm strip around a door may indicate a worn gasket, poor closure or distortion. On a heated tank, uneven surface temperatures can indicate insulation degradation, liquid-level effects or differences in wall condition.
Comparison is central to an effective industrial thermal imaging survey. Inspectors can compare parallel pipe branches, repeated valve stations, identical oven doors or similar electrical compartments. A component that differs from comparable equipment requires investigation.
Overheating findings need a separate response
Thermal surveys find condition issues as well as heat-loss defects. The two can overlap, but maintenance teams should record them separately.
A hot furnace wall may indicate degraded insulation or refractory. A hot electrical connection may suggest high resistance, imbalance or excessive load. HSE guidance identifies thermographic surveys as useful for detecting overheating conductors, connections, fuses and circuit-breakers while equipment is in use.
The remedy depends on the asset. Insulation repairs reduce process heat loss. Electrical anomalies may require an urgent competent-person assessment, load checks or a planned shutdown. A clear report assigns the appropriate action rather than treating every hot spot as an energy measure.
Identify where your plant is losing energy and quantify the savings potential — our audits map every heat source, sink, and waste stream in your facility.
What an industrial thermal imaging survey finds in manufacturing plants
Failed insulation, damaged cladding and thermal bridges
Manufacturers use insulation to limit heat loss from pipework, vessels, dryers, ovens, furnaces and hot-water systems. Missing sections, compressed insulation, damaged joints, poor weatherproofing and exposed fittings weaken that barrier.
Thermal bridges occur where a conductive path bypasses part of an insulation system. Common examples include supports, brackets, flanges, access doors and structural penetrations. The thermal image commonly shows a local warm feature against a cooler insulated surface.
An inspector must distinguish between an expected thermal bridge and an avoidable defect. Some supports need a direct structural connection to a hot asset. Others may suit insulation boxes, redesigned supports or inclusion in a repair programme. The report should state the observed pattern, likely cause and next inspection step.
Wet insulation and corrosion under insulation indicators
Water can reduce insulation performance and create conditions associated with corrosion under insulation, commonly abbreviated to CUI. HSE COMAH guidance states that thermography can indicate wet insulation and potential CUI conditions, as well as wall thinning and scale build-up where these alter heat transfer.
Thermography provides screening evidence. Surface-temperature variation can identify an area for insulation removal, visual examination or another inspection method. It cannot confirm remaining wall thickness or quantify corrosion depth through cladding.
A useful report records the asset tag, process duty, visible condition of the cladding, image conditions and exact location of the anomaly. Maintenance and integrity teams can then decide whether the indication requires immediate repair, planned insulation removal or more detailed non-destructive testing.
Process vessels, pipework and heat exchangers
Hot and cold process assets offer useful targets for an industrial thermal imaging survey. Common examples include:
- Steam, condensate and thermal-fluid pipework
- Process heaters, furnaces, ovens and dryers
- Extruder barrels and mould-temperature circuits
- Heated tanks, reactors and transfer lines
- Heat exchangers, valves and associated pipework
- Boiler fronts, ductwork and flues where safe access permits
Heat-exchanger images can reveal uneven temperature distribution, external insulation loss or possible bypassing. They do not establish heat-transfer performance in isolation. Engineers should compare the image with inlet and outlet temperatures, flow, operating duty and maintenance history before specifying cleaning, inspection or a process change.
In plastics plants, thermal images can identify uneven barrel heating, damaged insulation on heated transfer lines and temperature differences around dies and mould circuits. In metals operations, surveys often target furnace casings, ladle heaters, ovens, hot-air ducting and thermal-oil distribution. Process plants may focus on steam systems, reactors, pipe bridges and heat-recovery equipment.
Electrical and rotating equipment
Electrical thermography can support production reliability alongside heat-loss work. Typical targets include switchboards, motor-control centres, cable terminations, disconnects, transformers, drives and local control panels.
For rotating equipment, abnormal temperatures around bearings, couplings, gearboxes, pumps, fans, valves and motors can justify further maintenance checks. ISO 18434-1:2008, confirmed as current by ISO in 2023, covers infrared thermography for machinery condition monitoring. Its scope includes valves, fluid-powered and electrically powered machines, and machinery-related heat exchangers.
Operating load matters. A lightly loaded conductor may show little temperature difference even where a connection has started to deteriorate. An inspection report should record load where practicable and compare phases, feeders or similar assets under similar conditions.
Why thermal images need careful interpretation
Emissivity affects apparent temperature
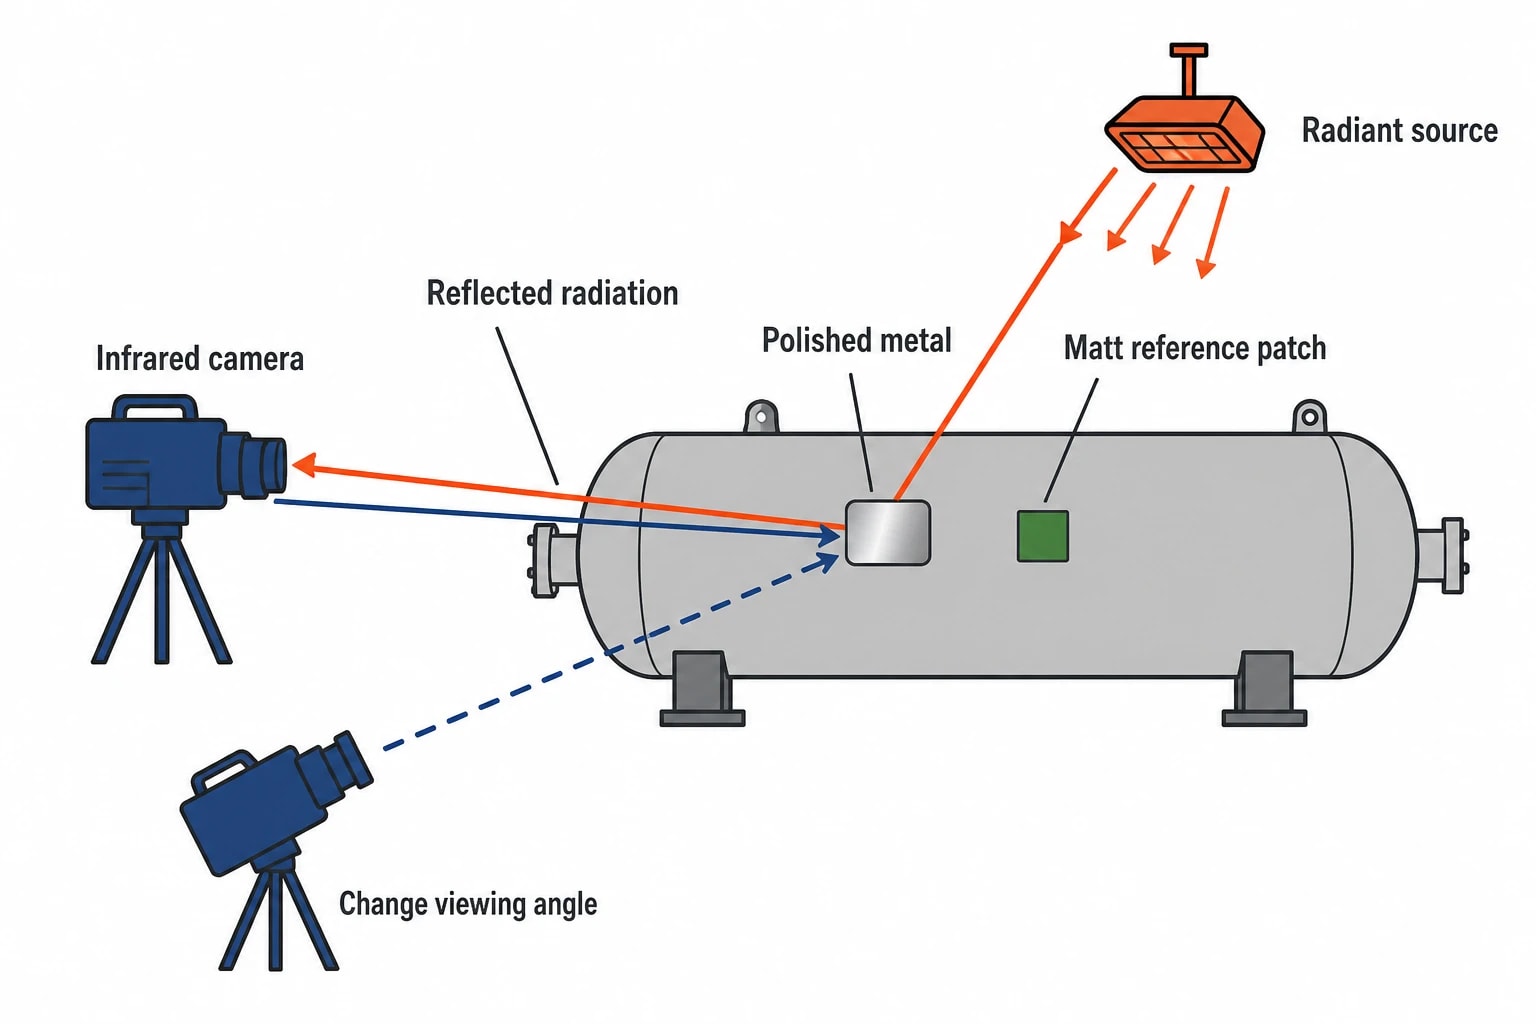
Emissivity describes how effectively a surface emits infrared radiation. Matt painted surfaces often provide better conditions for thermal measurement than bare, polished or heavily reflective metal. Shiny metal can reflect infrared radiation from its surroundings and appear warmer or cooler than its actual surface temperature.
ISO 18434-1:2008 requires users making quantitative temperature measurements to consider emissivity, reflected apparent temperature and attenuating media. These factors separate a reliable temperature assessment from a misleading reading.
The thermographer should identify the surface material and coating, set appropriate camera parameters and document assumptions. Where accurate temperature is important, the work may use a suitable high-emissivity reference area, a safe contact measurement or a repeatable comparative approach.
Reflections, sunlight and weather can distort readings
Thermal cameras can capture reflected radiation from the sun, sky, hot furnaces, lighting and nearby equipment. HSE warns that coating emissivity and solar reflections can distort thermography readings.
External inspections benefit from stable conditions. Solar heating can make one side of a vessel appear anomalous despite sound insulation. Wind cools surfaces and can reduce visible contrast. Rain affects cladding and surface temperature. A report should record inspection time, weather, ambient conditions and asset operating state.
Inside a plant, the surveyor should look for reflections from radiant heaters, hot product, open doors and adjacent plant. Changing the viewing angle can help distinguish reflected radiation from a genuine surface-temperature anomaly.
Line of sight defines the inspection boundary
HSE describes thermography as non-contact and line-of-sight. The technique detects faults that create a change in heat flow or surface temperature at the accessible surface.
Cladding, guards, access restrictions, dust, steam plumes and complex equipment geometry can conceal the relevant area. Survey planning should identify safe viewing positions and ensure each target operates at a representative condition.
Teams can inspect accessible plant while it remains in service, then reserve intrusive work for anomalies supported by operating evidence and engineering judgement.

Identify where your plant is losing energy and quantify the savings potential — our audits map every heat source, sink, and waste stream in your facility.
How to plan an industrial thermal imaging survey
Define the decision the survey must support
“Scan the factory” produces images. A defined survey scope produces maintenance and energy decisions.
For heat-loss work, priority assets may include furnaces, thermal-oil systems, steam distribution, process vessels, hot-water loops, dryers, ovens and heat-exchanger shells. For reliability work, the route may also include switchgear, drives and rotating equipment.
The site team should identify high-energy assets, normal operating temperatures, production schedules, known defects and locations where operators report excessive radiant heat. Metered fuel and electricity consumption helps identify where a thermal finding could have material operational value. Production information helps distinguish a genuine defect from a change caused by throughput, product mix or operating hours.
Inspect at representative operating conditions
Thermal contrast is strongest when the asset carries meaningful thermal or electrical load. A furnace during heat-up can show a different pattern from one at steady production. A process line may appear cool when idle. An electrical connection may reveal high resistance only under substantial current.
The survey plan should specify:
- The operating condition required for each asset.
- The available observation point and necessary safety controls.
- Comparable assets or reference areas.
- Supporting measurements, such as current, process temperature, pressure or flow.
- The responsible person who will review each finding.
This preparation reduces repeat visits and gives maintenance teams evidence they can use.
Include safety and access in the scope
Non-contact imaging reduces the need to touch hot equipment, but it does not remove site hazards. Hot surfaces, moving machinery, vehicle routes, live electrical equipment, work at height and potential process releases require proper controls.
Electrical inspections need particular care. Site rules, competent-person requirements, arc-flash precautions and enclosure integrity determine whether a thermal inspection is appropriate. The inspection should not introduce a greater risk than the fault being investigated.
Turning thermal images into repair priorities
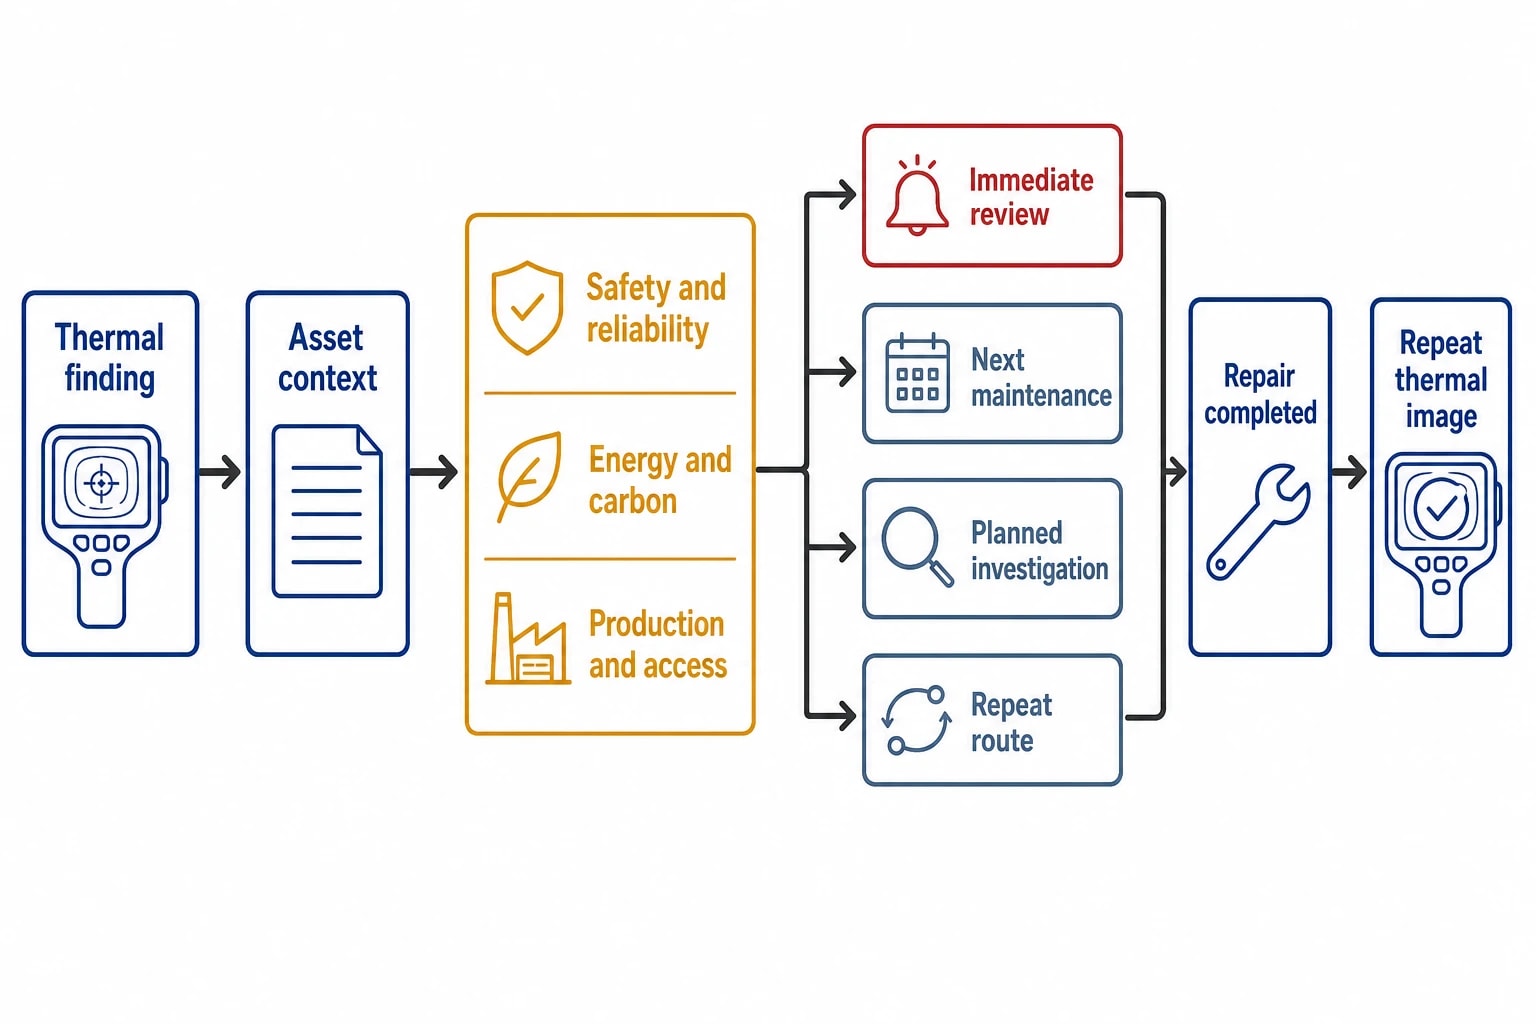
Build a decision-ready finding register
A thermal image without asset information soon loses value. Each finding should connect the image to an asset tag, location, process duty, observed condition, inspection date, survey settings and operating state.
The report should classify action requirements. Suitable categories include immediate safety or reliability review, repair at the next maintenance opportunity, planned investigation and monitoring on a repeat route.
Heat-loss findings should identify the visible insulation or containment defect, along with the site information needed to estimate energy and carbon impact. That assessment may require asset dimensions, insulation construction, surface temperature, process temperature, ambient conditions and annual operating hours.
Balance risk, energy and production impact
A small defect on a continuously operated, high-temperature line can merit action ahead of a larger anomaly on seldom-used equipment. A hot electrical connection may need urgent examination even if its direct energy loss is modest. A wet-insulation indication may move up the programme because of its asset-integrity implications.
A repair priority should consider:
- Safety and process risk
- Fuel or electricity reduction potential
- Production impact and available shutdown windows
- Repair cost and access requirements
- Expected maintenance benefit and asset life
- Carbon reduction and compliance evidence
This approach converts visual evidence into a practical maintenance programme. It also prevents a visually dramatic image from automatically taking precedence over a smaller, continuous loss with greater annual cost.
Verify repairs and retain evidence
A repeat thermal image can confirm that a repaired insulation section, door seal or electrical connection no longer displays the previous anomaly. It is a useful quality check, though it does not independently prove annual energy savings.
Measurement and verification should suit the scale of the work. IPMVP provides recognised approaches for assessing isolated measures and whole-facility performance. An insulation repair may use pre- and post-repair measurements around the affected system. A wider process-heat programme may require metering, production-normalised analysis and clearly defined measurement boundaries.
The baseline should capture the variables that affect energy use, including throughput, operating hours, process temperatures, fuel consumption and ambient conditions. Commissioning records and repeat images provide a clear record from finding to repair to confirmed condition.
Industrial thermal imaging surveys and UK energy compliance
Supporting ESOS evidence and energy management
ESOS assessments cover buildings, industrial processes and transport. The Phase 4 compliance deadline is 5 December 2027. An industrial thermal imaging survey can contribute evidence to a wider energy assessment by locating heat-loss defects and supporting prioritised measures in significant energy-use areas.
Thermal images do not replace consumption data, process information or costed recommendations. They show the physical condition behind a potential energy opportunity and can help maintenance, operations and finance teams agree the repair scope.
A certified ISO 50001:2018 energy management system remains an ESOS compliance route where it covers the relevant energy supplies. ISO confirmed the current edition in 2024. Repeatable thermography routes, controlled reporting and post-repair checks can support the standard’s continual-improvement cycle for energy performance, energy use and energy consumption.
Environmental permits require systematic energy control
The Environment Agency states that Part A(1) industrial installations regulated under the Environmental Permitting Regulations 2010 must follow energy-efficiency measures when applying for and complying with environmental permits. Its guidance expects operators to operate and maintain an installation within an energy-management system such as ISO 50001, or apply the relevant energy-efficiency techniques in the Reference Document on Best Available Techniques for Energy Efficiency.
For permitted installations, thermal-survey findings should enter the existing energy-management process. Site teams should assign the action, track completion, retain inspection evidence and review whether the repair reduced the observed heat loss or process waste.
This article reflects the independent analysis and editorial opinion of EnerTherm Engineering. Product names, trademarks, and brands mentioned belong to their respective owners. EnerTherm Engineering is not affiliated with, endorsed by, or a licensee of any third-party software or product mentioned unless explicitly stated.

Managing Director — EnerTherm Engineering
Dr. François Pierrel is Managing Director of EnerTherm Engineering with over two decades of expertise in thermal design, heat transfer, and industrial energy optimisation. He holds a PhD in Heat Transfer from Cranfield University and a Post-Doctorate from Heriot-Watt University.
