Extracting PLC Data Safely for ISO 14064 Audits
Using NAMUR Open Architecture to automate emissions reporting without risking GMP.
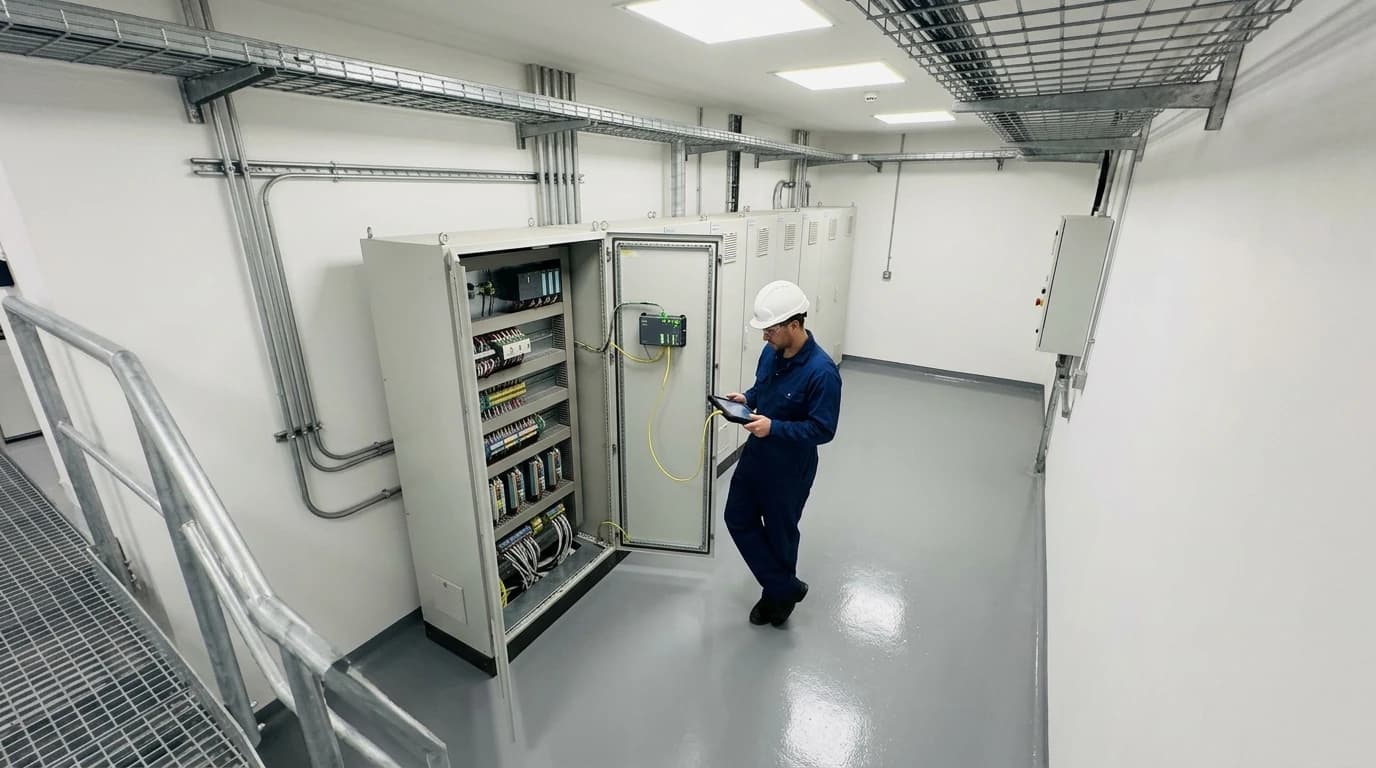
PLC data integration for environmental monitoring is the systematic extraction, consolidation, validation and transmission of operational data from programmable logic controllers (PLCs) to environmental reporting platforms. Industrial facilities in the chemical, pharmaceutical, and food and beverage sectors consume electricity, natural gas, steam, water, compressed air and other utilities. Gathering these metrics manually in spreadsheets is slow, prone to human error and often inadequate for regulatory audits. Automating the process requires access to data from controllers managing plant processes. Control engineers may worry that extracting legacy automation data could compromise production integrity, affect Good Manufacturing Practice (GMP) controls or introduce cybersecurity vulnerabilities. The data flow must therefore be non-invasive.

Omni Vision delivers turnkey utility metering, CO2 tracking, and AI-powered production KPI intelligence — giving you real-time dashboards and actionable insights across your entire facility.
Defining PLC Data Integration for Environmental Monitoring
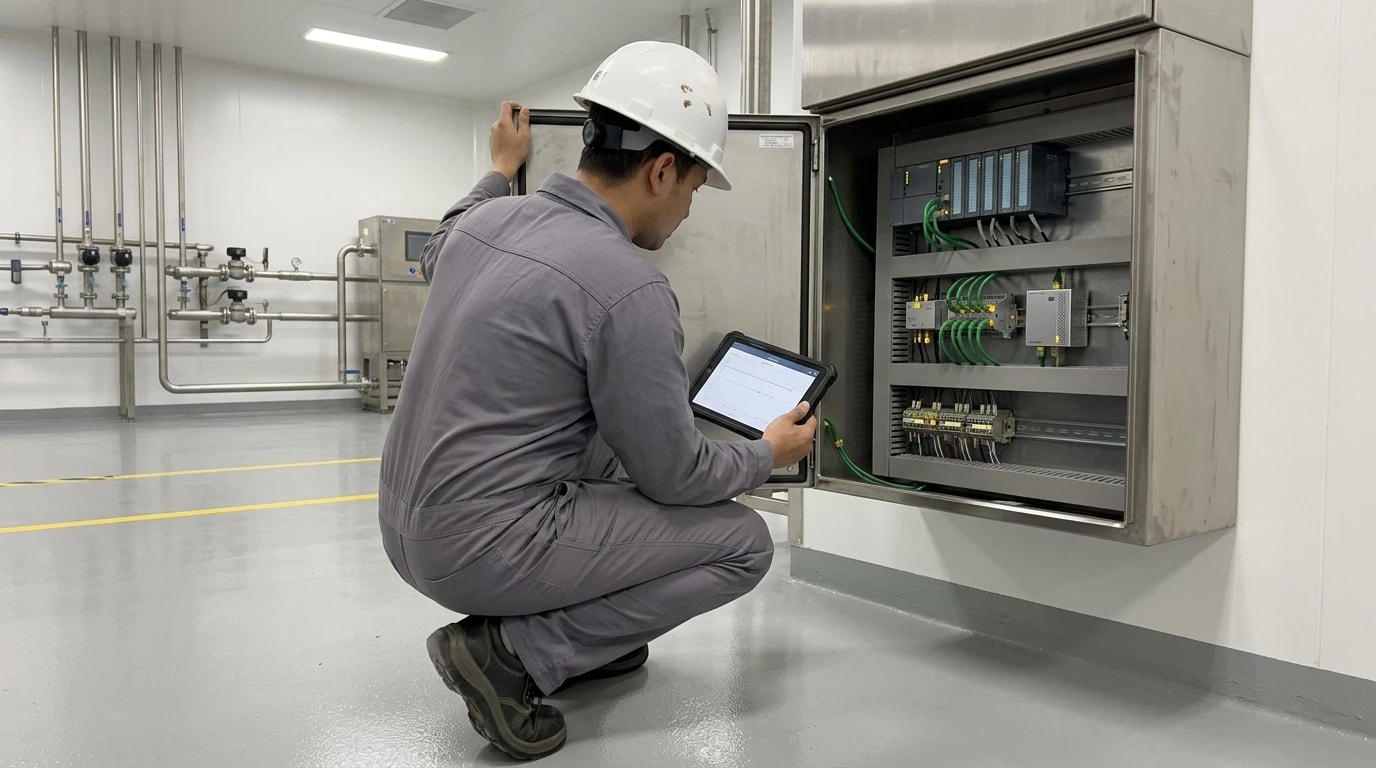
Environmental monitoring is the continuous, documented measurement of environmental conditions, resource use, emissions sources and relevant process parameters. In industry, it covers compliance-critical conditions, such as cleanroom pressure or effluent flow, and the measurements used to calculate energy consumption, greenhouse-gas inventories and environmental performance indicators.
Automated reporting requires direct data capture from the plant floor. PLCs hold real-time telemetry for raw materials, fuel consumption, energy use, utility flows and process conditions. Extracting that data can underpin modern compliance.
What an Effective Environmental Monitoring System Measures
A useful environmental monitoring system defines each monitored point before collection begins: the source asset, meter or sensor, engineering unit, sampling interval, calibration status, data owner and reporting purpose. This creates a defensible link between a reported figure and its physical measurement.
Typical PLC-derived environmental monitoring data includes:
- Electricity import, export, demand and consumption by site, building, line or production batch.
- Natural gas, fuel oil, steam, compressed air and water consumption.
- Boiler, CHP, thermal oxidiser, HVAC and refrigeration operating data.
- Flow, temperature, pressure, humidity, differential pressure and airflow measurements.
- Wastewater flow, pump runtimes and treatment-plant operating conditions.
- Production counts, batch identifiers and operating hours used to normalise environmental KPIs.
- Meter health, communications status, alarms, calibration records and missing-data events.
The environmental platform should retain original engineering units and source timestamps, then apply documented conversions and approved emissions factors in the reporting layer. A change to a reporting assumption must not overwrite the raw plant evidence.
Why Manual Spreadsheet Tracking Fails Modern Regulatory Audits
Manufacturers must prove the accuracy of sustainability claims under audit. During third-party assessments of corporate carbon footprints, verifiers review raw source data. Manual spreadsheets may not provide a reliable audit trail. A logbook entry for steam-boiler gas consumption may not show when the measurement occurred, who recorded it or whether the meter was functioning. Manual entry also introduces transcription errors that distort calculations. Automated PLC data collection can create timestamped, traceable records that support independent verification.
The Core Challenge: Balancing Data Accessibility with Plant Safety
Control engineers prioritise plant availability and process safety. A running production line relies on stable, deterministic communication between PLCs, human-machine interfaces (HMIs) and field instruments. External queries to a legacy PLC can consume network bandwidth and processor cycles. In extreme cases, this can delay control communications or trip PLC watchdogs, halting production. External connections also introduce the risk of unauthorised write access. Writing to an internal register could alter process setpoints, compromise product quality or damage machinery.
Accommodating Legacy Automation Environments
Many sites operate mixed automation environments. One manufacturing bay may contain a decade-old PLC running a proprietary, unencrypted protocol alongside a modern controller using standard fieldbus interfaces. Replacing legacy PLCs is rarely commercially viable because upgrades require extensive engineering, process downtime and capital expenditure. Environmental monitoring must therefore extract data from older PLCs without modifying control code or risking operational stability.
The Regulatory Driver: Aligning PLC Data with ISO 14064-1:2018
Industrial emissions reporting is not always voluntary. International standards set out how organisations quantify and verify environmental impact.
Direct vs. Indirect Emissions Quantification
ISO 14064-1:2018 requires organisations to identify and report greenhouse-gas (GHG) emissions and removals using six inventory categories, rather than only a direct-versus-indirect split. These are direct GHG emissions and removals; indirect GHG emissions from imported energy; indirect GHG emissions from transportation; indirect GHG emissions from products used by the organisation; indirect GHG emissions associated with the use of products from the organisation; and indirect GHG emissions from other sources.
For industrial facilities, PLC and meter data commonly supports direct emissions from on-site fuel combustion, such as boilers, CHP plants and thermal oxidisers, and indirect emissions from imported electricity, steam, heating or cooling. It can also support allocation, normalisation and quality checks for other relevant categories, although supplier, logistics, procurement and product-use information is often required. Gas flowmeters, electricity meters and steam integrators provide high-resolution consumption data instead of broad industry averages.
Data Integrity and Quality Management under ISO 14064-1:2018
ISO 14064-1:2018 requires data-quality management procedures that minimise uncertainty and ensure accuracy. Automated collection can reduce manual handling by preserving metadata such as sensor ID, physical unit and collection timestamp.
Environmental monitoring evidence should preserve the raw plant value, collection time, source asset, transformation applied and final reporting value. Role-based access controls should govern changes to tag mappings, emissions factors, calculation logic and exported reports. Where corrections are necessary, the platform should retain the original record with a dated, attributable correction history rather than silently replacing it. Time synchronisation, backups, access reviews, calibration evidence and tested recovery procedures help show verifiers that the environmental record is available and trustworthy.
Continuous Validation and Anomaly Detection
Auditors need evidence of how historical data has been managed. Continuous logging can provide an unbroken record of collection activity. If a power outage, communications interruption or sensor failure occurs, the platform should flag the gap and isolate the affected period. Engineers can record monitored-asset uptime and downtime, then apply a documented, approved method where estimation is necessary.
The platform should identify implausible meter resets, negative consumption, values outside the instrument range, flatlined readings, duplicate timestamps and discrepancies between a sub-meter total and its parent meter. Exceptions should retain their cause, reviewer, corrective action and any approved estimation method so quality assurance remains visible to the verifier.

Track energy consumption, emissions, and process parameters with seamless PLC/SCADA integration via Modbus, OPC-UA, and MQTT protocols.
The NAMUR Open Architecture (NOA) Framework for Non-Invasive Extraction
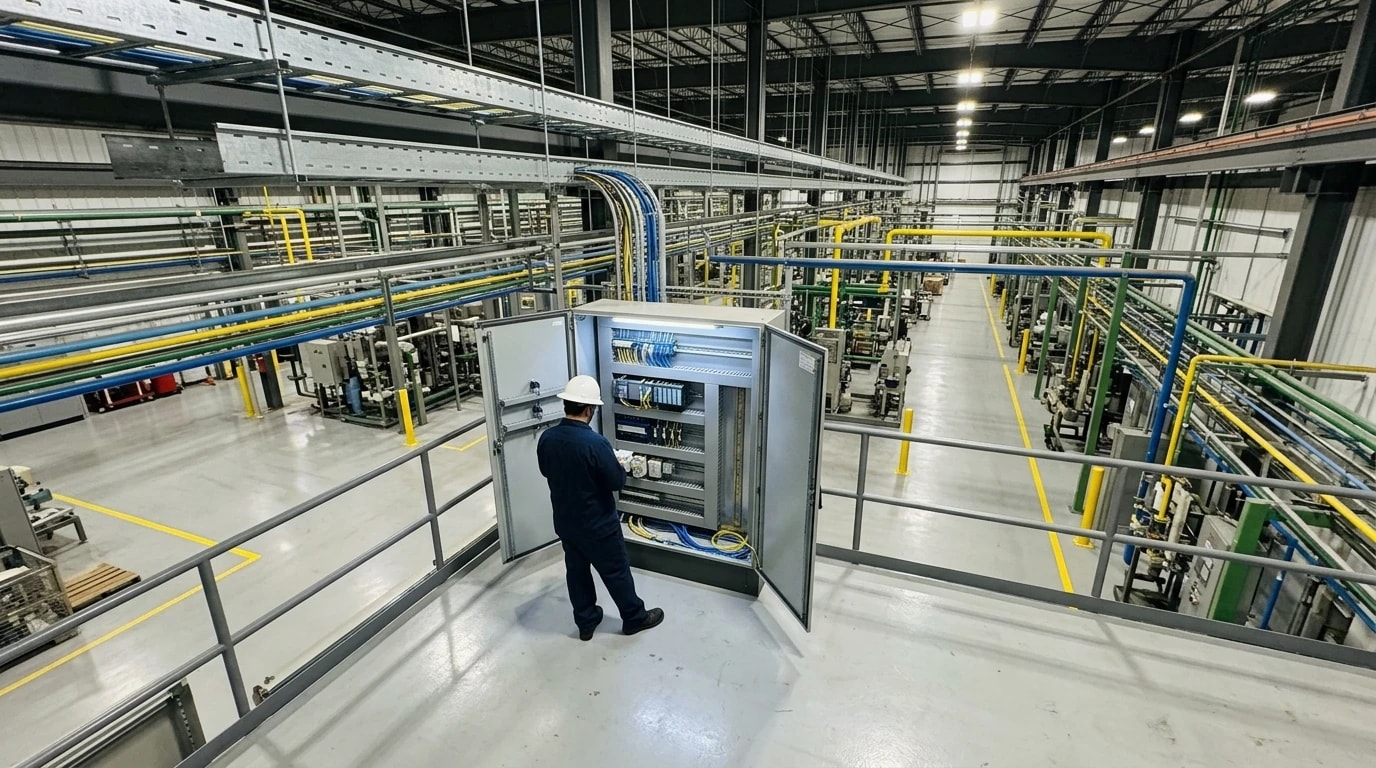
The process automation industry developed the NAMUR Open Architecture (NOA) concept to extract operational technology (OT) data safely. It provides a structured method for sharing data without compromising the primary automation system.
The Principle of the "Second Channel"
NAMUR Recommendation NE 175 describes NOA and its second communication channel. The primary channel handles critical, real-time control within the Core Process Control (CPC) zone; the secondary channel is dedicated to monitoring and optimisation (M+O). This allows monitoring applications to access controller data without interfering with core plant operations.
Protecting the Core Process Control (CPC) Zone
In an NOA setup, legacy PLCs and field devices remain in their deterministic control environments while the secondary channel supports monitoring and optimisation. Separation between CPC and M+O functions helps limit the effect that a software malfunction or network failure could have on production assets.
Replicating Data Safely with the NOA Security Gateway (NE 177)
NAMUR Recommendation NE 177 covers NOA security zones and the NOA Security Gateway. For environmental monitoring, the gateway should use an approved tag list rather than unrestricted PLC browsing. Each tag should specify its PLC address, data type, scaling, unit, polling frequency, asset association, and whether it is a cumulative total, instantaneous value, state or alarm. This makes collection predictable, limits the load on older PLCs and provides a controlled basis for reviewing additions.
Maintaining Compliance in Regulated Environments (GMP & HACCP)
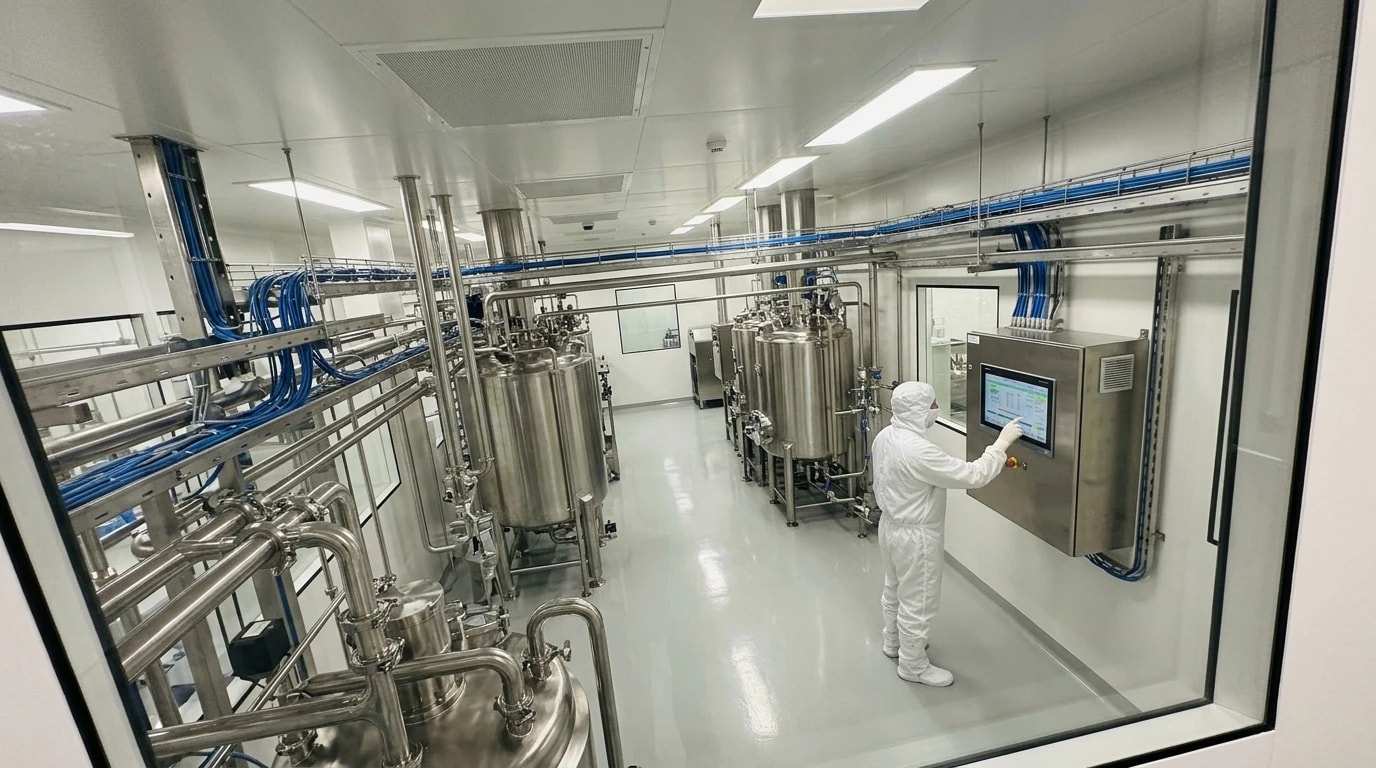
Regulated manufacturers operate under strict quality frameworks. Environmental tracking technology must respect these compliance boundaries.
The "Read-Only" Constraint in Pharmaceutical Production
Pharmaceutical manufacturers must comply with GMP requirements. Any change to a validated system, including PLCs, SCADA networks or historians, can trigger complex change control and revalidation. FDA 21 CFR Part 11 applies to electronic records and electronic signatures within its scope; European Annex 11 addresses computerised systems used in GMP-regulated activities. A monitoring design should therefore be assessed through the site’s change-control, validation, data-integrity and risk-management procedures before deployment.
| Parameter | GMP Control Level | Environmental Monitoring Level |
|---|---|---|
| System purpose | Process control and product-quality operations | Environmental analysis and reporting |
| Change control | Managed through the validated-system lifecycle | Assessed according to the reporting system’s intended use and site procedures |
| Data use | Supports operational control and quality decisions | Provides a separate traceable view for environmental calculations and KPIs |
| System ownership | Production, engineering and quality functions | Sustainability, energy and environmental reporting functions |
Cleanroom Integrity and Airflow Monitoring
In sterile pharmaceutical manufacturing, environmental monitoring includes critical cleanroom parameters as well as carbon emissions. Facilities continuously monitor differential pressure, relative humidity, temperature and airflow velocity to maintain cleanroom integrity. Dedicated HVAC PLCs manage these parameters. Integrating PLC data into a centralised sustainability and compliance platform provides a continuous, high-fidelity log. If a cleanroom boundary experiences a pressure drop, the platform records the event so quality teams can correlate production conditions with energy consumption.
The environmental reporting layer must not replace the validated building-management, SCADA, alarm-management or quality systems that govern the cleanroom. It creates a separate, traceable view for analysis and reporting; approved plant systems retain responsibility for operational alarms, product decisions and corrective action.
Continuous Validation without Re-Validation Loops
For chemical processors and food and beverage manufacturers operating under HACCP guidelines, separating the reporting layer from physical control can make reporting updates easier to manage. If the sustainability team changes carbon emission factors, reporting schedules or environmental KPIs, the changes can be controlled within the reporting system. The site should assess their effect on plant systems, validated records and applicable change-control procedures before implementation.
The Omni Vision Energy Intelligence Platform Architecture
Moving from spreadsheet tracking to real-time environmental compliance requires a platform that balances technical security with analytical capability.
Precision Hardware Integration for Six Core Utility Streams
EnerTherm Engineering developed the Omni Vision Energy Intelligence Platform to monitor six core utility streams: electricity, gas, water, steam, compressed air and oil. The platform can integrate meter and PLC data through Modbus, OPC UA, BACnet and MQTT, subject to the site’s approved architecture and equipment capabilities. Implementation should follow the requirements above: controlled tag selection, documented units and scaling, source timestamps, and traceable reporting calculations.
Cloud Intelligence and AI-Driven Anomaly Detection
The physical integration layer is paired with EPSA’s cloud-based AI analytics engine. The platform can forecast, map baselines and calculate production-linked KPIs, such as energy consumed per batch or carbon cost per tonne of finished product. It can identify anomalies in utility consumption and permit-related operating thresholds.
Alerts should use operationally meaningful thresholds: unexpected overnight baseload, excessive compressed-air demand, abnormal boiler fuel use, water-flow spikes, meter communications loss or a missing cleanroom-condition reading. Each alert should prompt a documented investigation, not be treated as evidence of an environmental event.
Standardised Turnkey Deployment and Proven Outcomes
Deployment scope, duration, resource requirements, savings and return on investment depend on site conditions, existing instrumentation, data quality, integration complexity, operating patterns and the actions taken after insights are identified. The Omni Vision platform can provide sustainability officers and energy managers with consolidated environmental data for reporting programmes and frameworks including SECR, ESOS, EU ETS, EPA, TCFD, CDP, ISO 50001 and ISO 14064. Organisations remain responsible for determining the applicability of each framework and ensuring that their reported inventory and supporting evidence meet the relevant requirements.

Technical Manager — EnerTherm Engineering
John Naranjo is Technical Manager at EnerTherm Engineering, bringing specialist expertise in chemical and environmental engineering. He recently led the implementation of Omni Vision, EnerTherm's real-time energy and utility monitoring platform. He holds an MSc in Environmental Engineering from the University of Huelva and a BSc in Chemical Engineering, with memberships in both the Energy Institute and IChemE.
